CITY OF SOUTH MIAMI
Parks and Recreation Master Plan
←
→
Page content transcription
If your browser does not render page correctly, please read the page content below
CITY OF SOUTH MIAMI Parks and Recreation Master Plan
PREPARED BY:

2
CONTENTS
Acknowledgements                           4

Executive Summary                          5

Chapter 1                                  7
Introduction

Chapter 2                                  10
Community Profile

Chapter 3                                  20
Existing Parks, Facilities, and Programs

Chapter 4                                  28
Public Involvement

Chapter 5                                  34
Demand Analysis

Chapter 6                                  48
Planning Recommendations

Chapter 7                                  57
Planning Implementation

                                                3
Acknowledgements
            The development of the City of South Miami Parks and Recreation Master Plan has been a collaborative

    effort between City officials, staff, and residents, and the Miller Legg team.

            The project team would like to offer their deepest gratitude to those residents who participated in the

    public workshops and online public survey which informed this Plan. Your contributions have been an integral part

    of the planning process.

    Project Team
    CITY OF SOUTH MIAMI                                                MILLER LEGG

    Mayor                             Philip K. Stoddard               Principal-in-Charge      Mike Kroll, RLA, FASLA

    Vice Mayor                             Robert Welsh                Planner                     Vanessa Ruiz, RLA

    Commissioner                       Gabriel Edmond

    Commissioner                          Josh Liebman

    Commissioner                           Walter Harris

    City Manager                      Steven Alexander

    Deputy City Manager                     Shari Kamali

    Director of Parks & Recreation       Quentin Pough

4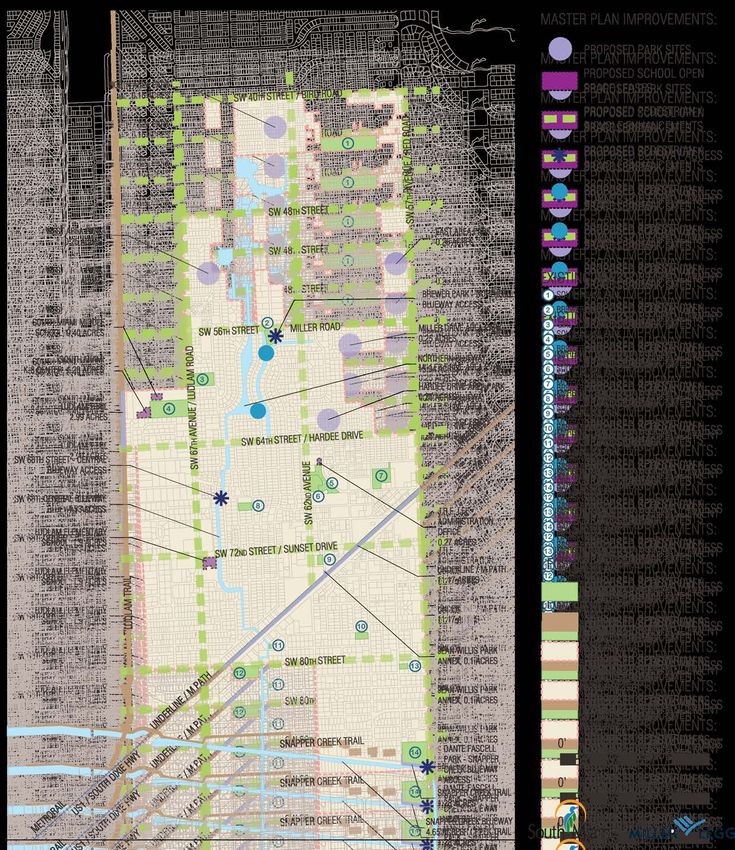
Executive Summary
         The City of South Miami desires to exemplify        demonstrated the operational areas the City should

excellence in parks and recreation, and become a             most urgently address.

model municipality recognized for its excellent parks
                                                                      The most urgent operational changes for the
and recreation facilities and programs. To meet the
                                                             City include enhancing their full-time to part-time
current and future parks and recreation needs of the
                                                             employee ratio by increasing part-time staffing. This
City, as well as national and regional standards, it is
                                                             additional staffing will allow the City to implement the
recommended that the City of South Miami implement
                                                             urgent maintenance needs to be addressed in Phase
changes that address the major areas described
                                                             One, as well as provide for regular maintenance,
below:
                                                             inspections, and improved servicing of the facilities

                                                             as the facilities are enhanced and the parks system

Urgent Maintenance                                           expanded throughout the planning period.

         Based on input from the public, input from

the City, and an analysis of existing site conditions,       Land Changes
maintenance needs have been prioritized to first resolve
                                                                      The   City’s   Comprehensive      Plan   currently
issues relating to safety and liability. These maintenance
                                                             requires 4 acres of park land per 1,000 residents. To
needs include replacement of deteriorating park
                                                             comply with this level-of-service requirement, the City
components and addition of new components that
                                                             will need to add 8 acres to come into compliance
improve safety. Such items include the deteriorated
                                                             now, or 20.5 more acres over the next ten years, to their
railroad tie fencing around Dante Fascell Park that is
                                                             existing 48 acres in their parks and recreation system.
creosote-laiden, and in need of serious repair; fencing

along the canal at Brewer Park which is missing pickets in

areas near the playground; and the addition of fencing          Required Parkland Acres by Phase (4
and lighting at Van Smith Park to prevent unwanted
                                                                     acres per 1,000 persons)
night-time activity, and preserve privacy for adjacent                                       (Projected) Required
                                                                       Phase                 Population1 Acres
residents. These, and other maintenance items, have
                                                             Phase One (2016-2017)                 13,932     55.7
been outlined in this Plan as part of the immediate
                                                             Phase Two (2018-2020)                 15,511     62.0
costs necessary to implement Phase One of the Plan.
                                                             Phase Three (2021-2025)               17,084     68.3
                                                             Table 1.1 Required Park Land Acres by Phase (4 acres per
                                                             1,000 persons)

Urgent Operational Changes                                   Notes:
                                                             1. Bureau of Economic and Business Research. (2015).
                                                             Population Projection by Age for 2000-2040. University of
         A comparison of existing operations to national     Florida. Retrieved from http://flhousingdata.shimberg.ufl.
and regional standards, as illustrated in Chapter 5,

                                                                                                                           5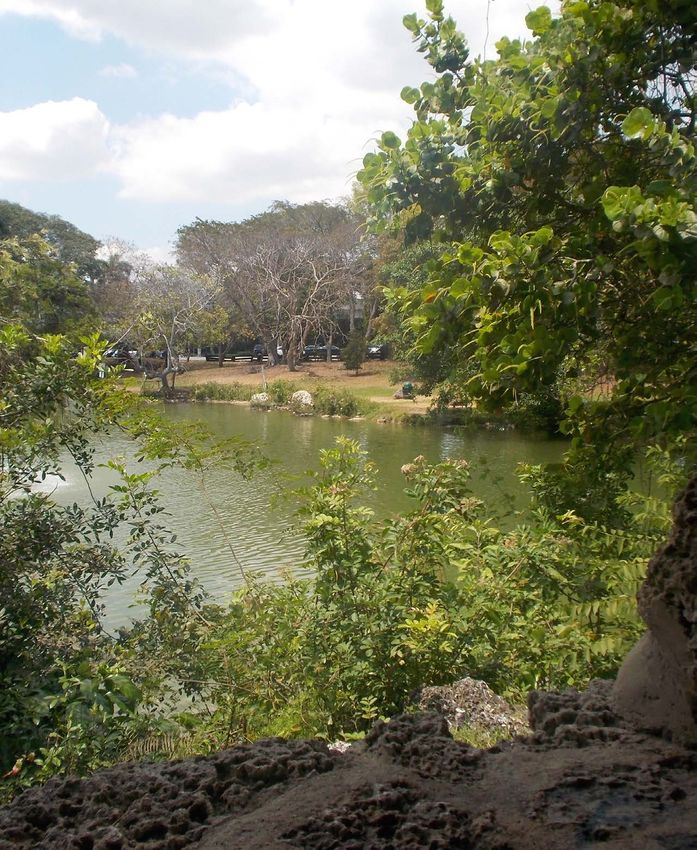
The increase in park land will enable the City        raise the standard of South Miami’s parks system to be

    to provide additional facilities based on current and         on par with other nearby communities, and to serve as

    anticipated demands of certain uses as identified             a role model for municipal parks systems.

    from population projections, public input and national

    standards illustrated in this document. The solutions

    discussed in this plan include some options that are

    based on use agreements, which can greatly reduce

    the costs of attaining park land.

            Other solutions to attaining the required park

    land are based on a need for improved geographical

    distribution of parks within the City. Strategic areas have

    been identified that currently do not provide residents

    with a park within a walkable distance. Attaining parks

    in the strategic locations identified in this plan will

    provide many residents with a park that is a five-minute

    walk from their home.

    Annual Increase of Operating
    Funds
            To ensure the City is able to realize the

    recommendations of this Plan, the City should utilize

    the Plan as a guide for providing an annual increase of

    operating funds that incorporates the anticipated costs
    for each phase of this Plan into the annual budget.

            Since phases of this plan range from immediate

    needs to a five-year planning period, formulation

    of the annual increase in funds should be done with

    consideration of those recommendations that may

    take more than a year to implement.

            The    anticipated     costs    including    land,

    improvements, staffing, and operations, are outlined in

    Chapter 7, Planning Implementations.

            Implementation in these areas is the first of many

    steps outlined in this Master Plan needed to ultimately

6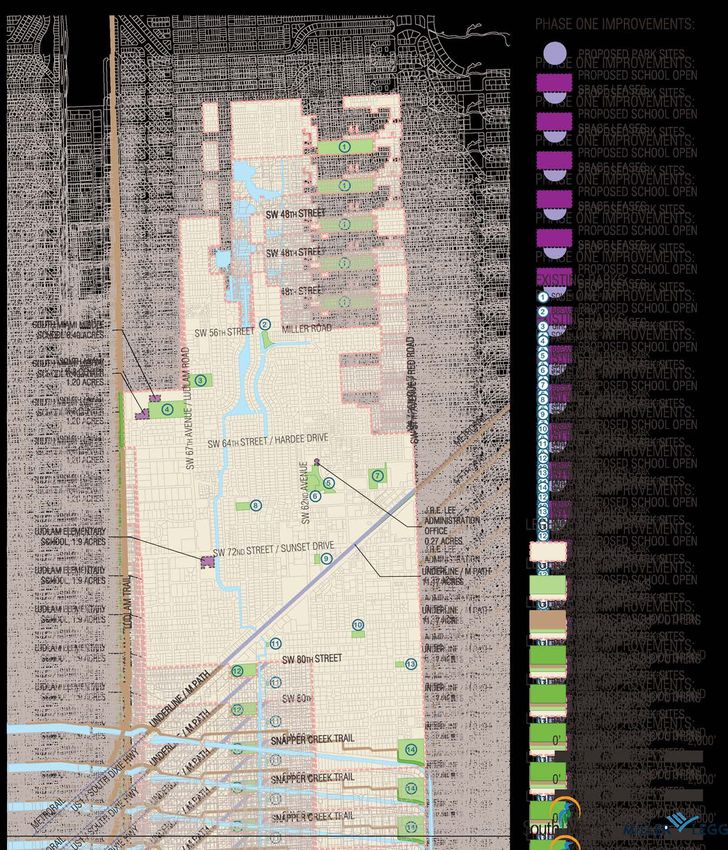
CHAPTER 1: INTRODUCTION
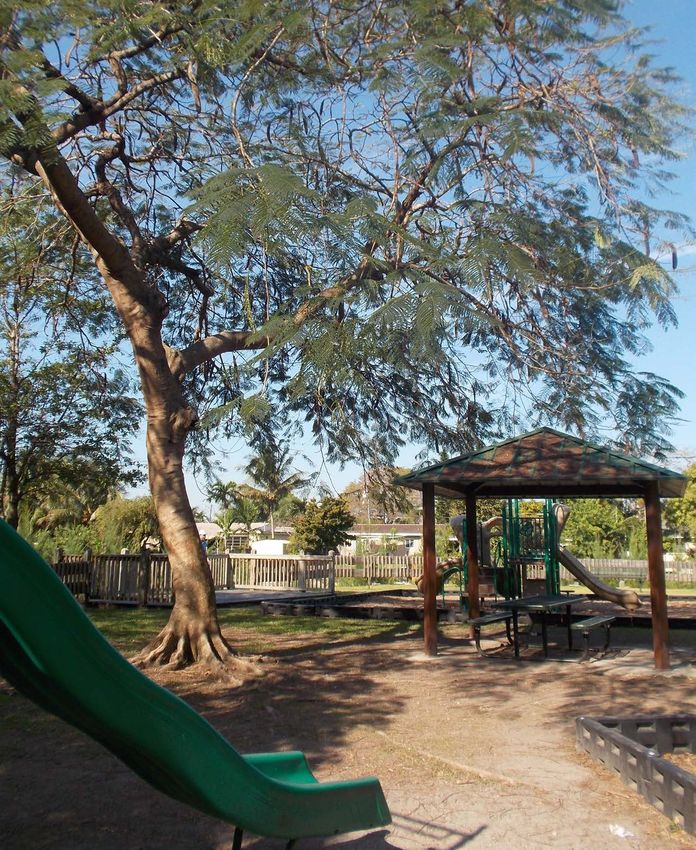
Figure 1.1 Dante Fascell Park
Chapter 1: Introduction 7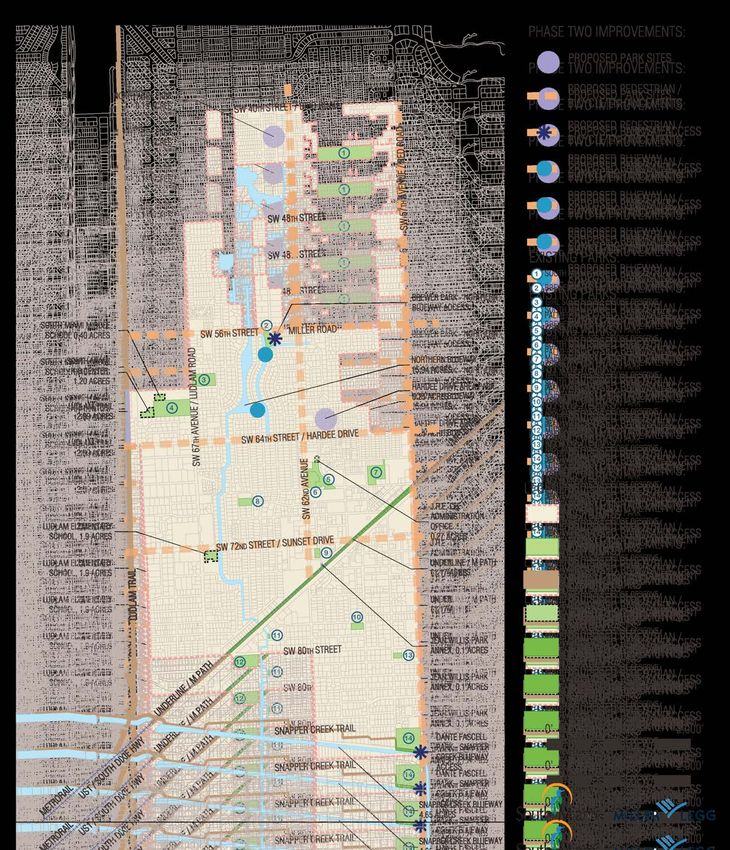
Benefits of Parks & Recreation reduced juvenile delinquency, providing safe places
for youth to interact with one another.
and the Need for a Vision Open space and recreational lands are
Public parks, recreation programs, and open recognized for more than their individual benefits.
spaces are crucial elements to the City of South Miami’s There are broad public values in the improvement of
vision. They define the built environment and support air quality and reduction of noise, protection of habitat
an improved quality of life for City residents, making for animal and plant species, and visual relief from the
South Miami a great place to live, work and play. complexity of the urban environment. This Parks and
Recreation Master Plan was created to ensure that
South Miami has always had a strong
these values are met and continue to be provided to
commitment to recreation. City leaders have come to
all citizens of South Miami.
realize that open space and recreational opportunities
have had a major influence on how residents and
visitors perceive their community. The provision of
parks, recreational facilities, and open spaces is based
on the desire by most people to have opportunities for
the enjoyment of the outdoor environment in an urban
setting.
The physical and psychological benefits of
outdoor activities are well-accepted values. Access
to parks leads to increased physical exercise, which
helps improve overall health, including reducing the
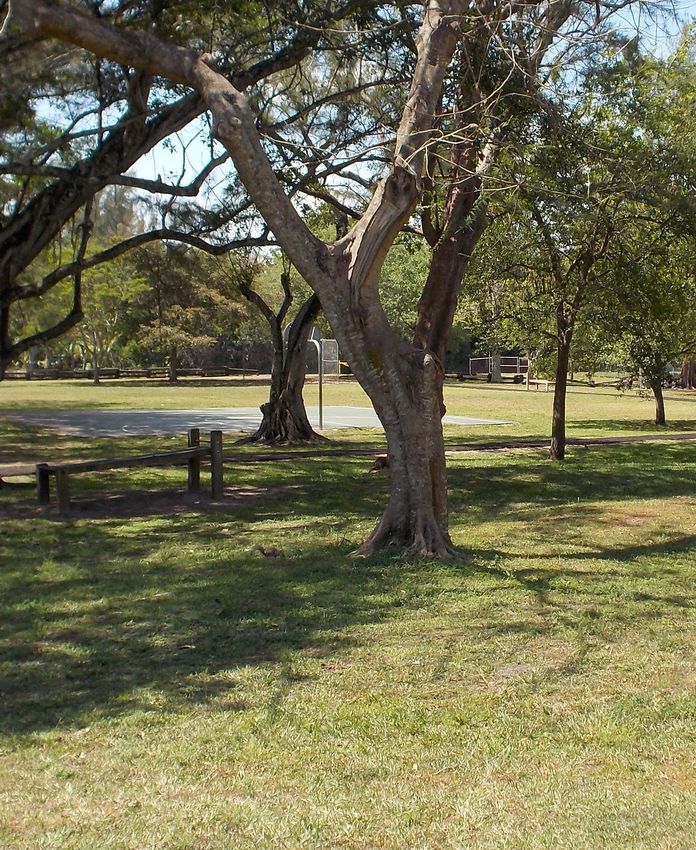
risk of obesity, heart disease, and diabetes. Parks also Figure 1.2 Parks provide opportunities to connect with
nature.
provide opportunities to connect with nature, socialize,
and participate in leisure activities, which reduces the
risk of stress-related disorders. Purpose of the Master Plan
Parks have also been shown to increase The Plan has been prepared in response to the
property values of adjacent property for both residential desire of the City’s inspired leadership and the residents
and commercial uses. Park availability can attract of South Miami to have an outstanding program of
new residents and work force, and park attendance recreation and park facilities for themselves and future
can lead to increased numbers of patrons to nearby generations as the City continues to mature over the
businesses. next ten years.
Social benefits include an enhanced sense of
community and place. Parks provide places for residents
to come together at community events and programs.
Park access has also been tied to crime reduction and
8 Chapter 1: Introduction
Visioning Process
This plan’s visioning process consisted of an
inventory and analysis of the City’s existing parks,
facilities, and programs; analysis of existing and
projected City demographics; a comparison to
national standards of parks, facilities, and services; and
consideration of the needs and desires of the City and
its residents.
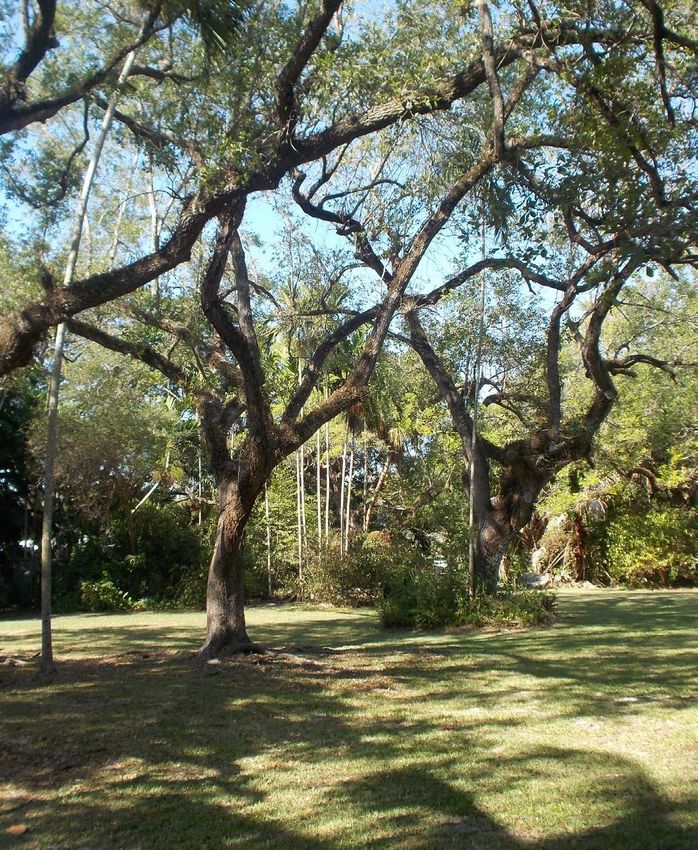
The inventory and analysis of the parks system
involved field visits by Miller Legg and MCHarry Architects
to determine the conditions of the facilities’ existing Figure 1.3 Field visit at All America Park
condition, and to observe events and behaviors of each
site. Public involvement from online opinion surveys and
public workshops, which are detailed in this Plan, were
utilized during development of the recommendations.
Figure 1.4 Field visit at Jean Willis Park
Figure 1.5 Residents provide their input at a public workshop
Chapter 1: Introduction 9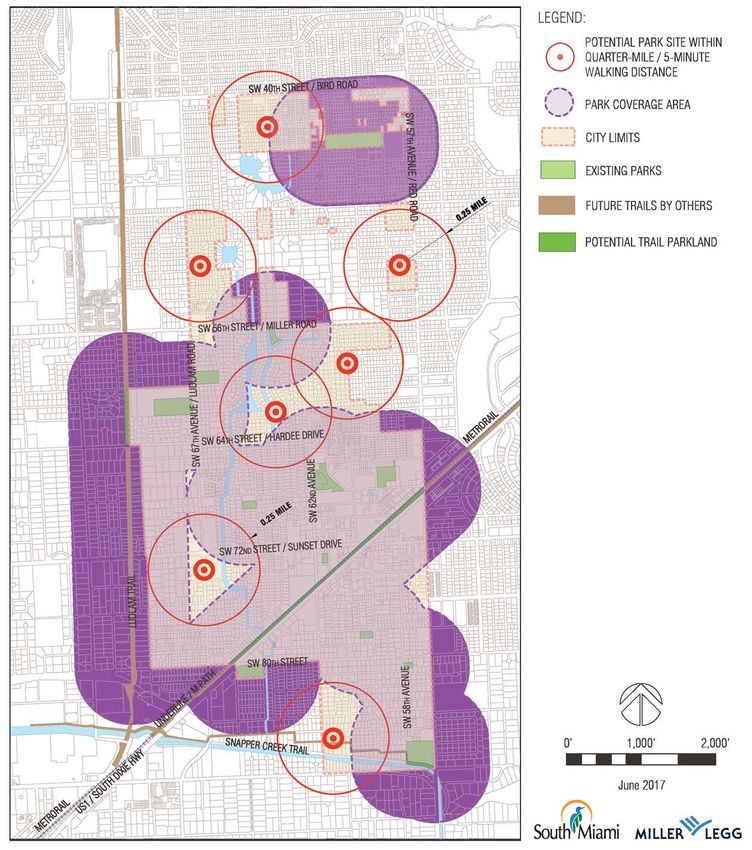
CHAPTER 2: COMMUNITY PROFILE

Figure 2.1 All America Park

  10         Chapter 2: Community Profile
Parks are essential to a person’s well-being.

However, what people need in a park, what they

envision as a park, and what they want to do at a park

varies greatly by individual, and even by community.

To understand what parks characteristics would

best suit the residents of South Miami, a study of their

demographics and significant city characteristics

were examined to build a profile of the City. This profile

allowed us to generalize needs and potential desires

for the population.

                                                             Chapter 2: Community Profile   11
Demographics
An examination of existing and forecasted demographic profile of South Miami that is pertinent to
demographic conditions for the City was undertaken recreational facility programming.
in development of the Plan. The following section
details the demographic characteristics by age, race
and ethnicity, economics, housing, and education. This
comprehensive demographical analysis was used to
evaluate City needs for park land acreage, facilities,
and services.
Parks data was gathered from field visits,
information received from the City of South Miami,
and the Miami-Dade County Property Appraiser. This
chapter of the Master Plan provides information on the
Overview
The City of South Miami is 2.27 square miles
in size with an estimated population of 13,9321. By
2025, the end of the planning period of this report,
the population is expected to grow by 23% to 17,084
residents1.
The City is mostly built out, with a number of
non-contiguous enclaves to the north. Population
growth will be accommodated by redevelopment
of properties at higher densities. The surrounding
areas are already urbanized as well with limited
large tracts of undeveloped land within or adjacent
to the City’s boundaries.
Figure 2.2 South Miami City Limits
1. Bureau of Economic and Business Research. (2015). Projected Total Population, South Miami, 2010-2040. University of
Florida. Retrieved from http://flhousingdata.shimberg.ufl.edu/a/profiles?action=results&nid=4372 (See Appendix B for
methodology)
12 Chapter 2: Community ProfileDemographic Data
South Miami Florida United States
Characteristic
Total Percentage Total Percentage Total Percentage
Total Population 13,932 1
19,361,792 2
314,107,084 2
Age
Median Age2 37.7 41.2 37.4
Age 0-19 3,152 1
22.6% 1
4,512,990 2
24.0% 2
83,267,5562 27.0%2
Age 20-39 4,5671 32.8%1 4,696,7702 25.0%2 82,829,5892 26.8%2
Age 40-59 3,5911 25.8%1 5,196,6982 27.6%2 85,562,4852 27.7%2
Age 60-75+ 2,6221 18.8%1 4,394,8522 23.4%2 57,085,9082 18.5%2
Race (2014 Estimates)2
White 9,2103 76.5% 14,747,196 76.2% 231,849,713 73.8%
Black or African American 2,1043 17.5% 3,114,841 16.1% 39,564,785 12.6%
American Indian and Alaskan Native 0 3
0.0% 59,121 0.3% 2,565,520 0.8%
Asian 309 3
2.6% 490,833 2.5% 15,710,659 5.0%
Native Hawaiian and other Pacific 03 0.0% 12,128 0.1% 535,761 0.2%
Islander
Some other race 1843 1.5% 484,274 2.5% 14,754,895 4.7%
Two or more Races 229 3
1.9% 453,399 2.3% 9,125,751 2.9%
Ethnicity (2014 Estimates)2
Hispanic 5,5783 46.3% 4,517,191 23.3% 53,070,096 16.9%
White, non-Hispanic 3,845 3
31.9% 10,958,680 56.6% 197,159,492 62.8%
Other, non-Hispanic 2,613 3
21.8% 3,885,921 20.1% 63,877,496 20.3%
Income (2014 Estimates) 2
Median Household Income $54,101 $47,212 $53,482
Per Capita Income $33,468 $26,499 $28,555
Families below poverty level 7.7% 12.2% 11.5%
Persons below poverty level 13.1% 16.5% 15.6%
Table 2.1 Demographic Data
Notes:
1. Bureau of Economic and Business Research. (2015). Population Projection by Age for 2000-2040. University of Florida.
Retrieved from http://flhousingdata.shimberg.ufl.edu/a/population?action=results&nid=4372
2. United States Census Bureau. (2014). 2010-2014 American Community Survey. Retrieved from http://factfinder.census.
gov/
Age
Age characteristics of a community can help the City of South Miami is 37.7, which is below the State
define what uses are most likely to be in higher demand of Florida’s median age of 41.2, and slightly above the
and to succeed if implemented. national median age of 37.4 (see Table 2.1). The age
breakdown from the BEBR 2015 population projection
According to the U.S. Census’ 2009-2013
found 3,152 aged 19 years and younger (22.6% of total
American Community Survey, the median age within
population), 4,567 aged 20-39 years (32.8% of total
Chapter 2: Community Profile 13City Population Projections by Age
Age Group 2015 Population 2020 Population 2025 Population Percent Change
Age 0-19 3,152 3,447 3,948 25.3%
Age 20-39 4,567 5,407 5,781 26.6%
Age 40-59 3,591 3,603 3,891 8.4%
Age 60-75+ 2,622 3,054 3,464 32.1%
Total 13,932 15,511 17,084 22.6%
Table 2.2 City Population Projections by Age
Notes:
1. Bureau of Economic and Business Research. (2015). Population Projection by Age for 2000-2040. University of Florida.
Retrieved from http://flhousingdata.shimberg.ufl.edu/a/population?action=results&nid=4372
population), 3,591 aged 40–59 years (25.8% of total
population), and 2,622 aged 60 and older (18.8% of
Race and Ethnicity
total population) (see Table 2.2). The BEBR population Race and ethnicity of a population can
projections show a steady increase in the percentage indicate whether some activities may be more popular
of those younger than 40; the least increase in the or not based on cultural differences. For instance, in
percent of the population between ages 40 to 59, and areas with a high percentage of hispanic residents,
the most increase in the percent of the population soccer is a frequent past-time for families, and soccer
aged 60 and older. league programs are well-attended.
Based on these projections, young adults The population of South Miami is comprised
and those over sixty years old are the fastest-growing of 76.5% white, 17.5% Black or African American, 2.6%
populations, while children and those in their forties and Asian,and 3.4% that identify as “some other race” or
fifties are the slowest-growing populations. “two races or more.” 46.3% identify themselves as
Hispanic or Latino with 59.9% of that group identifying
Proposed uses should take into account and
as Cuban. The percent of persons, age 5 years and
appeal to older populations and young adults to best
older, where language other than English was spoken
serve the City’s population.
at home is 48.4%.
Race Ethnicity
Figure 2.3 Demographic percentage by race Figure 2.4 Demographic percentage by ethnicity
14 Chapter 2: Community ProfileFrom Figures 2.3 and 2.4, it is evident that According to the “2009-2013 American
the City has a large hispanic population. The City is Community Survey” by the U. S. Census Bureau,
predominantly white, with the next largest racial group the Median household income in South Miami was
being black. estimated at $54,476, which is higher than the state’s
Median household income of $46,956, and the U.S.
Median household income of $53,046. The same survey
Economy estimated the City’s per capita income at $31,873,
which is also higher than the state’s per capita income
INCOME AND POVERTY
of $26,236, and the U.S. per capita income of $28,155.
Income can have a major impact on families The survey also estimated the persons in poverty within
and individuals, and on what sorts of recreation they the City at 14.2%, which is lower than the state’s poverty
are more likely to participate in. Those with little financial rate of 16.5%, and the U.S. poverty rate of 14.8%.
means may need recreational programs such as after
The “2009-2013 American Community Survey”
school care, certain fitness classes, public fitness centers
found that the percent of the population aged 16
and facilities, and other amenities to reduce their costs
years and older in the civilian labor force was 68.3%
on fitness. Those who have higher levels of income may
including participation by 64.6% of females aged 16
opt for private fitness groups, classes, or centers.
years and older. These rates are higher in comparison
An understanding of the income of a to the state’s, which has 59.7% of the population aged
community may also help in understanding what 16 years ond older in the civilian labor force, including
programs would succeed. For instance, activities which 55.6% female participation. The City’s rates are also
often pair with private lessons, or that require higher higher than the national rates, which includes 63.8% of
fees than other activities, may not succeed in cities the population aged 16 years ond older in the civilian
with a low-income population. labor force, including 59.0% female participation.
The City has a strong income profile, however,
Income and Poverty South United it should be noted that the eastern portions of the City
Florida
Characteristics Miami States
contain neighborhoods with low-income residents,
Median household income $54,476 $46,956 $53,046 while other areas have higher-than-average income
levels. These factors should be considered in the
Per capita income $31,873 $26,236 $28,155
recommendations.
Persons in poverty 14.2% 16.5% 14.8%
BUSINESS
Persons in civilian labor
68.3% 59.7% 63.8%
force, age 16+
The number of businesses, and their financial
Females in civilian labor stability, are an indicator of the overall economic well-
64.6% 55.6% 59.0%
force, age 16+
being of a City.
Table 2.3 City income and poverty comparison to Florida
According to the “2007 Economic Census
and the U.S.
Survey of Business Owners” by the U.S. Census Bureau,
Chapter 2: Community Profile 15there were 2,325 businesses in South Miami, and of than in Florida, which has 2.61 persons per household,
those businesses, 1,018 (44%) were minority-owned. City and the U.S., which has 2.63 persons per household.
records indicate that currently there are approximately The survey also indicated that 86.6% of people lived in
3,300 businesses within the City. The “2007 Economic the same home for at least a year, which is higher than
Census” also indicated total retail sales in South Miami the rate for both Florida (83.7%), and the U.S. (84.9%).
to be $187,501,000 with a retail sales per capita rate of According to City data, there are approximately 3,730
$17,133 per person, which is higher than the state retail households currently within the City.
sales per capita rate of $14,353, and the U.S. retail sales
Although the number of households vary
per capita rate of $12,990.
between City records and the American Community
The City has an overall strong business Survey, the City records are more accurate. The
community, with many of those businesses being American Community Survey data is based off
minority-owned. This indicates that the business estimated households from the 2010 Decennial Census
community of the City is diverse, intelligent, and rather than an actual count of households.
robust.
The survey also found that owner-occupied
housing units accounted for a total of 59.9% of the
Housing market. The City’s rate is less than the rate for Florida,
67.1%, and that for the U.S., 64.9%. The lower than
Housing characteristics are telling of whether average rate of owner-occupied housing suggests that
a population has more families or single-occupancy, South Miami has a higher amount of rental units. This
renters or homeowners, and permanent or temporary finding may be due to the proximity to the University
residents. of Miami, which increases the amount of college-aged
population in the area, most of whom are renters.
The “2009-2013 American Community Survey”
found that there were 4,055 households with an Based on findings from the American
average of 2.90 persons per household in South Miami. Community Survey, the median home value in 2013
The persons per household ratio is higher in South Miami was $344,400. The Florida Department of Revenue
Sales Data Files, derived from Miami-Dade County
Property Appraiser information, found that the median
sales price for single family homes and condominiums
within the City fell from a high of $580,000 in 2007 to a
low of $325,000 in 2009, and has rebounded to $450,000
as of 2014.
Figure 2.5 Neighborhoods in the City are primarily single
family homes, but have a lower rate of owner-occupied
housing than the state and nation.
16 Chapter 2: Community ProfileEducation and recreation elements are desired, but not readily
available.
According to the “2009-2013 American
The City’s estimated 2025 population of 17,084
Community Survey” by the U. S. Census Bureau, the
persons can leverage better, more substantial facilities
percent of persons age 25 and older with at least a
than the current population of 13,932 persons. Critical
high school diploma was estimated to be 88.7%. South
thresholds will be met which can further justify the need
Miami has a comparable rate of persons with a high
for additional facilities, services, and improvements. For
school degree or higher than Florida’s percentage rate
instance, tennis facilities are highly desired by residents
(86.1%) and the nation’s rate (86.0%).
of the City, so although the existing facilities exceed the
The survey also found that the percent of recommended quantity of courts per its population,
the population in the City with a Bachelor’s degree, the unique desires of the residents justify the addition
or higher, was 44% with 18.9% holding a graduate of tennis courts based on their demand and desire to
or professional degree. The City has a higher rate make tennis a prominent feature in the parks system.
of higher education degree attainment than both
Florida and the U.S. Of the state’s population, 26.4%
have a bachelor’s degree or higher, and 9.5% have
a graduate or professional degree. In the U.S., 28.8%
have a bachelor’s degree or higher, and 10.8% have a
graduate degree or professional degree.
Parks and Recreation Planning
Implications
A growth in the overall numbers of residents
by 23% in the ten-year planning period will require
development of a corresponding increase in
recreational resources available to residents above an
established baseline of recommended facilities. The
data in this study shows that the current population is
already under-served by facilities, meaning that the
City must not only enhance their existing recreation
resources, but build upon them in order to meet
current and future recreation needs for its residents.
For this reason, the recommendations in this plan were
largely driven by which facilities are already successful,
which ones need improvement, and what parks
Chapter 2: Community Profile 17City Characteristics
Metropolitan Region 2. UNIVERSITY OF MIAMI
The City of South Miami is influenced significantly
South Miami was incorporated in 1927 following
by its close proximity to the University of Miami. The
South Florida’s first major population boom from 1920-
University is a private institution enrolling over 16,000
1925. The City is one of Miami-Dade County’s oldest
students, and employing over 2,500 full-time faculty
municipalities. It is located approximately 3 miles
members. Located less than a quarter mile to the
south of the City of Miami and borders the University of
east of the City, the University of Miami impacts the
Miami’s main campus, and the cities of Coral Gables
economic, demogrpahic, cultural, and educational
and Pinecrest. U.S. Highway 1 (South Dixie Highway)
characteristics of the City. Consideration of these
bisects the City, and contains the largest concentration
influences has been given in preparation of this
of retail, commercial, and office uses within the City,
plan.
carrying approximately 100,000 vehicles on a daily
basis.
3. SCHOOLS WITH OPEN SPACE RESOURCES:
Size and Density
Listed in Table 2.4, are schools with open space
The City of South Miami is comprised of a resources that have been deemed to have a
series of fragmented areas totaling 2.27 square miles potential for utilization by the City based on minimal
within Miami-Dade County. The multi-ethnic resident physical restrictions such as possible access points,
population, as projected by BEBR for 2015, totals 13,932, adjacency to parks; and other contextual factors.
yielding an average density of 6,137 persons per square
mile, which is higher than the densities for both the City 4. WATER-BASED RECREATION:
of Coral Gables (3,965 persons / sq. mi.) and the Village
The City of South Miami currently has 13 public
of Pinecrest (2,588 persons / sq. mi.).
parks, and one facility. Three of these parks have
a water feature that is currently not utilized for
Significant City Elements recreation, but offers recreation alternatives to
South Miami. These water resources present an
1. COMMERCIAL AREAS: opportunity for water-based recreational activities
such as canoeing and kayaking, paddleboarding,
The major commercial area in the City is
and fishing.
located along U.S. 1. The area serves as the “town
center,” and is a vibrant shopping, dining and
entertainment locale serving the City as well as
the University of Miami students, faculty, staff, and
visitors.
18 Chapter 2: Community ProfileSchools with Potential Park Space within the City of South Miami
Potential
Name Address Type Existing Facilities
Park Space
J.R.E. Lee Administration 6521 SW 62nd Ave.
Middle / High ● 3 Basketball Courts 0.27
Office South Miami, FL, 33143
South Miami Middle 6750 SW 60th St.
Middle School ● 3 Basketball Courts 0.40
School Miami, FL, 33143
University Christian 6750 Sunset Dr.
Pre-Kindergarten ● Open Space 0.50
Children’s Center South Miami, FL, 33143
Ludlam Elementary 6639 SW 74th St. ● 2 Basketball Courts
Elementary 1.90
School Miami, FL, 33143 ● 1 Multi-use field
Happi-Tymes Preschool 6767 SW 72nd Street
Elementary / Middle ● Open Space 1.00
South Miami Christian Miami, FL, 33143
● 3 Basketball Courts
6800 SW 60th St.
South Miami K-8 Center Elementary / Middle ● 1 Baseball/Softball Field 1.20
Miami, FL, 33143
● 1 Multi-use field
Total Potential Park Space from Schools 5.27
Table 2.4 Schools with Potential Park Space within the City of South Miami
Chapter 2: Community Profile 19CHAPTER 3: EXISTING PARKS, FACILITIES, AND PROGRAMS Figure 3.1 Palmer Park 20 Chapter 3: Existing Parks, Facilities, and Programs
Existing Parks and Facilities                                POCKET PARKS

                                                                      The parks and facilities include a wide variety
        South Miami contains 14 recreation facilities
                                                             of sizes, including pocket parks (less than an acre)
throughout the City, totaling approximately 48 acres
                                                             that are tucked into small properties in residential and
of park land. The sites include 13 parks, and a 6,187 SF
                                                             commercial areas alike, such as Dison Park, which is
County-owned senior center with programs operated
                                                             situated between homes, and the Dog Park, which
by the City. Table 3.1 indicates the acreage of existing
                                                             is in a small lot next to an animal care center. These
parks and facilities. Site Analyses are also available in
                                                             parks can typically accomodate only uses that do not
Appendix C.
                                                             occupy much room, such as a small playground, small

                                                             structures, and limited furnishings.

      Existing Park Land Acreage                                      Several sites currently maintained by the City’s

Parks                                          Acres         Public Works Department have been identified for
                       Pocket Parks                          potential designation as Pocket Parks. These sites are
Dog Park                                              0.13
                                                             as follows:
Dison Park                                            0.59
Jean Willis Park                                      0.63       1.   SW 63rd Ave. & SW 50th St. - open area
Total pocket park acres                               1.35
                                                                      between single family homes
                        Small Parks
Van Smith Park                                        1.14       2.   SW 57th Ct. between 78th St. and 80th St. - east
Brewer Park                                           1.29
                                                                      side of Right of Way open area with existing
All America Park                                      1.40
                                                                      park bench and landscaping
Total small park acres                                3.83
                   Neighborhood Parks
                                                                 3.   Twin Lakes Dr. & SW 57th St. - cul-de-sac open
Murray Park2                                          4.08
                                                                      area
Marshall Williamson Park                              3.22
Girl Scout Little House Reserve3                      4.06
                                                                 4.   SW 62nd Ct. & 42nd Terr. - triangular open area
Fuchs Park                                            5.00
                                                                      within Right of Way
Dante Fascell Park                                    7.73
Total neighborhood park acres                        24.09
                                                                 5.   SW 60th Ave. between SW 84th St. and 85th St.
                     Community Parks
                                                                      - open area between single family homes (not
Palmer Park                                           8.57
South Miami Park                                     10.00            maintained by Public Works)

Total community park acres                           18.57
                   Total Park Land Acres                     SMALL PARKS
Total current park land acres                        47.84
Table 3.1 Existing Park Land Acreage                                  Parks that are 1-2 acres are slightly larger
Notes:                                                       parks that can serve a larger area of the City, and can
1. Acreages are derived from calculations by the Miami-
    Dade County Property Appraiser and City of South         accomodate more programmed uses than pocket
    Miami
2. Includes Murray Park Aquatic Center and Gibson-           parks. These parks are categorized as small parks.
    Bethel Community Center                                  One such park is Brewer Park which is 1.29 acres, and
3. This property is subject to a lease agreement with Girl
    Scouts of America effective until 2053.                  contains two tennis courts, a half basketball court, two

                                                        Chapter 3: Existing Parks, Facilities, and Programs              21
racquetball courts, a playground, and a gazebo. Some
of the similarly-sized parks in the City, however, vary
widely in character. For instance, All America Park is a
passive park cherished for its natural features.
NEIGHBORHOOD PARKS
Neighborhood parks (3-8 acres) in the City are
multifaceted, and reflective of their neighborhoods.
Although some of these parks contain active uses,
such as in Murray Park and Dante Fascell Park, both
predominantly surrounded by residences, some of
these parks provide a more relaxed setting for their
context. Fuchs Park, for instance, is a somewhat passive
park which includes a large pond with an open area
for strolling. This park is located adjacent to US-1, so the
contrast in levels of activity from a busy transportation
corridor to a passive park, makes Fuchs Park a welcome
variation from the usual of this neighborhood.
COMMUNITY PARKS
Community parks, which are greater than
8 acres in size, are the largest parks in the City. These
parks have the ability to acoomodate larger uses, and
multiple fields and courts, ideal for tournaments and
league sports. Only two parks of this size exist in the
City: Palmer Park and South Miami Park. Palmer Park
is heavily-used for league sports by the City’s residents.
South Miami Park is also heavily-used for league sports,
however, due to its location in an enclave of the City
surrounded by mostly County jurisdiction, most of its
users are non-residents.
22 Chapter 3: Existing Parks, Facilities, and ProgramsExisting Parks and Facilities
Figure 3.2 Existing Parks and Facilities
Chapter 3: Existing Parks, Facilities, and Programs 23South Miami Parks and Recreation Facilities at-a-glance
Park / Facility Address Acres Amenities
All America Park 6820 SW 64th Avenue 1.40 ● Picnic area
South Miami, FL 33143
Brewer Park 6300 SW 56th Street 1.29 ● Outdoor basketball (1/2 ● Picnic area ● Water fountain
South Miami, FL 33143 court) ● Tot lot ● Parking
● Handball courts (2) ● Tennis courts (2)
● Gazebo ● Observation deck
Dante Fascell 8600 SW 57th Avenue 7.73 ● Outdoor basketball (1/2 ● Picnic areas ● Walking/Jogging
South Miami, FL 33143 court) ● Sand volleyball Trail
● Playground & tot lot court ● Restrooms
● Handball courts (2) ● Tennis clay courts ● Water Fountain
● Pavilions (2) (6) ● Parking
Dison Park 8021 SW 58th Avenue 0.59 ● Gazebo
South Miami, FL 33143 ● Picnic area
Dog Park 6380 SW 78th Street 0.13 ● Dog play structures ● Water fountain
South Miami, FL 33143 ● Chickee hut & benches
Fuchs Park 6445 SW 81st Street 5.00 ● Pavilion ● Sand volleyball ● Pond
South Miami, FL 33143 ● Picnic areas court
● Playground ● Water fountain
● Restrooms ● Parking
Girl Scout Little 6609 SW 60th Street 4.06 ● Historic building
House Reserve* South Miami, FL 33143 ● Nature-based recreation
Jean Willis Park 7220 SW 61st Court 0.63 ● Gazebo
South Miami, FL 33143 ● Picnic areas
Marshall William- 6125 SW 68th Street 3.22 ● Gazebo ● Picnic area
son Park South Miami, FL 33143 ● Playground & tot lot ● Restroom
● Tennis courts (2) ● Water fountain
Murray Park 5800 SW 66th Street 4.08 ● Athletic playing field ● Restrooms ● Water fountain
South Miami, FL 33143 ● Picnic area ● Youth t-ball field ● Children’s Clinic
● Playground ● Basketball courts (2)
Gibson-Bethel ● Art classes ● Exercise classes ● Parking
Community Center ● Indoor basketball ● Computer lab ● Restrooms
● Indoor volleyball ● Internet ● Classroom
● Fitness and cardio room ● Multipurpose room
Murray Park Aquatic ● Splash pad ● Restrooms ● Parking
Center ● Swimming pool ● Water fountain
Palmer Park 6100 SW 67th Avenue 8.57 ● Athletic playing fields ● Tot lot ● Picnic areas
South Miami, FL 33143 ● Batting cages (2) ● Baseball fields (5) ● Restroom
● Concession stand ● Parking
South Miami 4300 SW 58th Avenue 10.00 ● Athletic playing fields ● Picnic area
Park South Miami, FL 33143 ● Portable restroom facilities
South Miami 6701 SW 62nd Avenue N/A ● 6,187 SF of amenities ● Senior programs ● Computer lab
Senior Center South Miami, FL 33143 ● 97 units ● Dining room ● Fitness room
Van Smith Park 7800 SW 59th Avenue 1.14 ● Walking trails
South Miami, FL 33143 ● Picnic area
Table 3.2 South Miami Parks and Recreation Facilities at-a-glance
* This property is leased to the Girl Scouts of America
24 Chapter 3: Existing Parks, Facilities, and ProgramsProposed Multi-use Trails could add 3 acres of park land, and improve access to
parks (more parks within a 5-minute walking distance)
In addition to its existing parks and indoor along the west side of the City. Based on its location,
recreation facilities, the City has great opportunities with the Ludlam Trail will provide a multi-use trail to serve
three multi-use trails that are currently in development residents and connect different areas of metropolitan
as green corridors traversing the region, and running Miami than the Underline will.
through or adjacent to the City. As plans for these
trails progress, the City could play a key role in their SNAPPER CREEK TRAIL
development. The three trails are discussed in this
Snapper Creek Trail is a proposed 10-mile
section.
multi-use trail in west-central Miami-Dade County
that generally follows the route of the Snapper Creek
THE UNDERLINE
Canal. The trail would provide a travel route between
Currently known as the M-Path, the Underline the Florida International University Modesto Maidique
is an existing 10-mile linear park-like space and multi- campus on Tamiami Trail and Old Cutler Trail. Segment
use trail which has been approved for a major redesign B of the Snapper Creek Trail will run along residential
as an iconic urban multi-use trail. The Underline runs streets within South Miami with a small portion of the
underneath the Metrorail line from Downtown Miami trail running in the area immediately south of Dante
just north of the Brickell Station to the Dadeland South Fascell Park1 2.
Station. Within the City, the Underline site encompasses
Within the City, the site of the proposed
over 11 acres that run parallel to US-1 / South Dixie
Snapper Creek Trail along Dante Fascell Park totals 1.28
Highway.
acres of park land. With waterfront views to offer, the
This project is set to be an iconic green corridor future Snapper Creek Trail site along Dante Fascell Park
connecting many significant areas of the region. is currently used informally by residents as a walking
To assist in the realization of this project, the City of route. As the trail develops, Dante Fascell may be
South Miami has contributed $25,000 to date towards identified as a major destination along the trail.
development of the Underline. Users from other areas
would be brought into the City via the Underline, so this
trail is not only an opportunity for residents of the City to
engage in trail recreation, it is also a way to bring visitors
into the City with a different perspective.
Notes:
1. Miami-Dade Metropolitan Planning Organization
(October, 2008). Snapper Creek Trail: Segment A Planning
LUDLAM TRAIL Study. Miami-Dade County. Retrieved from http://
miamidadempo.org/library/studies/snapper-creek-trail-
The Ludlam Trail (3 acres adjacent to the segment-a-planning-study-final-2008-10.pdf/
2. Miami-Dade Metropolitan Planning Organization (June,
City) is a proposed 6-mile multi-use trail within a former 2016). Snapper Creek Trail Segment “B” Master Plan.
Miami-Dade County. Retrieved from http://miamidadempo.
FEC railroad corridor located adjacent to the City.
org/library/studies/snapper-creek-trail-segment-b-
If incorporated into the City’s parks system, the trail master-plan-final-report-2016-06.pdf/
Chapter 3: Existing Parks, Facilities, and Programs 25Existing Parks and Facilities with Proposed Trails
Figure 3.3 Existing Parks and Facilities with Proposed Trails
26 Chapter 3: Existing Parks, Facilities, and ProgramsExisting Recreational South Miami Recreation Programs
Programs Recreation Programs Registrations
Privately-run Programs
Recreation programs provide excellent ben- Jazzercise 40
efits to residents. Participation in sports programs or rec- Boot camp 50
reational classes can help improve overall physical and
Youth basketball 480
Youth baseball 400
mental health by offering a fun method of engaging in
Youth soccer 250
physical activity, while providing an environment that
Youth travel soccer 175
teaches sportsmanship, collaboration, and healthy
Youth flag football 150
competition. The diversity of programs offered can also
Adult softball 100
help in attracting a variety of users of different ages. Adult soccer 150
City-run Programs
Existing recreational programs within the City
Youth tackle football 200
include a variety of City-operated and privately-op-
Cheerleading 65
erated programs. Privately-operated recreational pro-
Classical ballet 25
grams help offset resident demand for recreational After school tennis 150
program services while limiting the operational costs to Youth tennis camp 245
the City. Adult tennis clinic 75
Tennis tournaments 750
Amongst the 19 athletics programs available
After school program 100
within the City, as of August 2017, there were 2,290 Winter camp 100
registrants in youth athletic programs and 1,180 regis- Spring camp 100
trants in adult athletics programs. The City also provides Summer camp 125
7 non-athletic programs: afterschool care, three sea- One day camp 300
sonal camps, one-day camps, the wonder workshops, Track and field (PAL) 40
Senior program 65
and the senior program. Non-athletic programs com-
Swim lessons 135
prise 965 registrants.
Water aerobics 15
Wonder workshops 150
Combined Total
Total Program Participants 4,435
Table 3.3 South Miami Recreation Program
Chapter 3: Existing Parks, Facilities, and Programs 27CHAPTER 4: PUBLIC INVOLVEMENT Figure 4.1 Murray Park Aquatic Center 28 Chapter 4: Public Involvement
City-provided Input (2014-2015)
        Miller Legg conducted interviews with the           increase awareness of parks and recreation facilities

City’s Mayor, Vice Mayor, Commissioners, and Parks          and services.

and Recreation Advisory Board to determine what the

City felt are its most significant goals and objectives.    INADEQUATE         BUDGET        FOR    PARKS      AND
The following is a summary of reoccurring comments          RECREATION NEEDS
from those interviews.                                              City representatives felt that the parks and

                                                            recreation budget is only adequate for continuing with

THE CITY’S PARKS NEED IMPROVEMENT                           the current maintenance and enhancement standards

        Most City representatives felt that the parks       of the facilities/programs, which they feel are in need

needed improved maintenance and renovations,                of improvement. In order for the City’s parks system to

are underutilized by residents, and not consistently        improve its existing features, and grow in the future,

maintained. More specifically, large park features          Parks and Recreation would need additional funding.

are maintained best (e.g. major sports field, major

sports courts, pool), while smaller features receive less   PARKS AND RECREATION SHOULD CONNECT
attention from maintenance personnel (e.g. Dison Park,      WITH SCHOOLS
Dante Fascell Pro Shop).                                            The City currently holds a use agreement with

                                                            Miami-Dade Schools for the use of Palmer Park. The

MAINTENANCE HAS BEEN INADEQUATE                             City would like to establish use agreements with schools

        Interviewees felt that the City’s maintenance       throughout the City that have open space resources

of its parks and recreation facilities is inadequate due    that could be offered to the public during the schools’

to lack of proper funding, and turnover of well-trained     off-hours.

staff. Interviewees felt that the City’s wages are not

competitive enough to retain staff that has been            WATERWAYS ARE AN OPPORTUNITY FOR
properly trained in maintenance standards, or attract       PARKS AND RECREATION
more experienced personnel.                                         Interviewees agreed that the waterways within

                                                            the City are an asset that should be utilized for parks

RESIDENTS LACK AWARENESS OF CITY PARKS                      and recreation uses, such as canoeing, kayaking,

AND PROGRAMS                                                fishing, and similar activities. Some suggested that

        Interviewees agreed that residents don’t know       boat launches, piers, and other facilities could be

about the City’s parks, facilities, and programs offered.   provided at the waterfront parks to enable these

A few interviewees recommended advertising these            activities within the City. Enhancing the connectivity of

facilities and services through mailings, brochures, and    these waterways could help improve the overall water

calendars featuring a schedule of events.                   recreation experience as well.

        By the time these interviews occurred, staff

had begun communication efforts with residents to

                                                                              Chapter 4: Public Involvement             29
SOUTH MIAMI PARK NEEDS MAJOR for other uses, reduce liability, cut costs to the City, and
IMPROVEMENT limit staffing needs.
South Miami Park was described by City
representatives as a significantly neglected park in need NON-RESIDENT PARTICIPATION IN SOCCER
of a major renovation, or decommissioning. Some felt PROGRAMS
that the park is neglected, because the park’s location A few interviewees felt the soccer programs
on the northern fringes of the City isolate its resources should be evaluated for their viability. Most of the soccer
from the majority of City residents, servicing very few in the City takes place at South Miami Park, which is
properties that are within the City limits. Despite the surrounded almost entirely by properties outside the
park being operated by the City, most of the park’s City limits. The users serviced by the program, therefore,
users are non-residents. The financial feasibility of the are usually non-residents. The City desires to utilize
City’s continued operation of this park is questionable these resources in a way that would better serve the
in its current condition and context. residents.
PARKS ARE IMPORTANT TO THOSE SUPPORT FOR THE UNDERLINE PROJECT
CONSIDERING BECOMING A RESIDENT OF The majority of interviewees support the
SOUTH MIAMI Underline project, and feel the Underline should be
Most City representatives feel that parks are considered in the City’s Parks and Recreation Master
a significant influence on potential residents’ decision Plan. The project will expand a major green corridor
to move to South Miami, and especially so for young and public open space running through the heart of
families who have children at-home that would benefit the City.
greatly from a strong parks and recreation system within
their city. ON-GOING SUPPORT FOR PARKS AND
RECREATION DEPARTMENT AND ITS
THE CITY NEEDS MORE BASKETBALL COURTS LEADERSHIP
Currently there is a strong demand for City representatives felt that the new Parks and
more basketball courts throughout the City. City Recreation leadership is a great asset to the City. They
representatives expressed interest in introducing more appreciate their leadership and vision for Parks and
basketball courts at parks, and specifically at Marshall Recreation in the City, and feel they are leading the
Williamson Park where the tennis courts are under- department in a good direction.
utilized, and have therefore been identified as an
opportunity to renovate them as basketball courts to
meet demand.
PRIVATIZE ORGANIZED SPORTS PROGRAMS
Some City representatives encouraged
privatizing the City-run recreational leagues, so as to
free up those parks and recreation staffing resources
30 Chapter 4: Public InvolvementOnline Public Survey &
Public Workshop 1 and 2
In determining the Goals and Objectives of between September and November 2016. The survey
South Miami residents for its Parks and Recreation had a total of 214 respondents, which comprised only
Master Plan, Miller Legg conducted an online public 1.8% of the residents. The survey is considered statistically
survey and two public workshops in collaboration with insignificant. Nonetheless, the responses have still been
the City. The survey was publicized on the City website, considered in this study.
and with flyers at various local gathering places. Initially, The two public workshops gathered
the survey attracted 146 respondents over the course approximately a hundred participants. The following is
of 2.5 months between May and July of 2015. In order a summary of recurring comments from the survey and
to increase responses, the City reopened the survey public workshops.
after Public Workshop 2 for an additional 1.5 months
Survey Responses
PARKS THAT THE MOST RESPONDENTS VISITED PROGRAMS THAT THE MOST RESPONDENTS
IN THE LAST YEAR PARTICIPATED IN LAST YEAR
Figure 4.2 Online Public survey results Figure 4.3 Online Public survey results
PARKS LEAST VISITED BY RESPONDENTS IN THE TYPES OF EVENTS RESPONDENTS DESIRE AT
LAST YEAR CITY PARKS
Figure 4.4 Online Public survey results Figure 4.5 Online Public survey results
Chapter 4: Public Involvement 31FACILITIES/ACTIVITIES CURRENTLY PARTICIPATED IN MOST BY RESPONDENTS
Figure 4.6 Online Public survey results
FACILITIES/ACTIVITIES MOST DESIRED BY RESPONDENTS
Figure 4.7 Online Public survey results
The majority of survey respondents were ages Not surprisingly then, according to the survey
30 to 45 (45%), with the second largest age group being results, most respondents are not aware of the condition
ages 46 to 55 (23%). Respondents reported that their of the City’s parks, except for Dante Fascell and Fuchs
household included mostly adults between the ages of Park, which were both mostly rated as being in “good”
30 to 45 (51%), and children age 13 or younger (48%). condition.
The next largest age group of respondents’ household Overwhelmingly, an average of 10% of
members were ages 46 to 55 (29%). These results respondents reported participating in any of the City’s
indicate that the majority of respondents are middle- programs. Subsequently, most respondents reported
aged individuals, and many likely have young families. that they are not sure of the quality of the City’s
According to the survey responses, most parks programs.
have typically never been visited by respondents,
except for Dante Fascell, which is typically visited several
times a week by respondents who visit the park.
32 Chapter 4: Public Involvement• Facilities/items that survey respondents and workshop
Public Workshop 1 – Visual
attendees felt need “major improvements”:
Preference
• bathrooms
Public Workshop 1 was held in June of 2015.
• safety/security
Preference for types of parks and activities at parks
• concessions
can vary widely from person-to-person, and even
• lighting
from region-to-region. In addition to receiving verbal
• amount of shade trees
and site-specific input from workshop participants, we
• exercise equipment
also conducted a visual preference activity at Public
Workshop 1 to better define the preferences of the
• Facilities/items that survey respondents and workshop City’s residents. We provided several images reflective
attendees felt need “moderate improvements”: of characteristic types of parks and activities ranging
from images of passive parks with picnicking to sports
• picnic areas
complexes to farmers markets and festivals.
• shelters/pavilions
• cleanliness Based on visual preference, workshop
• parking participants preferred images characteristic of picnic
• playgrounds areas with pavilions; paved, multi-use paths; and
• furniture farmers’ markets. This preference is well-aligned with
• sidewalks and paths survey responses indicating a preference for leisurely
• general maintenance walking, picnic areas and shelters, and park events.
• natural areas
A second public workshop was held in mid-
• landscape areas
2016 to present a draft of the Parks and Recreation
Master Plan to residents, and provide an opportunity
• Facilities/items that survey respondents and workshop for additional public input.
attendees felt are “fine as-is”:
• sports fields
• tennis courts
• basketball courts
• other buildings
• signage
Chapter 4: Public Involvement 33CHAPTER 5: DEMAND ANALYSIS Figure 5.1 Brewer Park 34 Chapter 5: Demand Analysis
Park Land Area Ratio                                          have been analyzed to determine park land level-of-

                                                              service needs looking into the future for 2020 and 2025.

        To ensure that the City of South Miami is             Table 5.1, “Required Park Land Acres by Phase (4 acres

providing adequate park land acreage, the City has            per 1,000 persons),” illustrates the acreage requirements

set requirements in the Comprehensive Plan to provide         and surplus or deficit for each phase of this Master Plan

a minimum of 4 acres of park land per 1,000 residents.        based on the current park land level-of-service ratio.

On average, municipalities in Miami-Dade County
                                                                       To comply with the ratio of 4 acres per 1,000
require an open space level-of-service ratio of 3 acres
                                                              persons, the City would need to acquire 20.5 acres
per 1,000 persons. The park land area ratio set by the
                                                              by 2025, which may be difficult given that the City is
City provides more park land acreage per person than
                                                              virtually built-out, and there is a lack of available lands.
most other cities in the County. Currently, the City has
                                                              Nonetheless, there are several options available to the
approximately 13,932 residents, which requires 56 acres
                                                              City that can increase the park land acreage over the
of park land to meet the Comprehensive Plan ratio.
                                                              next ten years, as well as diversify the types of recreation

                                                              available.

Existing vs. Required Park
Land Area
        Currently there are 48 acres of existing parks

and recreation facilities within the City; therefore the

City currently has a deficit of 8-acres needed to meet

the 56-acre park land area requirement.

        As this Master Plan aims to guide the City’s

Department of Parks and Recreation through the next

five (5) and ten (10) year periods, population projections

                             Required Park Land Acres by Phase (4
                                   acres per 1,000 persons)
                                                              (Projected)        Required
                                    Phase                     Population1         Acres
                         Phase One (2016-2017)                   13,932            55.7
                         Phase Two (2018-2020)                   15,511            62.0
                         Phase Three (2020-2025)                 17,084            68.3
                         Table 5.1 Required Park Land Acres by Phase (4 acres per 1,000 persons)
                         Notes:
                         1. Bureau of Economic and Business Research. (2015). Population
                         Projection by Age for 2000-2040. University of Florida. Retrieved from
                         http://flhousingdata.shimberg.ufl.edu/a/population?action=results&
                         nid=4372

                                                                                   Chapter 5: Demand Analysis                35
Potential Park Land Sites Potential Park Acreage
Potential Park Sites Within the City Acres
There are various resources of potential park BLUEWAYS
space within the City which have been identified in Northern Blueway 15.94
Table 5.2, “Potential Park Acreage.” The resources Central Blueway 4.53
listed amount to approximately 46 acres of potential Snapper Creek Blueway 4.65
Total Blueways 25.12
park land. Although all the listed resources have the
TRAILS
potential to be included, some of these resources
Underline Trail 11.17
are more feasible to attain than others. The following
Snapper Creek Trail 1.28
section evaluates the feasibility of the sites for use as Total Trails 12.45
City park land. SCHOOLS
J.R.E. Lee Administration Office 0.27
BLUEWAYS South Miami Middle School 0.40
University Christian Children’s Center 0.50
Blueways are water trails that offer water- Ludlam Elementary 1.90
based recreation opportunities. The City of South Miami Happi-Tymes Preschool South Miami Christian 1.00
contains an extensive system of navigable canals South Miami K-8 Center 1.20
Total Schools 5.27
amounting to approximately 25 acres of blueways.
Total Potential Acreage Within the City 42.84
The many canals throughout the City are currently
Potential Park Sites Adjacent to City Acres
used by residents for water-based activities such as Ludlam Trail 2.99
kayaking, canoeing, paddle-boarding, and fishing, Total Potential Acreage Adjacent to City 2.99
however, there are currently no formal, non-motorized Total Potential Park Sites Acres
boat launches or points of public access to the canals. Total Potential Acreage 45.83
Establishing the canals as park land, would allow the Table 5.2 Potential Park Acreage
Figure 5.2 Canoeing and kayaking on blueways provides a unique form of recreation
36 Chapter 5: Demand AnalysisCity to provide more public access points, and add The City should encourage the development process
new facilities to enhance the canals as blueways for of the Underline as it continues.
recreational use.
Ludlam Trail
The canals are currently within properties
Currently there is a 3-acre portion of the
owned by the County and the South Florida Water
proposed Ludlam Trail site located directly adjacent
Management District, and would require a use
to the City. Designation of Ludlam Trail as City park
agreement or other mechanism of transference
land would require incorporation of some portion of
allowing public access. Since this option would require
the adjacent area of the future trail to qualify. The trail
coordination with a separate agency, the feasibility
seems to be gaining traction for development in the
of attaining these 25 acres for public recreational use
region. The trail’s completion would connect the City
is uncertain. Nonetheless, these 25 acres of blueways
to other regions of the metropolitan via a multi-use trail,
offer a major opportunity to add to and diversify the
and especially encourage the western-most residents to
parks and recreation facilities and activities within the
engage in bicycling, walking, jogging, skating, or other
City; this is an option which should be explored further.
forms of recreation suitable for trails. Despite increasing
support for approval, the feasibility of designating the
trail as park land is difficult to determine due to the
need to incorporate some portion of the trail in order
for the park to qualify.
Snapper Creek Trail
Snapper Creek Trail (1 acre within the City), also
has potential to add park land, but has not yet been
approved for designation. A study of “Segment ‘A’” of
the proposed Snapper Creek Trail was completed in
20081. Segment A runs from the FIU Modesto Maidique
Campus on Tamiami Trail to near Baptist Hospital. In 2016,
Figure 5.3 Multi-use trails bring visitors from other areas
while providing recreation opportunities to residents a study of “Segment ‘B’” was completed2. Segment B
runs from Segment “A” to Dante Fascell Park. Given
PROPOSED MULTIUSE TRAILS
that the South Florida Water Management District owns
The Underline and maintains the canal, there is a good likelihood that
the agency will be open to the corridor’s development
The Underline has already been approved
Notes:
for development, so it is highly advisable for the City 1. Miami-Dade Metropolitan Planning Organization (October,
2008). Snapper Creek Trail: Segment A Planning Study.
to include the 11 acres as part of its overall park land Miami-Dade County. Retrieved from http://miamidadempo.
org/library/studies/snapper-creek-trail-segment-a-planning-
acreage. By doing so, the park land level-of-service study-final-2008-10.pdf/
ratio of 4 acres per 1,000 persons would eliminate the 2. Miami-Dade Metropolitan Planning Organization (June,
2016). Snapper Creek Trail Segment “B” Master Plan. Miami-
current deficit, and provide 3 acres of surplus park land. Dade County. Retrieved from http://miamidadempo.org/
library/studies/snapper-creek-trail-segment-b-master-plan-
final-report-2016-06.pdf/
Chapter 5: Demand Analysis 37You can also read