Gas Statement of Opportunities - For eastern and south-eastern Australia March 2020 - AEMO
←
→
Page content transcription
If your browser does not render page correctly, please read the page content below
Gas
Statement of
Opportunities
March 2020

For eastern and south-eastern Australia

Important notice

PURPOSE
AEMO publishes the Gas Statement of Opportunities under the National Gas Law and Part 15D of the
National Gas Rules.
This publication has been prepared by AEMO using information available at 31 December 2019, although
AEMO has endeavoured to incorporate more recent information where practical.

DISCLAIMER
AEMO has made every reasonable effort to ensure the quality of the information in this publication but
cannot guarantee that information, forecasts and assumptions are accurate, complete or appropriate for your
circumstances. This publication does not include all of the information that an investor, participant or
potential participant might require, and does not amount to a recommendation of any investment.
Anyone proposing to use the information in this publication (which includes information and forecasts from
third parties) should independently verify its accuracy, completeness and suitability for purpose, and obtain
independent and specific advice from appropriate experts.
Accordingly, to the maximum extent permitted by law, AEMO and its officers, employees and consultants
involved in the preparation of this document:
• make no representation or warranty, express or implied, as to the currency, accuracy, reliability or
  completeness of the information in this document; and
• are not liable (whether by reason of negligence or otherwise) for any statements or representations in this
  document, or any omissions from it, or for any use or reliance on the information in it.

VERSION CONTROL

Version        Release date             Changes

1              March 2020               Initial release

© 2020 Australian Energy Market Operator Limited. The material in this publication may be used in
accordance with the copyright permissions on AEMO’s website.
Executive summary

In the 2020 Gas Statement of Opportunities (GSOO), AEMO forecasts demand and uses information from gas
producers about reserves and forecast production to project the supply-demand balance and potential gaps
under a range of plausible scenarios for eastern and south-eastern Australian gas markets to 2039. The 2020
Victorian Gas Planning Report Update1 (VGPR Update), which complements this GSOO, provides a focused
assessment of the supply-demand balance to 2024 in Victoria’s Declared Transmission System (DTS).

     The 2020 GSOO projects that:
     • Supply from existing and committed gas developments will be sufficient to meet forecast gas demand
       across eastern and south-eastern Australia until at least 2023, provided that liquefied natural gas
       (LNG) export spot cargoes are redirected to meet domestic demand, if required.
     • Southern supply from existing and committed gas developments will reduce by more than 35%
       (163 petajoules [PJ]) over the next five years, despite an increase in committed gas developments in
       the past year. Unless additional southern supply sources are developed, LNG import terminals are
       progressed, or pipeline limitations are addressed, gas supply restrictions and curtailment of
       gas-powered generation (GPG) for the National Electricity Market (NEM) may be necessary on peak
       winter days in southern states from 2024.
     • Anticipated gas field projects (considered likely to proceed within the outlook period) are forecast to
       improve resource adequacy until at least 2026 if developed. However, due to the location of most of
       the anticipated projects within Victoria, dynamic operational pipeline constraints would limit their
       effectiveness in addressing the forecast peak winter day supply gaps under certain conditions 2.
     Forecasting uncertainty and year-on-year variability has increased since the 2019 GSOO. Gas supply
     adequacy forecasts are highly uncertain, particularly between 2022 and 2024 when decline in southern
     field production coincides with the staged closure of Liddell Power Station. Uncertainties include:
     • AEMO's Draft 2020 Integrated System Plan (ISP)3 projects that investment in a portfolio of variable
       renewable energy (VRE), storage, and new transmission infrastructure will be the lowest-cost way of
       replacing Liddell’s generation. Any delays in this new investment or a further decline in availability of
       coal-fired generation will significantly increase gas demand through increased reliance on both
       existing and new GPG.
     • Several gas fields are forecast to cease production sometime between mid-2023 and mid-2024. If
       production ceases earlier, this could create peak winter day supply gaps in Victoria in 2023.
     • Global oil and gas demand trends may see LNG demand varying from expectations and indirectly
       impacting prices and availability of domestic supply and LNG imports.
     • Impacts of the COVID-19 coronavirus (not modelled) may lead to decreased levels of global LNG
       demand and domestic gas consumption in the short term.

1
    At https://www.aemo.com.au/energy-systems/gas/gas-forecasting-and-planning/victorian-gas-planning-report.
2
    See the 2020 VGPR Update for more information.
3
    At https://aemo.com.au/energy-systems/major-publications/integrated-system-plan-isp.

© AEMO 2020 | Gas Statement of Opportunities                                                                       3
• The Commonwealth and New South Wales governments have announced a proposed target to inject
an additional 70 PJ of gas per year into the New South Wales market by 2022.
• The Victorian government has lifted the ban on onshore conventional gas exploration and
development from July 2021, although timing of any new supply and the quantities of gas that may
become available are still unclear.
• Industrial users continue to report vulnerabilities due to energy cost pressures. Any significant changes
in industrial activity, whether increases or decreases, will materially impact gas and electricity demand.
Forecast consumption
Figure 1 shows gas consumption forecasts by demand sector for the 2020 GSOO4. It highlights that total
consumption trends continue to be driven by trends in LNG export demand, given its relative volume,
constituting just over 70% of total system demand.
Short-term trends in the total east coast gas consumption forecasts are relatively flat. Total consumption is
projected to be slightly higher than forecast in the 2019 GSOO, mainly due to a slightly higher forecast of
LNG exports and an increase in forecast GPG for 2020, driven by delays in VRE development and
deteriorating availability of ageing coal-fired generators.
Longer-term forecasts also show a flat outlook in total consumption. This is lower than was forecast in the
2019 GSOO from the mid-2020s, primarily due to a lower long-term outlook for GPG, based on projections of
reduced electricity demand, greater interconnection between regions, and a higher (and more technologically
diversified) new VRE build in the NEM.
Figure 1 Gas consumption actual and forecast, 2010-39, all sectors, Central scenario (PJ)
4
Demand forecasts are available on the Forecasting Data Portal http://forecasting.aemo.com.au/. Select ‘GSOO 2020’ from the publication drop-down.
© AEMO 2020 | Gas Statement of Opportunities 4The scenarios studied in the 2020 GSOO, including the role for gas for GPG in the NEM, are consistent with
three scenarios from the Draft ISP for the NEM5 that provide the widest spread of outcomes from a gas
perspective: the Central, Step Change, and Slow Change scenarios.
AEMO’s Draft 2020 ISP was published in December 2019, and considered the needs of all energy users, both
electricity and gas. The GPG scenario forecasts developed for the 2020 GSOO use the generation retirement
and expansion trajectories identified by the Draft 2020 ISP.
Central scenario forecasts – short-term (to 2025)
Short-term trends in east coast gas consumption forecasts in the Central scenario are:
• LNG exports are expected to rise slightly as two of the three LNG facilities reach full nameplate capacity.
This leads to higher forecast consumption than in the 2019 Neutral scenario.
• Industrial consumption is expected to remain relatively flat, as this sector is forecast to continue facing a
challenging economic environment, with limited growth opportunities. AEMO’s interviews with large
industrial facilities indicate greater risk of closure than expansion, with potential demand reductions, due
to high gas prices.
• Residential and commercial sector consumption is projected to be flat, with a similar trajectory to the 2019
GSOO. Increases in energy efficiency schemes, fuel switching away from gas appliances, and changing
consumption patterns continue to put downward pressure on consumption growth, despite a growing
forecast number of gas connections.
• GPG forecasts over the five-year outlook follow a similar declining trend to those in the 2019 GSOO. The
forecasts for the 2020 calendar year are 17 PJ (24%) higher, due to delays in commissioning of new VRE
and accounting for the deteriorating availability of an ageing coal-fired generation fleet. From 2021, GPG
forecasts are slightly lower than those in the 2019 GSOO, as more utility-scale wind and solar and
distributed solar “rooftop” photovoltaic (PV) generation is expected and forecast to be built in the NEM,
compared to the 2019 GSOO.
The outbreak of the COVID-19 coronavirus in early 2020 is likely to lead to decreased levels of global LNG
demand in 2020, and decline in economic activity in Australia for at least the short term6. The potential
impact of this has not been included in these forecasts and could mean a lower short-term demand forecast.
Central scenario forecasts – medium-term to long-term (2025 to 2039)
In the medium to longer term:
• Forecast total gas consumption is lower than in the 2019 GSOO, with less forecast opportunity for a
rebound in GPG usage with lower electricity operational consumption forecasts, increasing
interconnection in the NEM enabling better sharing of renewable resources, and the inclusion of pumped
hydro schemes such as the Snowy 2.0 and Battery of the Nation projects.
– GPG is expected to continue to provide a reliability and security role to complement renewable
generation in the NEM. Gas demand for GPG is forecast to drop in the medium term, as further
electricity transmission means GPG is relied on less as a source of firm supply. As more coal generation
retires in the long term, demand for GPG is forecast to grow back near 2020 levels.
5
At https://aemo.com.au/energy-systems/major-publications/integrated-system-plan-isp/2020-integrated-system-plan-isp.
6
See commentary at https://www.smh.com.au/business/the-economy/covid-19-cormann-says-stimulus-aims-to-put-economy-in-least-bad-position-
20200311-p548xm.html and https://www.abc.net.au/news/2020-03-11/coronavirus-risk-aversion-uncertainty-economy-rba-guy-debelle/12044792. The
potential impacts are highly uncertain. AEMO is currently updating its economic forecasts, and will continue to monitor the situation closely and seek
external advice on this developing issue.
© AEMO 2020 | Gas Statement of Opportunities 5– As increasing amounts of distributed and utility-scale renewable generation are installed in the NEM,
year-on-year variations in GPG demand are becoming more dependent on weather patterns.
• LNG consumption is forecast to stabilise in the longer term, at levels sufficient to meet existing contractual
obligations.
• Residential and commercial consumption growth is projected to be relatively flat, from 191 PJ in 2020 to
205 PJ in 2039. Similar to the short-term trends, the effect of continuing and new energy efficiency
schemes, fuel switching away from gas appliances, and assumed sustained high gas prices7 are forecast to
offset growth in domestic usage of gas from new gas connections.
Differences in Slow Change and Step Change scenario forecasts
Projected consumption in other modelled plausible futures is compared to the Central scenario in Figure 2.
In the industrial sector, the relatively weak economic conditions of the Slow Change scenario are forecast to
lead to gas demand declining from current levels, particularly after expiry of existing long-term contracts, with
nearly a 90 PJ (or 30% of Tariff D volume) difference to the Central scenario forecast by 2040.
The Step Change scenario forecast is only slightly higher than the Central scenario, predominantly from LNG
exports. The Step Change scenario highlights again that a significantly higher gas demand trajectory than the
Central scenario is not necessary under a stronger decarbonisation scenario that models more energy
efficiency measures and fuel-switching opportunities. Insights from large industrial users of gas indicate that
this sector is unlikely to increase consumption much beyond current levels under any of the scenarios.
For LNG annual consumption, the Step Change scenario is higher, reflecting feedback from the sector on
what more favourable international dynamics will mean for exports, whereas in the Slow Change scenario,
feedback indicates that a fall in contract quantity can result in a decline in demand as the sector re-evaluates
how remaining contract obligations will be met.
Figure 2 Gas consumption actual and forecast, 2010-39, all sectors, all scenarios, compared to
equivalent 2019 GSOO scenarios (PJ)
2,500
Annual Consumption excl. UAFG (PJ)
2,000
1,500
1,000
500
-
2010
2012
2013
2014
2015
2016
2018
2019
2011
2017
2020
2021
2022
2023
2024
2025
2026
2027
2028
2029
2030
2031
2032
2033
2034
2035
2036
2037
2038
2039
GSOO 2020 Central GSOO 2020 Slow Change GSOO 2020 Step Change
GSOO 2019 Neutral GSOO 2019 Slow Change GSOO 2019 Fast Change
Actual
T
The long-term gas price outlooks used for the 2020 GSOO were developed by consultants Core Energy and are not expected to be sensitive to the current
global economic conditions or other short-term shocks. These prices are at https://aemo.com.au/energy-systems/gas/gas-forecasting-and-planning/gas-
statement-of-opportunities-gsoo.
© AEMO 2020 | Gas Statement of Opportunities 6Forecast supply
AEMO has been provided with updated production forecasts and gas reserve and resource information from
gas producers to inform the 2020 GSOO.
Within eastern and south eastern Australia, and those fields in Northern Territory likely to supply eastern
Australia, quantities of proved and probable (2P 8) developed reserves have increased by over 2,000 PJ
compared to those reported in the 2019 GSOO, indicating work has progressed over the last 12 months to
increase certainty in these reserves.
In the northern states, 2P developed reserves have increased (by 1,785 PJ, from 10,452 PJ to 12,237 PJ), while
2P undeveloped reserves have decreased (a drop of 33% or 9,410 PJ) compared to quantities reported in the
2019 GSOO. Contingent (2C9) resources in the north are similar to those reported last year (a drop of 2%).
In the southern states, resource and reserve increases have been identified across all of 2P developed
reserves, 2P undeveloped reserves, and 2C resources (from a total of 13,131 PJ to 16,933 PJ). However, despite
ongoing field development activities increasing the quantities of 2P reserves, these new developments are
insufficient to halt the projected decline of production in aggregate from fields in the southern states.
To access these reserves and resources, appropriate production, process, and transportation facilities need to
be developed. Following stakeholder consultation, the production forecasts provided by gas producers have
been assessed in this 2020 GSOO using three project commitment classifications aligned with the Society of
Petroleum Engineers – Petroleum Resource Management System (PRMS) 10:
• Committed projects – all necessary approvals have been obtained and implementation is ready to
commence or is underway. Committed projects consist of 2P reserves (developed and undeveloped).
• Anticipated projects – developers consider the project to be justified on the basis of a reasonable
forecast of commercial conditions at the time of reporting, and reasonable expectations that all necessary
approvals (such as regulatory approvals) will be obtained and final investment decisions made. Anticipated
projects typically include 2P undeveloped reserves and selected 2C resources.
• Uncertain projects – these projects are more uncertain or at early stages of development. Uncertain
projects include uncertain 2C contingent and prospective resources that are accessible by existing pipeline
and processing infrastructure.
Under this classification, a project represents a specific investment decision, with an associated quantity of
recoverable reserves and resources that may be more, or less, certain. As explained in the PRMS Guidelines,
“a project may, for example, constitute the development of a single reservoir or field, or an incremental
development in a producing field, or the integrated development of a group of several fields and associated
facilities with a common ownership”.
Table 1 shows the production forecast between 2019 and 2024 provided to AEMO by gas producers as their
current best estimate of gas available and expected for production over this time, with comparisons to the
forecasts provided to AEMO for the 2019 GSOO.
These production forecasts are similar to those in the 2019 GSOO, with the largest change in 2022,
amounting to 59 PJ of additional gas (3% increase). Compared to last year, production forecasts in the
southern states have decreased for 2020 and 2021 but are the same in 2022, despite Victorian production
forecasts being higher over this same time period, compared to the 2019 GSOO.
8
Gas reserves and resources are categorised according to the level of technical and commercial uncertainty associated with developing them. Reserves are
quantities of gas which are anticipated to be commercially recovered from known accumulations, and proved and probable (2P) is considered the best
estimate of commercially recoverable reserves.
9
Contingent resources are not yet considered commercially viable, and 2C is considered the best estimate of those sub-commercial resources.
10
See https://www.spe.org/industry/docs/PRMS_Guidelines_Nov2011.pdf.
© AEMO 2020 | Gas Statement of Opportunities 7Existing gas fields are in decline, particularly among southern fields. BHP has announced that the Minerva gas
field has reached its end of life and ceased production on 3 September 2019 11. Several of the Gippsland fields
are projected to reach their end of life between mid-2023 and mid-2024, and all currently producing fields in
the Otway Basin will cease production unless anticipated gas field development or plant modification projects
proceed. The decline in production in southern states between 2022 and 2024, shown in Table 1, is due to
total committed Victorian production reducing from 318 PJ in 2022 to 201 PJ in 2024.
Table 1 Production forecasts to 2024 (PJ) as provided by gas producers
Commitment criteria 2020 2021 2022 2023 2024
VIC / NSW / SAA Existing and committed 437 395 384 323 267
Anticipated 22 69 72 123 106
Total 460 464 456 447 373
Difference from 2019 GSOO -15 -16 0 N/A N/A
QLD / NT Existing and committed 1,566 1,525 1,489 1,371 1,261
Anticipated 5 48 177 252 313
Total 1,572 1,577 1,676 1,636 1,590
Difference from 2019 GSOO +34 -20 +59 N/A N/A
Total east coast gas production 2,031 2,037 2,122 2,069 1,947
Difference from 2019 GSOO +18 -36 +59 N/A N/A
A. The Queensland component of the Cooper Eromanga basin appears in the SA category.
In response to declining production from southern fields, Cooper Energy’s Sole project and the Esso-BHP
West Barracouta project are committed and expected to start production of sales gas between 2020 and
2022. These projects alone are not sufficient to slow the decline in production, but further anticipated projects
in the Otway, Gippsland, and Cooper Eromanga basins are expected to be on track to start production over
the coming years. To maintain levels of production beyond 2024, gas from more uncertain field
developments will need to progress.
Various new projects throughout Queensland are expected to be available to meet demand, subject to
pipeline capacity. These include Senex’s Project Atlas, which started producing in late 2019, and is expected to
ramp up to full production capacity of 15 PJ a year by the end of 2021. Further drilling of Queensland coal
seam gas (CSG) fields is forecast to continue to support the LNG export projects.
Supply-demand balance
If all anticipated projects proceed, supply from existing, committed, and anticipated gas developments is
forecast to be sufficient to meet all eastern and south-eastern Australian demand until 2026 in the Central
and Step change scenarios, and until 2027 in the Slow Change scenario, under most conditions.
However, this assessment does not take into account all of the detailed requirements of operating a system
under peak demand and low supply conditions. Actual operational constraints, particularly within the
Victorian DTS, may lead to transportation limitations throughout the system, creating potential supply gaps
during peak winter days from 2024 (see the 2020 VGPR Update for more information12).
11
BHP, “BHP Operational Review for the quarter ended 30 September 2019”, 17 October 2019, at https://www.bhp.com/-/media/documents/media/reports-
and-presentations/2019/191017_bhpoperationalreviewforthequarterended30september2019.pdf?la=en.
12
At https://www.aemo.com.au/energy-systems/gas/gas-forecasting-and-planning/victorian-gas-planning-report.
© AEMO 2020 | Gas Statement of Opportunities 8This GSOO supply adequacy assessment includes two anticipated infrastructure projects which have been
communicated to AEMO by asset owner and operator APA Group. The first is an increase to the capacity of
the Moomba to Sydney Pipeline of 25 terajoules (TJ) a day. The second is the committed Western Outer Ring
Main (WORM) project that will increase the refilling capacity of Iona Underground Storage (UGS) during
summer months, so more gas is available in storage to be used in winter when required. If either project does
not proceed, and alternative unconstrained supply options are not developed, meeting peak winter day
supply in Victoria would be even more challenging, as discussed in the 2020 VGPR Update.
Figure 3 shows the expected production forecast if existing, committed, and anticipated projects are available
to meet demand in the long term. Development of more uncertain reserves and resources will be required
across eastern and south-eastern Australia to ensure demand is met to the end of the outlook period. There
is a risk that anticipated projects, while having a reasonable expectation of progressing to production, in fact
may not progress. To understand this risk, AEMO undertook GSOO analysis assuming only committed
projects proceed.
Gas production from only existing and committed gas developments is forecast to provide adequate supply
to meet gas demand until between 2023 and 2025 depending on scenario, provided cargoes of export LNG
above contracted levels are diverted to meet domestic demand if needed. Beyond this point, existing and
committed southern field projects are forecast to be insufficient to meet southern demand, and major
southbound pipeline infrastructure upgrades would be required to deliver more gas from northern to
southern states, particularly during winter peak days.
Figure 3 Projected eastern and south-eastern Australia gas production (export LNG and domestic) –
existing projects, and committed and anticipated developments; Central scenario, 2020-39
2,000
1,500
1,000
PJ
500
0
2020
2021
2022
2023
2024
2025
2026
2027
2028
2029
2030
2031
2032
2033
2034
2035
2036
2037
2038
2039
2P developed 2P undeveloped (committed) Anticipated developments Forecast demand
Figure 4 shows an example of a possible evolution of the daily supply-demand balance for the southern
states in 2024 under the Central scenario.
Some supply gaps of between 13 TJ and 374 TJ are observed across winter 2024 as peak day production
within southern states is insufficient to meet forecast daily demand, even with the South West Queensland
Pipeline (SWQP) transporting northern gas at full capacity. Note that this is just one of many different
possible evolutions from an ensemble of evolutions that have been considered in the GSOO. The
Uncertainties in gas supply adequacy section below details the uncertainties that may lead to variations in the
actual daily supply-demand balance observed in 2024, compared to the forecast.
Peak day field production in Victoria and other Victorian and South Australian pipeline infrastructure will limit
the amount of further gas that could contribute to meeting southern domestic demand. The planned WORM
© AEMO 2020 | Gas Statement of Opportunities 9augmentation of the Victorian DTS helps address these shortfalls by increasing the Iona UGS’s refilling
capacity and therefore increasing the system’s peak day supply capacity. This project was originally planned
to be operational by winter 2021, but is currently on hold while an Environmental Effects Statement (EES) is
prepared. The GSOO assumes that the WORM will be operational before winter 2023.
Figure 4 Example evolution of daily supply-demand balance in southern states in 2024 including existing
and committed projects (top) and forecast shortfalls in southern states (bottom), Central
scenario
2,200
2,000
1,800
1,600
TJ per day
1,400
1,200
1,000
800
600
400
200
0
Jan Feb Mar Apr May Jun Jul Aug Sep Oct Nov Dec
Total southern supply Northern production transported via SWQP Southern Storage Southern Demand
400
350
Shortfall (TJ per day)
300
250
200
150
100
50
0
Jan Feb Mar Apr May Jun Jul Aug Sep Oct Nov Dec
“Total southern supply” in Figure 4 includes all gas processed through Moomba processing facility, whether it comes from Moomba
storage or Moomba production. This figure does not include the gas produced to refill Moomba storage.
Uncertainties in gas supply adequacy
Gas supply adequacy across the outlook is highly uncertain, particularly between 2022 and 2024 when
projected tightness in the east-coast gas supply-demand balance coincides with key uncertainties in the
electricity sector that may impact peak day and annual gas supply outlooks.
In the NEM, AGL has informed AEMO that it plans a staged closure of the coal-fired Liddell Power Station
between 2022 and 2023. The Draft 2020 ISP forecast that a mix of existing generation, storage, and new
distributed and utility-scale renewable generation will help maintain reliability at lowest cost after this closure.
The Draft 2020 ISP also recommended greater interconnection between regions, to take advantage of the
geographical diversity inherent in VRE, particularly wind generation, with the regions better able to share low
marginal cost generation efficiently and reduce reliance on more costly local generation including GPG. If any
of the investments in transmission, VRE, or storage (including Snowy 2.0) in the Draft 2020 ISP vary from the
assumed timing (or are not built at all), then demand for GPG could be materially greater than forecast.
Some of the ageing thermal generation fleet is also recording declining availability, and demand for gas for
GPG is highly sensitive to coal-fired generation outages. AEMO estimates that the prolonged unplanned
outage of Loy Yang A2 in 2019, combined with higher demand forecasts from extended hot weather and coal
quality issues at the Mount Piper Power Station, resulted in approximately 60 PJ more GPG gas usage than
© AEMO 2020 | Gas Statement of Opportunities 10would otherwise have been required. Similar outages in future could increase gas demand above levels
forecast in this GSOO, creating potential peak day gas shortages.
There are also key uncertainties in the gas industry, particularly between 2022 and 2024:
• In February 2020, the Commonwealth and New South Wales governments announced that additional gas
supply will be secured for New South Wales consumers, injecting about 70 PJ per annum into the gas
system. No clear indications have yet been given as to what this new supply may be, although the Port
Kembla gas import terminal (up to 100 PJ), the Port of Newcastle gas import terminal (approximately
110 PJ), and Narrabri gas project (approximately 70 PJ) are all mentioned as priority projects in the
Memorandum of Understanding13. This additional 70 PJ has not been included as part of the GSOO’s
committed or anticipated supply, but if it is available by the end of 2022, it may – depending on the
location and daily maximum supply – push domestic supply gaps back by four years.
• The Victorian Government has announced that the ban on conventional gas exploration and development
of Victorian onshore gas fields will be lifted from July 2021. This will allow the east coast gas market access
to further sources of gas supply, but until exploration commences, the size of the resources and timing of
any new supply remain unclear.
• Some existing southern gas fields are likely to cease production sometime between mid-2023 and
mid-2024. Depending on the exact timing of the field depletion – which is very difficult to forecast
accurately, even for field operators – this may put further pressure on meeting peak day gas demand in
southern states from winter 2023.
• AGL has proposed the development of a floating LNG import terminal at Crib Point, near Hastings, and
continues to progress the EES process, with an outcome expected mid-2020. If the project gains required
approvals at this time, AGL projects that the import terminal should be operational by the start of 2022.
• Industrial users report continuing vulnerabilities to high domestic prices. Any significant changes in
industrial activity, whether increases or decreases, will materially impact gas and electricity demand.
• Global demand for LNG is a key driver of the Queensland LNG export forecasts. Any impact to global LNG
prices or the global supply chain may have impacts on the GSOO’s LNG demand forecasts, with flow-on
consequences on the domestic gas market. For example, early industry analysis suggests that the
COVID-19 coronavirus will reduce global LNG demand for at least 2020. Depending on how much
Queensland CSG producers are able to turn down their wells, this may result in excess gas in the eastern
and south-eastern Australian domestic market in the next year.
In the long term, the role hydrogen may play in Australia’s energy future is highly uncertain, but may also be
hugely important for the transport, industrial manufacturing, electricity generation, storage, and export
sectors. AEMO will continue to monitor developments and the likely impact of hydrogen on Australia’s
long-term energy mix. The 2021 GSOO will include a scenario reflecting a possible future where there is
significant penetration of hydrogen into Australia’s energy systems, and provide an assessment of potential
long-term impacts of hydrogen on the gas industry.
GPG, domestic gas demand, and weather variation
With increasing amounts of VRE in the NEM, annual gas demand for GPG is forecast to become increasingly
sensitive to year-on-year variations in weather conditions. As part of AEMO’s commitment to continuous
improvement, this GSOO’s GPG forecasts were developed using the actual weather patterns observed in the
five most recent historical years. These weather conditions impact the amount of rainfall, wind, and solar
observed in each year, as well as temperature, and thus drive variations in demand for gas and electricity, and
the amount of other generation types (particularly GPG) required to flex up or down based on the impact of
these weather variances on VRE.
13
At https://energy.nsw.gov.au/media/2001/download.
© AEMO 2020 | Gas Statement of Opportunities 11Figure 5 shows possible GPG variance based on different weather patterns that might be observed. The 2020 GSOO analysis shows that under the range of GPG forecasts, domestic demand can be met from existing and committed supply until 2024, assuming no other uncertainties drive variations in the forecast. Figure 5 Range of Central scenario GPG forecasts based on weather variation, 2020-24 The daily fluctuations of the 2020 GSOO’s residential, commercial, and industrial demand forecasts were also tied to the same five most recent historical weather years. This means all forecasts for the domestic demand sectors (residential, commercial, industrial, and GPG) are driven by a consistent series of weather patterns, including historically observed coincident demand peaks within and between regions. For example, in the Victorian DTS, on the day of peak system demand (peak residential, commercial, and industrial demand), forecasts for the next five years indicate that GPG demand can vary between 2 TJ a day and 60 TJ a day, depending on the reference weather year modelled. Of the top three peak demand days in the Victorian DTS, GPG can range between 2 TJ a day and 135 TJ a day. Depending on weather conditions, the impact of GPG on supply adequacy on peak demand days can range from trivial to significant. AEMO is continuing to study how changes to the weather and climate may impact gas demand in the future, as all energy sectors become increasingly dependent on weather. © AEMO 2020 | Gas Statement of Opportunities 12
Contents
Executive summary                                                                                3

1.        Introduction                                                                           17
1.1       The Australian Domestic Gas Security Mechanism                                         17
1.2       Scenarios                                                                              18
1.3       Improvements for 2020 GSOO                                                             19
1.4       Supplementary information                                                              20

2.        Consumption forecasts                                                                  21
2.1       Total eastern and south-eastern gas consumption forecasts                              21
2.2       Trends in consumption drivers                                                          22
2.3       Consumption forecasts by sector                                                        23
2.4       Maximum daily demand forecasts                                                         31

3.        Gas supply and infrastructure                                                          34
3.1       The eastern and south-eastern Australian gas system                                    34
3.2       Reserves and resources connected to eastern and south-eastern Australian gas markets   38

4.        Supply-demand balance                                                                  42
4.1       Supply adequacy from existing, committed, and anticipated gas developments             42
4.2       Supply adequacy risks if anticipated field development projects do not proceed         43
4.3       Daily supply adequacy with production only from existing and committed fields          47

5.        Increasing uncertainty                                                                 49
5.1       Tightening linkages between gas and electricity                                        49
5.2       The understanding between the Commonwealth and New South Wales governments             51
5.3       Victorian import terminal                                                              52
5.4       Further southern field production                                                      52

6.        Gas industry evolution                                                                 54
6.1       The potential long-term role of hydrogen in Australia’s energy mix                     54
6.2       Gas market transparency measures                                                       55

A1.       Forecast accuracy                                                                      57

Measures and abbreviations                                                                       67

Glossary                                                                                         69

© AEMO 2020 | Gas Statement of Opportunities                                                     13
Tables
Table 1      Production forecasts to 2024 (PJ) as provided by gas producers                            8
Table 2      Scenario drivers of most relevance to the gas market                                     19
Table 3      Supplementary information                                                                20
Table 4      Estimated impact on forecasts due to changes to residential and commercial drivers
             for the Central scenario                                                                 24
Table 5      Total 1-in-2 and 1-in-20 forecast maximum demand, summer, all sectors excluding
             GPG, including UAFG (TJ a day)                                                           32
Table 6      Total 1-in-2 and 1-in-20 forecast maximum demand, winter, all sectors excluding
             GPG, including UAFG (TJ a day)                                                           33
Table 7      Production forecasts to 2024 (PJ) as provided by gas producers                           41
Table 8      Year ahead historical forecast accuracy, total for eastern and south-eastern Australia   58
Table 9      Year ahead historical forecast accuracy, LNG                                             59
Table 10     Year ahead historical forecast accuracy, residential/commercial                          60
Table 11     Year ahead historical forecast accuracy, industrial                                      60
Table 12     Year ahead historical forecast accuracy, GPG                                             62

Figures
Figure 1     Gas consumption actual and forecast, 2010-39, all sectors, Central scenario (PJ)         4
Figure 2     Gas consumption actual and forecast, 2010-39, all sectors, all scenarios, compared to
             equivalent 2019 GSOO scenarios (PJ)                                                       6
Figure 3     Projected eastern and south-eastern Australia gas production (export LNG and
             domestic) – existing projects, and committed and anticipated developments; Central
             scenario, 2020-39                                                                         9
Figure 4     Example evolution of daily supply-demand balance in southern states in 2024
             including existing and committed projects (top) and forecast shortfalls in southern
             states (bottom), Central scenario                                                        10
Figure 5     Range of Central scenario GPG forecasts based on weather variation, 2020-24              12
Figure 6     Gas consumption actual and forecast, 2014-39, all sectors, Central scenario (PJ)         21
Figure 7     Gas consumption actual and forecast, 2010-39, all sectors, all scenarios, compared to
             equivalent 2019 GSOO scenarios (PJ)                                                      22
Figure 8     Residential/commercial annual consumption actual and forecast, 2014-39, all
             scenarios, and compared to 2019 GSOO                                                     25
Figure 9     Industrial annual consumption actual and forecast, 2014-39, all scenarios, and
             compared to 2019 GSOO                                                                    26

© AEMO 2020 | Gas Statement of Opportunities                                                          14
Figure 10 GPG annual consumption actual and forecast, 2014-39, all scenarios, and compared
to 2019 GSOO 28
Figure 11 Range of Central scenario GPG forecasts based on weather variation, 2020-24 29
Figure 12 LNG annual consumption actual and forecast, 2014-39, all scenarios, and compared
to 2019 GSOO 30
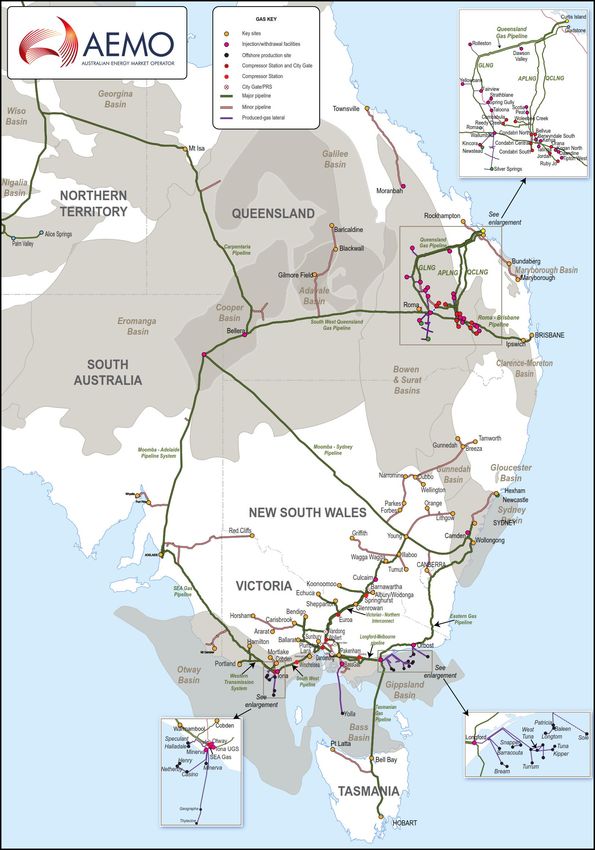
Figure 13 Gas producing basins and infrastructure supplying eastern and south-eastern
Australia 35
Figure 14 Cumulative distribution of flows along the SWQP from 1 January 2016 to 31
December 2019 36
Figure 15 Total flows along the SWQP from 1 January 2016 to 31 December 2019 36
Figure 16 Gas flows towards Mt Isa along the CGP and NGP, 2018 and 2019 37
Figure 17 Historical actual daily supply and demand balance in the southern states, 2019 38
Figure 18 Reserves and resources reported in the 2019 GSOO and 2020 GSOO 39
Figure 19 Change in reserve and resource quantities from northern and southern natural gas
reserves, 2020 GSOO compared to 2019 GSOO 39
Figure 20 Projected eastern and south-eastern Australia gas production (export LNG and
domestic), 2020-39 – existing projects, and committed and anticipated
developments, Central scenario 43
Figure 21 Domestic supply gaps forecast under Central, Step Change, and Slow Change
scenarios, considering existing and committed, and anticipated supply, 2020-29 44
Figure 22 Range of domestic shortfalls forecast under Central, Step Change, and Slow Change
scenarios, considering existing and committed, and anticipated supply, 2023-29 45
Figure 23 Annual demand and field production for southern states (VIC/NSW/SA/TAS); Central
scenario, 2020-24 (production forecasts provided by gas producers) 45
Figure 24 Daily demand and field production limits for southern states (VIC/NSW/SA/TAS);
Central scenario, 2020-24 (daily production limits provided by gas producers) 46
Figure 25 Daily Queensland demand (domestic and export LNG demand); Central scenario,
2020-24 46
Figure 26 Example evolution of daily supply and demand balance in southern states in 2024
including existing and committed projects (top) and forecast shortfalls in the
southern states (bottom); Central scenario 47
Figure 27 Forecast cumulative distribution of flows along the SWQP for years 2022 to 2024;
Central scenario, existing and committed projects 48
Figure 28 Comparison of forecast shortfalls across New South Wales supply options, 2020-29 52
Figure 29 Gas annual consumption forecast comparison, total for eastern and south-eastern
Australia 57
Figure 30 Gas annual consumption forecast comparison, LNG 58
Figure 31 Gas annual consumption forecast comparison, residential/commercial 59
Figure 32 Gas annual consumption forecast comparison, industrial 60
Figure 33 Gas annual consumption forecast comparison, GPG 61
Figure 34 Gas annual consumption forecast comparison for Queensland, GPG 63
© AEMO 2020 | Gas Statement of Opportunities 15Figure 35 Gas annual consumption forecast comparison for New South Wales, GPG 63 Figure 36 Gas annual consumption forecast comparison for Victoria, GPG 64 Figure 37 Gas annual consumption forecast comparison for South Australia, GPG 65 Figure 38 Gas annual consumption forecast comparison for Tasmania, GPG 66 © AEMO 2020 | Gas Statement of Opportunities 16
1. Introduction

The 2020 Gas Statement of Opportunities (GSOO) assesses the adequacy of eastern
and south-eastern Australian gas reserves, resources, and infrastructure to meet forecast
domestic gas demand while delivering expected export quantities to international markets,
over a 20-year outlook period.
The GSOO analyses a range of potential futures that may impact the gas market in the
next 20 years. It is focused on providing an adequacy assessment in the short to medium
term and identifying longer-term development needs.

Information on the demand and supply forecasting inputs, assumptions, and methodologies used for this
GSOO is available on the 2020 GSOO webpage14.
This 2020 GSOO does not take into account the impacts the COVID-19 coronavirus may have on gas supply
or demand in 2020. This situation is rapidly evolving, and at the time of writing the consequences for eastern
and south eastern Australian gas supply adequacy are uncertain.

1.1                The Australian Domestic Gas Security Mechanism
The Australian Domestic Gas Security Mechanism (ADGSM) 15 was established in 2017 by way of Regulations
which empower the Commonwealth Minister for Resources and Northern Australia to impose liquefied
natural gas (LNG) export restrictions in a ‘domestic shortfall year’. The ADGSM Guidelines16 define a domestic
shortfall year as a calendar year “where the Minister has reasonable grounds to believe that there will not be a
sufficient supply of natural gas for Australian consumers during the year unless exports are controlled, and that
exports of LNG would contribute to that lack of supply”.
In deciding whether a domestic shortfall year has occurred, the Minister is informed by expert advice,
including the information provided in AEMO’s GSOO.
In 2019, the Commonwealth Government decided not to apply export controls for the 2020 year following its
considerations under the ADGSM. A review of the ADGSM was performed in 2019 and found that the ADGSM
has been working effectively to safeguard domestic gas supplies. On 24 January 2020, the Minister
announced that the ADGSM will remain in place until its scheduled end in 2023 17.

14
     AEMO’s 2020 GSOO and supporting documents, and previous GSOOs, are at https://www.aemo.com.au/Gas/National-planning-and-forecasting/Gas-
     Statement-of-Opportunities.
15
     See https://www.industry.gov.au/regulations-and-standards/australian-domestic-gas-security-mechanism for information about the ADGSM.
16
     The Customs (Prohibited Exports) (Operation of the Australian Domestic Gas Security Mechanism) Guidelines 2017, at https://www.industry.gov.au/
     regulations-and-standards/australian-domestic-gas-security-mechanism.
17
     Commonwealth Government media release, at https://www.minister.industry.gov.au/ministers/canavan/media-releases/review-finds-gas-policy-boosts-
     domestic-supply-and-helps-lower.

© AEMO 2020 | Gas Statement of Opportunities                                                                                                           17
1.2 Scenarios
The demand and supply inputs for the 2020 GSOO present three alternative futures for gas supply and
demand in eastern and south-eastern Australia. These alternative futures are based on scenarios considering
different rates of change impacting Australia’s energy infrastructure, including Australia’s eastern and
south-eastern gas markets and the National Electricity Market (NEM).
The 2020 GSOO scenarios are a continuation of the themes and drivers considered in AEMO’s Draft 2020
Integrated System Plan (ISP)18, and include a holistic view of the pathway for energy market change as well as
the transformation of the physical infrastructure required in the NEM and, where appropriate, the eastern and
south-eastern gas markets to support this change. The Draft 2020 ISP was published in December 2019, and
considered the needs of all energy users, both electricity and gas.
In the Central scenario, the pace of transition is determined by market forces under current Commonwealth
and state government policies. A policy is current if it is a commitment made in an international agreement,
legislated in Australia, required by regulation, in receipt of material funding from a state or Commonwealth
government budget, or otherwise if the Council of Australian Governments (COAG) has advised AEMO to
incorporate the policy. The Central scenario therefore incorporates:
• The NEM's share of the Commonwealth Government objective of reducing emissions by at least 26%
by 2030.
• Renewable Energy Targets in Victoria (VRET, 50% by 2030) and Queensland (QRET, 50% by 2030).
• The Snowy 2.0 energy storage project, assumed to be operating by March 2025.
• All current Commonwealth or state government policies relating to distributed energy resources (DER)
and energy efficiency.
The Step Change scenario considers stronger growth and aggressive action to address climate risks. In this
scenario, commitment to more rapid decarbonisation is forecast to lead to accelerated exits of existing
thermal generation. Key differences to the Central scenario include:
• Faster technological improvements leading to a greater electrification of the transport sector, energy
digitalisation, and consumer-led innovation.
• Higher population and economic growth.
• More aggressive decarbonisation goals, which particularly affect the role of gas in providing electricity in
the NEM, with greater penetration of renewable generation alternatives but earlier retirements of
coal-fired generators.
• Technology innovation and increased DER uptake.
• Greater uptake of electric vehicles (EVs) and a stronger role for energy management solutions, including
vehicle-to-home opportunities.
• A strong case for fuel switching from gas to electric appliances, particularly due to the opportunities to
decarbonise energy consumption from electrification, and earlier uptake of supportive policies than in the
Central scenario.
• A stronger role for energy efficiency measures in both gas and electricity appliances, and increased
savings due to building code improvements that encourage the installation of better insulation and
glazing, reducing the energy required for space heating.
Apart from the impacts on end-user demand forecasts, the Step Change scenario does not otherwise
consider decarbonisation of the gas sector, but work is ongoing to consider this in more detail in future
GSOO publications.
18
At https://aemo.com.au/energy-systems/major-publications/integrated-system-plan-isp/2020-integrated-system-plan-isp.
© AEMO 2020 | Gas Statement of Opportunities 18The Slow Change scenario is characterised by a slow-down of the energy transition, reflected in slower
changes in technology costs, and low political, commercial, and consumer motivation to make the upfront
investments required for significant emissions reduction. Key differences to the Central scenario include:
• Lower economic growth.
• Lower overall electricity consumption.
• Less DER.
• Lower decarbonisation of the energy sector. With the reduced decarbonisation ambition, there is
increased value in refurbishing ageing coal-fired generators as they approach the end of technical life, but
also less development of renewable generation, resulting in a neutral impact on gas-powered generation
of electricity (GPG).
Table 2 below summarises key energy drivers considered of most relevance to the gas market across the
three scenarios.
Table 2 Scenario drivers of most relevance to the gas market
Driver Slow Change scenario Central scenario Step Change scenario
Economic growth and population Low Moderate High
outlook
Energy efficiency improvement Low Moderate High
Fuel switching – from gas to electric Weak economic case for Average economic case for Strong economic case for
appliances fuel switching fuel switching fuel switching
Gas price Low gas prices Medium gas prices Medium gas prices
Commodity price Low Medium Medium
Foreign Exchange Rate – AUD to Weak Medium Strong
USD
Large-scale renewable generation Low Moderate High
uptake
1.3 Improvements for 2020 GSOO
In a change since the 2019 GSOO, the Australian Capital Territory region was modelled separately from the
New South Wales region. This allowed AEMO to develop richer insights into the key trend drivers for both
regions and identify structural and behavioural changes and model energy policy impacts separately.
Survey information from gas distribution networks has improved the growth rate calculations for the
commercial gas users.
With increasing amounts of variable renewable energy (VRE) in the NEM, annual gas demand for GPG is
forecast to become increasingly sensitive to year-on-year variations in weather conditions. As part of AEMO’s
commitment to continuous improvement, this GSOO’s GPG forecasts were developed using the actual
weather patterns observed in the five most recent historical years 19. These weather conditions impact wind,
solar, rainfall and temperature, and thus drive both demand for gas and electricity and the amount of other
19
A full set of historical data across residential, commercial, and industrial gas demand in all GSOO geographical locations was only available for the most
recent five historical years. This GSOO’s GPG forecasts therefore only considered these same five historical years to maintain consistency across the full
suite of demand forecasts, despite having access to the nine historical weather years of data that was used in the Draft 2020 ISP.
© AEMO 2020 | Gas Statement of Opportunities 19generation types (particularly GPG) required to flex up or down based on the impact of these weather
variances on VRE.
The daily fluctuations of GSOO’s residential, commercial, and industrial demand forecasts were also tied to
the same five most recent historical weather years. This means all forecasts for domestic demand sectors
(residential, commercial, industrial, and GPG) are driven by a consistent series of weather patterns, including
historically observed coincident demand peaks within and between regions.
AEMO is working closely with CSIRO and the Bureau of Meteorology (BOM) through the Electricity Sector
Climate Information (ESCI) project20 to understand the likely and possible impacts of climate change as they
relate to the electricity sector. This project will improve information on the likely future changes to extreme
weather events, including concurrent and/or compounding events to inform analysis on long-term climate
risk. This work will improve AEMO’s ability to forecast supply adequacy across gas, electricity, and the
intersection between the two sectors, as all energy sectors become increasingly dependent on weather.
The GSOO’s supply adequacy assessment has been modelled across all five historical weather years. Any
annual assessment given is an average across the five weather outcomes, while any daily assessments or
figures will refer to a single weather outcome, unless otherwise specified.
Further improvements to demand forecasting have been made, and are discussed in detail in Section 2.3.1.
1.4 Supplementary information
Supporting material including supply input data files, methodology reports, and figures and data is available
on AEMO’s website at https://www.aemo.com.au/energy-systems/gas/gas-forecasting-and-planning/gas-
statement-of-opportunities-gsoo, along with previous GSOO reports. The supply input data files provide
information (including capacity) about pipelines, production facilities, storage facilities, field developments,
and any new projects or known upgrades. These files also provide an update of reserves and resources and
cost estimates used for the GSOO modelling.
Additional material is listed in Table 3 below.
Table 3 Supplementary information
Information source Website address and link
CORE Energy wholesale gas Report:
price outlook https://www.aemo.com.au/-/media/files/electricity/nem/planning_and_forecasting/inputs-
assumptions-methodologies/2019/core-energy-delivered-wholesale-gas-price-outlook-2020-
2050_report.pdf?la=en&hash=4D53CA4DD239E0A075336D0B572462C7
Databook:
https://www.aemo.com.au/-/media/files/electricity/nem/planning_and_forecasting/inputs-
assumptions-methodologies/2019/core-energy-delivered-wholesale-gas-price-outlook-2020-
2050_databook.xlsx?la=en&hash=5260BC9179F0328EB4C26D796980EFF1
Deloitte Access Economics https://www.aemo.com.au/-/media/files/electricity/nem/planning_and_forecasting/inputs-
long term economic assumptions-methodologies/2019/long-term-economic-scenario-forecasts---deloitte-access-
scenarios forecast economics.pdf?la=en&hash=46C9F0C5ED8EF6C6E42FE1988D0D16FB
AEMO Forecasting portal http://forecasting.aemo.com.au/
Gas Bulletin Board – Map and https://www.aemo.com.au/energy-systems/gas/gas-bulletin-board-gbb
Reports
20
For more information on the ESCI project, see https://www.environment.gov.au/climate-change/adaptation.
© AEMO 2020 | Gas Statement of Opportunities 202. Consumption forecasts
2.1 Total eastern and south-eastern gas consumption forecasts
Key trends
• Gas consumption trends continue to be driven by LNG export demand, given its relative volume.
• Short-term trends in total east coast gas consumption forecasts are relatively flat, and slightly higher
than the forecast in the 2019 GSOO, mainly due to slightly higher forecasts for LNG exports and an
increase in forecast GPG for 2020.
• Longer-term forecasts show a reduction in total projected gas consumption, and a lower total forecast
than in the 2019 GSOO from the mid-2020s, primarily due to the lower GPG forecast.
Figure 6 shows the 20-year total consumption forecast for eastern and south-eastern gas markets under the
Central scenario, and the breakdown of the forecast by consumer types. Gas demand forecasts for the 2020
GSOO are available on the AEMO Forecasting data portal 21.
Figure 6 Gas consumption actual and forecast, 2014-39, all sectors, Central scenario (PJ)
2,000
1,500
1,000
PJ
500
0
2020
2021
2023
2024
2027
2028
2030
2031
2033
2034
2037
2022
2025
2026
2029
2032
2035
2036
2038
2039
2017
2014
2018
2015
2016
2019
Calendar Year
Industrial (SIL) Industrial (LIL and MIL) Residential/Commercial
GPG LNG Actual
GSOO 2019 Neutral
Note: LIL, MIL, and SIL are large, medium, and small industrial loads.
21
At http://forecasting.aemo.com.au/. Select ‘GSOO 2020’ from the publication drop-down.
© AEMO 2020 | Gas Statement of Opportunities 212.1.1 Comparison of 2020 GSOO and 2019 GSOO consumption forecasts
Figure 7 compares the 2020 GSOO and 2019 GSOO forecasts for annual consumption across all three
scenarios. In the Central scenario, differences include:
• In the short term, gas consumption is expected to be slightly higher than in the 2019 GSOO, with LNG
exports expected to rise slightly, as two of the three LNG facilities push towards full nameplate capacity,
and GPG consumption increases in 2020, driven by delays in VRE development and the declining
availability of ageing thermal generators.
• In the medium to longer term, forecast total gas demand is lower than in the 2019 GSOO, due to less
forecast growth in GPG usage. GPG is still expected to continue to provide a reliability and security role in
the NEM to complement VRE and coal-fired generation. GPG consumption is forecast to stabilise in the
medium term, then grow slightly in the longer term as further coal generation retires. Compared to the
2019 GSOO, Central GPG forecasts feature more VRE and energy storage projects, and greater NEM
transmission interconnection augmentations, allowing greater resource-sharing between regions.
Figure 7 Gas consumption actual and forecast, 2010-39, all sectors, all scenarios, compared to
equivalent 2019 GSOO scenarios (PJ)
2.2 Trends in consumption drivers
2.2.1 Economic and demographic outlook
Gross State Product and industrial production
AEMO engaged Deloitte Access Economics (Deloitte) to develop long-term economic forecasts for each
Australian state and territory as a key input to AEMO’s demand forecasts, and consistent with the scenarios
outlined in Section 1.2.
In Deloitte’s central scenario (aligned to the 2020 GSOO Central scenario), Gross State Product (GSP) is
forecast to grow at 3.1% annually on average across the NEM regions in the short term (0-5 years), spurred by
public expenditure and a low Australian dollar. GSP is then forecast to transition to an average long-term
growth rate of 2.7% annually, driven by labour force and productivity growth. Productivity is expected to lift
and wage growth is expected to pick up in the longer term, with broad unemployment measures down and
rates of underemployment starting to return to longer-term averages. Deloitte’s central scenario also
© AEMO 2020 | Gas Statement of Opportunities 22You can also read