Economic Outlook 2020 - Recession is coming
←
→
Page content transcription
If your browser does not render page correctly, please read the page content below

Economic Outlook 2020
                                      Recession is coming

                                      Global economic outlook
                                      In our view, what we are going to witness is a V-shape recovery, rather than a U-
                                      shape one, based on four key reasons. First, global economic activities had been
Economic Outlook                      superior ever since the bottom of the Global Financial Crisis, leaving room for
April 30, 2020                        households to jack up their savings. Second, policy responses have been so much
                                      better compared to what we saw during the Global Financial Crisis. Third, we
                                      believe that OPEC+ countries would continue taking the necessary measures to
PT. Mirae Asset Sekuritas Indonesia   tackle supply glut that has hampered prices. Finally, the leverage levels of the
                                      world’s biggest economies are relatively at a good level to embrace the post-
                                      COVID-19 crisis era.
Anthony Kevin
Economist                             The case for Indonesia
anthony.kevin@miraeasset.co.id
+62-21-5088-7000                      As it is the case in other countries, the COVID-19 outbreak has forced Indonesian
                                      people to change their consumption patterns. Throughout March 2020, we saw
                                      some significant changes in the way Indonesian people spend their money: they
                                      are basically hoarding basic necessities while dumping non-essentials.

                                      Even way before the COVID-19 broke out, consumption has been in a downward
                                      trajectory, contradicting consumer confidence that remained relatively high. This
                                      kind of anomaly shows that even though consumers remain optimistic about the
                                      future of Indonesia’s economy, they are being more and more conservative to
                                      anticipate sudden shocks to their financials.

                                      Addressing the impact of current oil prices on Indonesia’s economy, we believe
                                      that low oil prices would be bad for Indonesia’s economy although Indonesia has
                                      been a net importer for quite some time.

                                      From industries’ perspective, Statistics Indonesia breaks down Indonesia’s GDP to
                                      17 industries. Out of these 17 industries, we foresee 15 of them to deliver lower
                                      growth in 2020 compared to 2019, except for the “Information & Communication”
                                      and “Health & Social Work” industries.

                                      Can Indonesia mitigate the economic fallout?
                                      According to Statistics Indonesia, there were as many as 25,763,552 businesses in
                                      Indonesia in 2018. Out of that number, 90.5% (23.3 million) are categorized as
                                      micro-small businesses (generating annual revenue of IDR2.5bn at most), 60.6%
                                      (15.6 million) of which earn annual revenue of less than IDR100mn. To make sure
                                      that Indonesia will enjoy a V-shape recovery, the government needs to make sure
                                      that those micro-small businesses, which obviously have the highest risks of
                                      closing down during this difficult period of time, can survive.

                                      Unfortunately, we think that the government has been playing too safe in trying to
                                      rescue micro-small businesses. As the fiscal stimulus announced by the
                                      government so far constitutes only a small portion to Indonesia’s GDP (2.8%), we
                                      expect the impact to be minimal. Furthermore, we note that there are several
                                      “flaws” in the government’s stimulus packages, especially the third one.

                                      A U-shape one
                                      We foresee 2020 GDP growth to come at 2.2%, with a recession in between as we
                                      expect a deep QoQ contraction in the first and second quarter of 2020.

                                      Going forward, we expect the economic recovery in Indonesia to follow a U-shape
                                      one, even if we will see a V-shape recovery globally, as we foresee the government
                                      to fail in “bailing out” micro-small businesses in the country, which together
                                      become a key element in determining the fate of the recovery.
                                      PLEASE SEE ANALYST CERTIFICATIONS AND IMPORTANT DISCLOSURES & DISCLAIMERS IN APPENDIX 1 AT THE END OF REPORT.
April 30, 2020                                                                                 Economic Outlook 2020

                                                  C O N T E N T S

                    Global economic outlook                                                        3
                        The unexpected game changer                                               3
                        A crisis like no other                                                    5
                        The case of “V” vs. “U”                                                   8
                        More of a “V”                                                            11

                    The case for Indonesia                                                       15
                        Absence of bold leadership leads the nation to crisis                    15
                        Distrust in central government ramping up                                16
                        Hoarding basic necessities and ignoring non-essentials                   18
                        Exports and investments to greatly suffer                                20
                        “Information & Communication” & “Health & Social Work” to outperform     25
                        15 out of 17 industries to record lower growth                           27

                    Can Indonesia mitigate the economic fallout?                                 32
                        Structurally unready                                                     32
                        The tale of a half-hearted stimulus                                      34

                    A U-Shape one                                                                41

Mirae Asset Sekuritas Indonesia Research                                                                          2
April 30, 2020 Economic Outlook 2020
Global economic outlook
The unexpected game changer
Global economic activities were disappointing in 2019. After skyrocketing by 3.6% in 2018,
led by record growth in the US, global economy was struggling in 2019. The International
Monetary Fund (IMF) noted only 2.9% growth throughout 2019, marking the lowest ever
recorded figure since 2009, when the global economy contracted by 0.1% due to global
financial crisis.
The absence of another round of fiscal stimulus in the US, along with trade protectionism,
has crippled down business activities all over the world. From the European Union, the
never-ending drama between the UK and the biggest economic bloc has aggravated things.
Figure 1. Global economic growth Figure 2. 2019 vs. 2018 economic growth difference
(%)
6 5.4 5.5 5.6 5.4
4.8 4.9
5
4.3 4.3
Euro area
ASEAN-5
3.8
EMDE
MECA
4 3.5 3.5 3.6 3.5 3.4 3.6 World
(bps)
SSA
LAC
AE
3.0 3.0 2.9
3 0
2.5
-10
2 -20 -11.5
-30
-40
1
-50 -44.7
-60
0 -70 -57.3
-0.1 -80 -70.5 -68.5
-1 -74.2
-90 -82.4
2000 2002 2004 2006 2008 2010 2012 2014 2016 2018 -100 -94.7
Source: IMF, WEO April 2020, Mirae Asset Sekuritas Indonesia Research Source: IMF, WEO April 2020, Mirae Asset Sekuritas Indonesia Research
Heading into 2020, we initially saw a bright outlook for the global economy as we have been
actively taking risks off the table since the very first month of the year. Take the US-China’s
trade war, for example, which has cooled down following the phase-one trade deal signing
earlier this year. Furthermore, easing pressure on global economy is expected to come from
diminishing risk over the UK’s withdrawal from the EU. Back in February, the UK parliament
finally gave their approval for a withdrawal bill to leave the EU. Currently, the UK and the EU
are in a negotiating period to finalize their trade agreement, with the deadline set at the
end of 2020.
However, just when the optimism started to build up, Coronavirus disease 2019 (COVID-19)
presented itself as the single biggest risk for the global economy. In a matter of a few
weeks, the US-Iran’s tension has cooled off, the US-China’s and the US-EU’s trade rhetoric
disappeared, and waves of demonstrations that have filled streets throughout Hong Kong
for the past few months vanished. While North Korea keeps testing its missiles, which would
be breaking news for international media all around the world a few months ago, nobody
seems to care now.
Originating in Hubei province of China, the outbreak that started at the end of January has
so far infected more than 3.1 million people in more than 200 countries and territories (as of
March 28), with the death toll reaching more than 215,000.
On one side, China had been successful in flattening the curve. However, we were forced to
witness the true power of the virus, which Trump calls as the “invisible enemy”. Combined
together, 10 countries being hit the most by the virus account for almost 60% of global
nominal GDP in 2019. Responding to the outbreak in countries other than China, the World
Health Organization (WHO) has officially declared COVID-19 as a global pandemic.
Mirae Asset Sekuritas Indonesia Research 3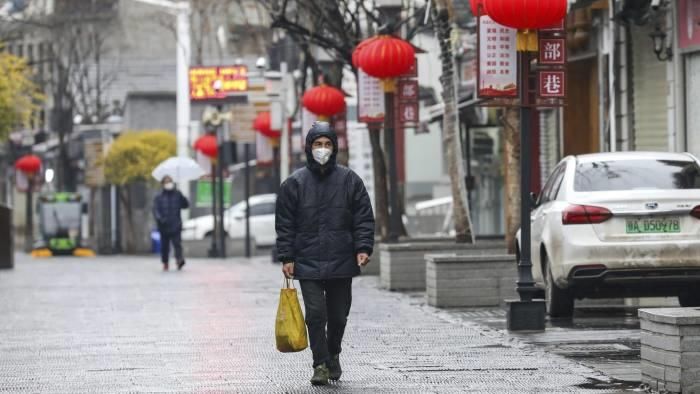
April 30, 2020                                                                                                                                    Economic Outlook 2020

Figure 3. Cumulative COVID-19 cases in 10 worst hit countries                               Figure 4. Shares of 10 worst hit countries to global economy

  (people)                                                                      (people)       (% of Global GDP)
  250,000                                                                       1,000,000            70
                      Spain (L)
                                                                                900,000                                                                            RUS
                      Italy (L)                                                                     60                                                      TUR
  200,000             France (L)                                                800,000                                                                  GBR
                                                                                                    50                                     FRA USA
                      Germany (L)                                               700,000
  150,000             UK (L)                                                    600,000
                                                                                                    40
                                                                                500,000                                                            DEU
                      Turkey (L)
  100,000                                                                       400,000             30                                             ESP
                      Iran (L)
                                                                                                                                                 IRN
                      China (L)                                                 300,000             20                     CHN                 ITA
   50,000             Russia (L)                                                200,000
                                                                                                    10
                      US (R)                                                    100,000
        0                                                                       0                    0
             1/01   1/15       1/29   2/12   2/26   3/11   3/25   4/08   4/22                            1/01   1/15   1/29      2/12   2/26      3/11    3/25    4/08   4/22

                                                                                            Source: Bloomberg, IMF, WEO October 2019, Mirae Asset Sekuritas Indonesia
Source: Bloomberg, Mirae Asset Sekuritas Indonesia Research
                                                                                            Research
                                                                                            A country is added to the list once they are dealing with at least 10,000 cases

                                              To counter the outbreak, countries mainly rely on enforcing the so-called social distancing
                                              measures, ranging from the soft ones, such as limiting mass gatherings and closing down
                                              schools and non-essential business, to more extreme ones, for example, locking people
                                              down on their own homes, as implemented in Hubei province (China) and Italy. The
                                              measures taken by governments all around the world are understandable as it is a matter
                                              of life and death. It has been a new normal that there is no more dining out, exercising at
                                              the gym, going to cinemas, and other activities.

Figure 5. The street of Wuhan during Lunar New Year                                         Figure 6. Police officers patrolling Italy during lockdown

Source: Financial Times, Mirae Asset Sekuritas Indonesia Research                           Source: MailOnline, Mirae Asset Sekuritas Indonesia Research

Mirae Asset Sekuritas Indonesia Research                                                                                                                                        4
April 30, 2020                                                                                                                                                       Economic Outlook 2020

Figure 7. News trend mentions of the word “Death”                                                    Figure 8. OpenTable global seated diners

     (# of times)                                                                                      (% YoY)
       7,000                                                                                             20

       6,000                                                                                                 0

       5,000                                                                                            -20

       4,000                                                                                            -40

       3,000                                                                                            -60

       2,000                                                                                            -80

       1,000                                                                                           -100

             0                                                                                         -120
              2012      2013      2014      2015     2016    2017   2018        2019   2020                      2/18     2/25      3/03   3/10        3/17   3/24   3/31   4/07   4/14    4/21

Source: Bloomberg, Mirae Asset Sekuritas Indonesia Research                                          Source: Bloomberg, Mirae Asset Sekuritas Indonesia Research
Based on stories on the Bloomberg terminal                                                           Data shows YoY seated diners at restaurants on the OpenTable network
xx                                                                                                   OpenTable is a booking app that supports 60,000 restaurants across the US,
xx                                                                                                   Germany, UK, and a few other countries

                                                   A crisis like no other
                                                   This is truly a crisis like no other. The severity of COVID-19 outbreak has altered the ways
                                                   people live their lives. For instance, people are hoarding essential goods and abandoning
                                                   non-essentials to ensure that their basic necessities are fulfilled during the social distancing
                                                   periods. China, a country that dealt with the COVID-19 outbreak sooner than others,
                                                   provides a good example. In February 2020, food prices skyrocketed by more than 20% YoY,
                                                   while price growth of non-food items kept weakening. On the other hand, passenger car
                                                   sales in the world’s second biggest economy plunged by more than 82% YoY, followed by
                                                   nearly 50% YoY contraction in the following month. Breaking down retail sales figure in
                                                   March, everything was down in China, except for foods and beverages.

Figure 9. China’s inflation                                         Figure 10. China’s passenger car sales                                 Figure 11. China’s retail sales

     (% YoY)                                                          (% YoY)                                                                (% YoY)
     25                                                                40                                                                    15
                     Headline inflation
                     Food inflation                                                                                                          10
     20                                                                    20
                     Non-food Inflation                                                                                                           5
     15                                                                     0
                                                                                                                                                  0
     10                                                                -20                                                                    -5

      5                                                                -40                                                                   -10

                                                                                                                                             -15
      0                                                                -60
                                                                                                                                             -20
      -5                                                               -80
                                                                                                                                             -25

  -10                                                                 -100                                                                   -30
           1/15      1/16      1/17       1/18     1/19     1/20                1/15   1/16   1/17    1/18         1/19      1/20                     2/15    2/16   2/17   2/18    2/19    2/20

Source: Bloomberg, Mirae Asset Sekuritas Indonesia                  Source: Bloomberg, Mirae Asset Sekuritas Indonesia                     Source: Bloomberg, Mirae Asset Sekuritas Indonesia
Research                                                            Research                                                               Research
xx                                                                  xx                                                                     Data represent volume

Mirae Asset Sekuritas Indonesia Research                                                                                                                                                           5
April 30, 2020                                                                                                                               Economic Outlook 2020

                                 Figure 12. Breakdown of China’s March retail sales

                                                              Food                                                                                   19.2
                                       Communication equipments                                                                        6.5
                                                         Beverages                                                                     6.3
                                    Alcoholic beverages & tobacco                                              -9.4
                                                         Cosmetics                                         -11.6
                                                       Automobiles                                 -18.1
                                                          Furniture                        -22.7
                                             Household appliances            -29.7
                                             Gold, Silver, & Jewelry         -30.1
                                                           Clothing -36.9

                                                                       -40           -30             -20           -10             0     10         20       30
                                                                                                                         (% YoY)

                                 Source: Bloomberg, Mirae Asset Sekuritas Indonesia Research

                                 As the outbreak has travelled from China all the way to North America and Europe, similar
                                 scenarios are to be expected, hampering the prices of metal, a key element in producing
                                 lots of non-essential goods, such as cars.

                                 Figure 13. S&P GSCI Industrial Metals Price Index

                                    (pts)
                                    450

                                    400

                                    350

                                    300

                                    250

                                    200
                                          1/15 4/15 7/15 10/15 1/16 4/16 7/16 10/16 1/17 4/17 7/17 10/17 1/18 4/18 7/18 10/18 1/19 4/19 7/19 10/19 1/20 4/20

                                 Source: Bloomberg, Mirae Asset Sekuritas Indonesia Research

                                 A series of high-frequency data shows that economists have failed in predicting the severity
                                 of economic slowdown resulting from the COVID-19 outbreak by a notable margin. In China,
                                 for example, 1Q20 GDP growth came in at -6.8% YoY, way lower compared to Bloomberg’s
                                 consensus of only 6%; this marks the first time that the Chinese economy contracted on
                                 record as manufacturing and services activities slumped to their rock bottom.

Mirae Asset Sekuritas Indonesia Research                                                                                                                          6
April 30, 2020                                                                                                                           Economic Outlook 2020

Figure 14. China’s economic growth                                                  Figure 15. China’s manufacturing and services PMI

  (% YoY)                                                                             (pts)
   20                                                                                  65

                                                                                       60
   15
                                                                                       55
   10
                                                                                       50

    5                                                                                  45

                                                                                       40
    0
                                                                                       35
   -5                                                                                  30

                                                                                       25
  -10
                                                                                            1/07 1/08 1/09 1/10 1/11 1/12 1/13 1/14 1/15 1/16 1/17 1/18 1/19 1/20
     1Q92     1Q95    1Q98    1Q01   1Q04   1Q07    1Q10   1Q13     1Q16    1Q19

Source: Bloomberg, Mirae Asset Sekuritas Indonesia Research                         Source: Bloomberg, Mirae Asset Sekuritas Indonesia Research

                                        Meanwhile, the US’ economic data have shown worse-than-expected results; throughout
                                        the last two weeks of March and so far in April, there were three times when initial jobless
                                        claims came in way higher than consensus’ estimate. The past five weekly initial jobless
                                        claims data indicates that 26.5 million of Americans were unemployed during the period. To
                                        put it into perspective, since its low during the global financial crisis, the US’ economy has
                                        created as many as 22.4 million jobs, a number which was then wiped out during the five-
                                        week period of COVID-19 outbreak in the country.

Figure 16. US’ weekly initial jobless claims                                        Figure 17. US’ jobs market during GFC & COVID-19 crisis

  ('000 people)
    7,000
                  Actual
                  Consensus                                                            Unemployment insurance claims*                                              26.5
    6,000

    5,000

    4,000                                                                                        Jobs created since GFC                                     22.4

    3,000

    2,000
                                                                                                    Jobs lost during GFC             8.7
    1,000

        0                                                                                                                  0        10                 20            30
                  Mar 21       Mar 28       Apr 4          Apr 11          Apr 18
                                                                                                                                           (million)

Source: Bloomberg, Mirae Asset Sekuritas Indonesia Research                         Source: Dept. of Labor, Bureau of Labor Statistics, CNBC, Mirae Asset Sekuritas
Date refer to the end period of unemployment insurance claims                       Indonesia Research
xx                                                                                  *cumulative value of the past 5 weekly data ending on April 18

                                        In short, all countries all over the world are experiencing the same thing as China and the
                                        US in that their economic activities had come to a full stop. The only effective way to stop
                                        this mess would be a vaccine. Without any effective curing measures coming anytime soon,
                                        social distancing practices would likely be kept in place.

                                        While several countries have been assessing to reopen their economy in order to relieve
                                        some pressures on production and employment, this plan obviously bears a risk of bringing
                                        another wave of COVID-19 outbreak, which we’ve been witnessing in several Asian
                                        countries, including China.

Mirae Asset Sekuritas Indonesia Research                                                                                                                                  7
April 30, 2020                                                                                                                            Economic Outlook 2020

Figure 18. Daily new COVID-19 cases in                     Figure 19. Daily new COVID-19 cases in                   Figure 20. Daily new COVID-19 cases in
China xx                                                   Singapore                                                Japan xx
                                                             (people)                                                   (people)
                                                              1,600                                                     1,000
  10,000
                                                              1,400                                                       900
                                                                                                                          800
                                                              1,200
   1,000                                                                                                                  700
                                                              1,000                                                       600

     100                                                        800                                                       500
                                                                                                                          400
                                                                600
                                                                                                                          300
      10                                                        400
                                                                                                                          200
                                                                200                                                       100

       1                                                          0                                                         0
           1/24 2/07 2/21 3/06 3/20 4/03 4/17                         1/24 2/07 2/21 3/06 3/20 4/03 4/17                        1/24 2/07 2/21 3/06 3/20 4/03 4/17
                                                                                                                         -100

Source: Bloomberg, Mirae Asset Sekuritas Indonesia         Source: Bloomberg, Mirae Asset Sekuritas Indonesia       Source: Bloomberg, Mirae Asset Sekuritas Indonesia
Research                                                   Research                                                 Research

                                        Unfortunately, although scientists have reported breakthrough in their quest to produce
                                        COVID-19 vaccine, we are not even close to realizing it. Currently, most of COVID-19
                                        vaccines tests are still in the early phase and it would take months or even years of process
                                        before mass production is possible.

                                        Table 1. Vaccine pipeline by company
                                                Company                             Item                         Vaccine type                         Status
                                                Moderna                        mRNA-1273                       RNA vaccine                    Phase 1 trial underway
                                                 Inovio                         INO-4800                      DNA vaccine                   Preparing for phase 1 trial
                                                CureVac                             -                          RNA vaccine                  Phase 1 trial in early June
                                                Novavax                             -                  Recombinant spike protein             Phase 1 trial in May-June
                                                                                                        Non-self-replicating virus
                                                     J&J                             -                                                         Preclinical underway
                                                                                                                  vector
                                                 CSL/GSK                              -                      Protein vaccine                 Preclinical completed
                                                 Generex                              -                      Peptide vaccine                  Phase 1 trial in June
                                                Medicago                    Virus-like particles       Plant-based protein vaccine         Phase 1 trial in Jul.y-August
                                                Altimmune                       NasoVAX                     Influenza vaccine                Phase 1 trial in August
                                        Source: Mirae Asset Daewoo Research, Mirae Asset Sekuritas Indonesia Research

                                        Without any assurance that reopening an economy would be safe, even if the government is
                                        pushing for it, getting workers back to the workplace could be a tough challenge that would
                                        eventually undermine the push towards GDP growth itself.

                                        The case of “V” vs. “U”
                                        Two alphabets have been mentioned a lot during this tough period of time, which are “V”
                                        and “U”, one of which would most likely reflect the economic recovery post-COVID-19 crisis;
                                        although some economies have mentioned other types of recovery, such as “W” and “L”
                                        shapes, we think it is still a matter of a “V” or “U”. A V-shape recovery would mean that the
                                        economic growth for a certain country or region should at least be on the same level as the
                                        one in 2019 before COVID-19 crisis hit.

                                        In its World Economic Outlook for April, the IMF projects global economy to shrink by 3% in
                                        2020, notably lower than the 2008 figure of merely -0.1%, and to be followed by massive
                                        5.8% growth in 2021, thus representing a V-shape recovery, the same shape we got after
                                        the Global Financial Crisis.

  Mirae Asset Sekuritas Indonesia Research                                                                                                                               8
April 30, 2020                                                                                                                                      Economic Outlook 2020

Figure 21. MSCI ACWI & global manufacturing PMI                                             Figure 22. IMF economic growth projection

  (pts)                                                                         (pts)           (%)
              MSCI All-Country World Index (L)
                                                                                                 8         Global
  450                                                                            60
              Bloomberg Global Manufacturing PMI (R)                                                       Advanced Economies
                                                                                                6
  400                                                                            55                        Emerging Markets and Developing Economies
                                                                                                4
  350                                                                            50
                                                                                                2

  300                                                                            45             0
                                                                                                               2019                      2020                       2021
  250                                                                            40             -2

                                                                                                -4
  200                                                                            35
                                                                                                -6
  150                                                                            30
     2007       2008        2009        2010         2011         2012                          -8

Source: Bloomberg, Mirae Asset Sekuritas Indonesia Research                                 Source: IMF, WEO April 2020, Mirae Asset Sekuritas Indonesia Research

                                        In comparison with the severity of economic blowout from COVID-19 outbreak, the Global
                                        Financial Crisis, which is repeatedly said as one of the worst in history, completely seems
                                        like a tiny shock to the economy; in fact, the IMF noted that the Great Lockdown (the term
                                        used by IMF to represent economic shocks caused by COVID-19 outbreak) would be the
                                        worst recession since the Great Depression of 1929, in which the US economy contracted by
                                        cumulatively 50% in a five-year period.

                                        Furthermore, the IMF foresee that even after the severe downgrade to global growth
                                        projection, risks to the outlook are on the downside. In its baseline scenario, the IMF
                                        expects that the pandemic, as well as the required containment, will peak in the second
                                        quarter of the year for most countries in the world and recede in the second half of this
                                        year. However, if the pandemic doesn’t recede in the second half of 2020, which will
                                        eventually lead to longer durations of containment, worse financial conditions, and further
                                        breakdowns of global supply chains, the IMF sees that GDP for 2020 could contract by as
                                        much as 6%.

                                        Figure 23. Global economic growth

                                            (%)
                                             7
                                                                                                                                                                            5.8
                                             6
                                             5
                                             4
                                                                                                                                                                      2.9
                                             3
                                             2
                                             1
                                             0
                                            -1
                                            -2
                                            -3
                                                                                                                                                                        -3.0
                                            -4
                                                  80 81 82 83 84 85 86 87 88 89 90 91 92 93 94 95 96 97 98 99 00 01 02 03 04 05 06 07 08 09 10 11 12 13 14 15 16 17 18 19 20 21

                                        Source: IMF, WEO April 2020, Mirae Asset Sekuritas Indonesia Research
                                        2020 and 2021 figures are IMF’s projection

Mirae Asset Sekuritas Indonesia Research                                                                                                                                          9
April 30, 2020                                                                                                                             Economic Outlook 2020

                                          Before discussing the shape of the recovery further, we’d like to address the bottom of
                                          either the V or the U. As mentioned before, the act of prematurely reopening an economy
                                          carries the risk of bringing another wave of COVID-19 outbreak. In this case, a relatively
                                          good time to reopen the economy would be several weeks after the curve flattens; this way,
                                          countries could mitigate the economic loss of social distancing practices while, at the same
                                          time, preventing the second wave from arriving, although nothing is guaranteed obviously.

                                          As of now, there have been signs that the curve is flattening in 10 big countries being
                                          affected the most by COVID-19. If the trend persists, we expect those countries to
                                          significantly ease social distancing practices by the end of May.

                                          Nevertheless, we observe that as the curve flattens in North America and Europe, the
                                          hotspot of COVID-19 moves toward Asia. As of March 26, India has 27,890 COVID-19
                                          cumulative cases, followed by Singapore (13,624), Indonesia (8,882), Malaysia (5,780), and
                                          Thailand (2,922). As of 2019, these five economies contributed 6.1% to global nominal GDP,
                                          and this will obviously restrain the recovery in other parts of the world. In short, we think
                                          the bottom of either the V or the U will be reached at the end of May.

Figure 24. Cumulative cases in Indonesia                                                 Figure 25. Cumulative cases in India

  (people)                                                                                  (people)
   10,000                                                                                    30,000
    9,000
                                                                                            25,000
    8,000
    7,000
                                                                                            20,000
    6,000
    5,000                                                                                   15,000
    4,000
                                                                                            10,000
    3,000
    2,000
                                                                                              5,000
    1,000
          0                                                                                       0
              3/01   3/08   3/15   3/22     3/29    4/05   4/12       4/19   4/26                     1/30 2/08 2/17 2/26 3/06 3/15 3/24 4/02 4/11 4/20

Source: Bloomberg, Mirae Asset Sekuritas Indonesia Research                              Source: Bloomberg, Mirae Asset Sekuritas Indonesia Research

                                                           Figure 27. Cumulative cases in
Figure 26. Cumulative cases in Malaysia                                                                             Figure 28. Cumulative cases in Thailand
                                                           Singapore
  (people)                                                   (people)                                                  (people)
   7,000                                                     16,000                                                     3,500

  6,000                                                      14,000                                                    3,000
                                                             12,000
  5,000                                                                                                                2,500
                                                             10,000
  4,000                                                                                                                2,000
                                                              8,000
  3,000                                                                                                                1,500
                                                              6,000
  2,000                                                                                                                1,000
                                                              4,000
  1,000                                                       2,000                                                      500

      0                                                           0                                                        0
          1/25 2/06 2/18 3/01 3/13 3/25 4/06 4/18                     1/23 2/04 2/16 2/28 3/11 3/23 4/04 4/16                  1/12 1/26 2/09 2/23 3/08 3/22 4/05 4/19

Source: Bloomberg, Mirae Asset Sekuritas Indonesia         Source: Bloomberg, Mirae Asset Sekuritas Indonesia       Source: Bloomberg, Mirae Asset Sekuritas Indonesia
Research                                                   Research                                                 Research

Mirae Asset Sekuritas Indonesia Research                                                                                                                             10
April 30, 2020 Economic Outlook 2020
More of a “V”
In our view, what we are going to witness is a V-shape recovery, rather than a U-shape one,
based on four key reasons. First, global economic activities had been superior ever since the
bottom of the Global Financial Crisis, leaving room for households to jack up their savings.
In the US, for example, economic expansion has lasted for 128 months, from 2009 through
February 2020, making it the longest run on record.
Although it is true that cumulative GDP and employment growth figures during the latest
expansions were lower than the previous ones, we should remember that the US’ GDP per
capita (PPP-based) was considerably higher in 2009 compared to the start of the preceding
expansion; as such, we could say that the latest economic expansion in the US that lasted
128 months (a contraction is almost certain for March) resulted in a relatively high
improvement in the net worth of Americans.
Figure 30. US’ GDP growth during Figure 31. US’ jobs growth during
Figure 29. US’ economic expansion
expansion expansion
2009-'20 128 (%) (%)
60 25 1949
1991-01 120 1949
1961-'69 1961 1961
105
50 1975 20 1975
1982-'90 93
1982 1982
2001-'07 72
40 1991 1991
1975-'80 60 15 2001
2001 12%
1949-'53 42 30 2009
2009 25%
1954-'57 39 10
1945-'48 36 20
1970-'73 36
5
1958-'60 24 10
1980-'81 12
0 0
0 50 100 150 1 16 31 46 61 76 91 106 121 1 16 31 46 61 76 91 106 121
(Months of expansion) (months of expansion) (months of expansion)
Source: National Bureau of Economic Research, Source: St. Louis Federal Reserve, CNBC, Mirae Asset Source: St. Louis Federal Reserve, CNBC, Mirae Asset
CNBC, Mirae Asset Sekuritas Indonesia Research Sekuritas Indonesia Research Sekuritas Indonesia Research
Data for 2009-‘20 are through February 2020 Legends represent the beginning of economic Legends represent the beginning of economic
xx expansion expansion
xx Data for 2009 are through February 2020 Data for 2009 are through February 2020
Throughout the past few years, the US’ net household saving rate, which represents the
total amount of net saving as a percentage of net household disposable income, has been
on the rise, meaning that the US’ economy is better prepared to embrace the post-recession
era, with the figure reaching 7.96% in 2018, the highest since 2012. Although the same can’t
be said for other countries, unfortunately, we are of the opinion that the US’ figures are the
most important as this country is still holding the throne as the world’s biggest economic
powerhouse.
Mirae Asset Sekuritas Indonesia Research 11April 30, 2020 Economic Outlook 2020
Figure 32. Net household saving rate from selected AE & EM
(%) (%)
US Euro Area Japan Germany UK Italy Canada China
12 45
40
10
35
8
30
6 25
4 20
15
2
10
0
5
00 01 02 03 04 05 06 07 08 09 10 11 12 13 14 15 16 17 18
-2 0
Source: OECD, Mirae Asset Sekuritas Indonesia Research
Net Household saving rate is defined as household net disposable income plus the adjustment for the change in pension
entitlements less household final consumption expenditure (households also include non-profit institutions serving households).
Net household saving rate represents the total amount of net saving as a percentage of net household disposable income.
The second reason that led us to believe that global economic growth would mimic the
alphabet of “V” is that policy responses, from both central banks and central governments,
have been so much better compared to what we saw during the Global Financial Crisis. Take
the Federal Reserve as an example; during the COVID-19-driven crisis, this closely-watched
central bank in the financial market decided to slash benchmark rate to zero in just a two-
week span, while it took more than a year in 2008 to bring the rate down to zero.
Furthermore, the Fed announced an open-ended commitment to keep buying assets under
its quantitative easing (QE) measures, while moving for the first time into corporate bonds,
purchasing the investment-grade securities in primary and secondary markets and through
exchange-traded funds. As if the move doesn’t shock the market enough, the Fed then
proceeded to tap into junk bond market.
Figure 33. Federal funds rate Figure 34. Federal Reserve’s balance sheet
(%) (US$ tr)
6 7
Federal Funds Rate - Upper Bound
5 6
5
4
4
3 More than a year
3
2
2
Two
1 weeks
1
0 0
2005 2008 2011 2014 2017 2020 2000 2002 2004 2006 2008 2010 2012 2014 2016 2018 2020
Source: Bloomberg, Mirae Asset Sekuritas Indonesia Research Source: Bloomberg, Mirae Asset Sekuritas Indonesia Research
Meanwhile, on March 27, the US government launched a US$2.2tr stimulus package, labeled
as “Coronavirus Aid, Relief, and Economic Security Act”, far exceeding “American Recovery
and Reinvestment Act of 2009” which was only worth US$831bn. While the package already
exceeded 10% of the US’ nominal GDP in 2019, the central government keeps pushing
another wave of stimulus, bringing the total to 14% of GDP. The move to deliver massive-
sized economic stimulus wasn’t adopted by the US alone but also other big economies.
Mirae Asset Sekuritas Indonesia Research 12April 30, 2020 Economic Outlook 2020
Figure 35. Breakdown of US’ US$2.2tr fiscal stimulus Figure 36. COVID-19 fiscal stimulus from selected AE
Germany 27.9
Italy 26.4
Japan 21.1
Spain 20
France 19
UK 17.5
US 14
Australia 9.9
Netherland 9
Canada 8.4
0 5 10 15 20 25 30
(% of GDP)
Source: Reuters, Mirae Asset Sekuritas Indonesia Research Source: IMF, Bloomberg, DW, Mirae Asset Sekuritas Indonesia Research
Third, we believe that OPEC+ countries would continue taking the necessary measures to
tackle supply glut that has hampered prices. Since the outbreak started, key commodity
prices have been going down. In early March, oil prices were curbed when Saudi Arabia
started a rare, terrifying price war with Russia over oil. Initially, the kingdom proposed
additional production cuts of 1.5 million barrels per day starting in April and extended these
until the end of the year. However, Russia rejected the additional cuts when the 14-member
cartel and its allies, known as the OPEC+, met on March 6.
Mediated by the US’ President Donald Trump, OPEC and its oil-producing allies then
finalized an agreement to cut production by 9.7 million barrels per day — the single largest
output cut in history. The 9.7 million bpd cut will begin on May 1 and will extend until the
end of June. The cuts will then taper to 7.7 million bpd from July through the end of 2020,
followed by 5.8 million bpd cut from January 2021 to April 2022. The 23-nation group will
meet again on June 10 to determine if a further action is needed. Nevertheless, despite the
record-breaking cut, oil prices, along with other commodities, continue to slide as demand
concerns continue to weigh on.
We believe that OPEC+ countries would continue taking the necessary moves to prop up
prices, simply because their fiscal break-even prices, the price at which the fiscal balance is
zero, are nowhere close to the current level. Another round of oil production cut should
cushion the economic blow towards commodity-dependent economies.
Figure 37. Commodity prices Figure 38. Break-even oil prices
(Jan 2, 2015=100) Algeria 157
250 WTI Bahrain 96
Brent
200 Coal Oman 87
CPO
Natural Gas Saudi Arabia 76
150
Industrial Metals
UAE 69
100
Kuwait 61
50 Iraq 60
Libya 58
0
Russia 42
-50
Qatar 40
-100 0 50 100 150 200
1/15 8/15 3/16 10/16 5/17 12/17 7/18 2/19 9/19 4/20 (US$/barrel)
Source: Bloomberg, Mirae Asset Sekuritas Indonesia Research Source: IMF, Mirae Asset Sekuritas Indonesia Research
xx Data are IMF’s projection for 2020
Mirae Asset Sekuritas Indonesia Research 13April 30, 2020 Economic Outlook 2020
Finally, the leverage levels of the world’s biggest economies are relatively at a good level to
embrace the post-COVID-19 crisis era. While China’s debt burden is notably higher than that
of the Global Financial Crisis era, other countries, including the US, are in a relatively good
shape to jack up debt and boost growth. Combined with massive liquidity pump from
central banks all over the world, we are confident that we are going to witness a V-shape
recovery.
Figure 39. Credit to private non-financial sector Figure 40. G4 central banks’ balance sheet
(% of GDP) (% of GDP)
250 45
Average 2008-2009
4Q19 40
200 35
30
150
25
20
100
15
10
50
5
0 0
US China Japan Germany UK Indonesia 1/00 1/02 1/04 1/06 1/08 1/10 1/12 1/14 1/16 1/18 1/20
Source: Bloomberg, Mirae Asset Sekuritas Indonesia Research Source: Bloomberg, Mirae Asset Sekuritas Indonesia Research
xx G4 central banks are the Fed, ECB, BOE, and BOJ
Mirae Asset Sekuritas Indonesia Research 14April 30, 2020 Economic Outlook 2020
The case for Indonesia
Absence of bold leadership leads the nation to crisis
Since the last time we published our economic outlook, downside risks are clearly
materializing. In our economic outlook, titled “Flat outlook amid COVID-19 outbreak”
(published on March 14), we forecast the base-case scenario for Indonesia’s economy to
record 5.02% growth in 2020, the same level as last year’s; our base-case scenario was for
the number of new COVID-19 cases in China to remain at 80 per day or even less, new cases
outside China to drop to around 2,000 nearing the end of March, and no outbreak in
Indonesia.
Meanwhile, our bear-case scenario is that the outbreak extends way beyond March and
occurs in Indonesia. Under this scenario, Indonesia would not be able to greatly monetize
the festive season in April and May. Then, we predict economic growth to fall below the
psychological level of 5%, precisely at 4.85%.
The recent developments have pointed more to our bear-case scenario than the base-case
one, i.e. global COVID-19 outbreak extends way beyond March and also occurs in Indonesia;
as of March 26, the government has reported 8,882 COVID-19 positive cases in the country.
Ever since the beginning of the outbreak in China, the government had already been wrong
in responding to the disease. Instead of taking preemptive measures, on February 25, the
government launched a fiscal stimulus worth IDR10.3tr, a part of which was allocated to
boost the number of foreign tourists in the country. Moving on to March 2, President Joko
“Jokowi” Widodo announced the first two cases in Indonesia, in which the infections came
from a Japanese national visiting Indonesia; the first COVID-19 positive patient in Indonesia
then infected at least two more people, labeled as case number 3 and 4 by the central
government.
Even after the first two COVID-19 positive cases were confirmed, the government has been
really slow in adopting measures to limit the outbreak: on March 15, Jokowi urged social
distancing practices with no legal basis to enforce it. Throughout most of March, the
government clearly struggled to choose between economic activities and containment of
the virus, which then led to a prolonged period of no legal action taken to prevent the
disease from spreading wider. Despite massive pressures to lock the nation down or at least
DKI Jakarta, which is the hotspot of the outbreak (3,746 confirmed cases as of March 26),
President Jokowi dismissed both options.
At the end of March, President Jokowi signed the legal basis for large-scale social distancing
(Pembatasan Sosial Berskala Besar/PSBB), passing on the responsibility to regional
governments; unlike the lockdown policy, in which the central government has absolute
power to execute the plan, the large-scale social distancing requires each regional
government to present the case to the central government and seek an approval from the
central government before implementing the policy.
While the terms sound similar, based on the law that regulates it, “lockdown” and “large-
scale social distancing” turn out to be different animals. Should the central government
enact a lockdown, then they could enforce a stay-at-home policy legally, while at the same
time being held responsible for the basic necessities of the people within the locked area.
On the contrary, large-scale social restrictions only equip the government with relatively
limited power in prohibiting people from gathering.
Mirae Asset Sekuritas Indonesia Research 15April 30, 2020 Economic Outlook 2020
Figure 41. Timeline of COVID-19 outbreak in Indonesia
(people)
Mar 15: President Jokowi urged social Apr 16: PSBB had only
10,000 been enforced in several
distancing practices, no legal basis
9,000 to enforce it areas
8,000 Apr 2: Govt. suspends
Mar 6: Govt. announced cases number
7,000 3 and 4, in which infections came from foreigners from entering
6,000 contacts with the first patient Indonesia
5,000 Mar 2: President Jokowi announced the Mar 31: President Jokowi signed
4,000 first two cases in Indonesia, in which the legal basis for PSBB, passing
infections came from a foreigner on responsibility to regional
3,000 govts.
2,000 Feb 25: Govt. announced stimulus
package worth IDR10.3tr, partly aimed
1,000
to lure foreign tourists
0
2/25 2/29 3/04 3/08 3/12 3/16 3/20 3/24 3/28 4/01 4/05 4/09 4/13 4/17 4/21 4/25
Source: Bloomberg, various media outlets, Mirae Asset Sekuritas Indonesia Research
Distrust in central government ramping up
What’s even more concerning for Indonesian people regarding the COVID-19 outbreak is
the way the government updates the development. In addition to the fact that the central
government has been way behind other countries in conducting tests, there have been lots
of inconsistencies in reporting between the regional governments and the central
government.
There were numerous times when the central government reported fewer new cases than
the ones announced by regional governments (please note that the reporting by the central
government, which is usually done in the afternoon, should be the aggregate of total cases
all over the country).
Also, speaking of the tests, so far Indonesia has indeed been way behind other countries in
conducting tests. As of March 18, the government has only conducted a total of 42,219
tests, which translates into only 0.15 test per 1,000 people.
Figure 42. Total COVID-19 tests performed by country Figure 43. Total COVID-19 tests per 1,000 people
US 3.70 Norway 26.09
Russia 1.95 Australia 16.58
South Korea 0.56 Russia 13.56
France 0.46
Belgium 13.22
Australia 0.42
US 11.16
UK 0.37
South Korea 10.86
India 0.37
UK 5.54
Belgium 0.15
Norway 0.14 India 0.27
Indonesia 0.04 Indonesia 0.15
0 1 2 3 4 0 5 10 15 20 25 30
(Million of tests performed) (Number of tests performed)
Source: Our World in Data, Mirae Asset Sekuritas Indonesia Research Source: Our World in Data, Mirae Asset Sekuritas Indonesia Research
Data as of April 18 Data as of April 18
Mirae Asset Sekuritas Indonesia Research 16April 30, 2020 Economic Outlook 2020
Though it seems that the government has been putting undivided attention to the handling
of COVID-19 outbreak, this may not be the case at all. On March 31, President Jokowi
announced an economic stimulus package worth IDR405.1tr to mitigate the economic
impact of COVID-19, IDR75tr of which would be directed towards healthcare-related things,
such as the provision of medical equipment, subsidies for BPJS contribution, and death
compensation for healthcare workers. That figure accounts for 0.5% of nominal GDP, a
relatively generous amount of additional budget for the health sector compared to other
countries with greater value of total stimulus, such as Singapore (at SGD800 million of
health budget, representing 0.2% of GDP, vs. total budget at 10.9% of GDP) and Australia (at
AUD5 billion of health budget, representing 0.3% of GDP, vs. total budget at 9.7% of GDP).
Nevertheless, we note that our healthcare system was way inadequate to combat COVID-19
in the first place. As such, we don’t believe that the fresh money spent by the government
will bear significantly positive impacts. In other words, the outbreak will very likely keep
wide-spreading.
Figure 44. Number of beds per 1,000 people Figure 45. Number of ICU beds per 100,000 people
South Korea 11.5 Singapore 11.4
China 4.2 South Korea 10.6
Singapore 2.4 China 3.6
Malaysia 1.9 Malaysia 3.4
Indonesia 1.2 Indonesia 2.7
0 2 4 6 8 10 12 14 0 2 4 6 8 10 12
(Number of beds)
(Number of beds)
Source: WHO, World Bank, BBC, Mirae Asset Sekuritas Indonesia Research Source: WHO, World Bank, BBC, Mirae Asset Sekuritas Indonesia Research
Figure 46. Number of doctors per 1,000 people Figure 47. Healthcare expenditure per capita
Singapore 2,462
South Korea 2.4
South Korea 2,044
Singapore 2.3
China China 398
1.8
Malaysia 1.5 Malaysia 362
Indonesia 0.4 Indonesia 112
0 0.5 1 1.5 2 2.5 3 0 500 1,000 1,500 2,000 2,500 3,000
(Number of doctors) (US$)
Source: WHO, World Bank, BBC, Mirae Asset Sekuritas Indonesia Research Source: WHO, World Bank, BBC, Mirae Asset Sekuritas Indonesia Research
In their current estimation, Indonesia’s State Intelligence Agency predicts total cumulative
cases in Indonesia to exceed 95,000 by the end of next month (May) and then top 105,000
as of the end of June. For July, the agency foresees the number of new cases to be less than
1,000. Considering all the developments in the country, we believe that 100,000 cumulative
cases should be treated as the base case in making projections, with the peak in June.
Mirae Asset Sekuritas Indonesia Research 17April 30, 2020 Economic Outlook 2020
As such, the pressure on economic activities will reach its peak in 2Q20 during which
Indonesia and other countries are battling the worst of COVID-19 outbreak. Meanwhile, we
may expect macroeconomic data to improve in the last two quarters of the year.
Hoarding basic necessities and ignoring non-essentials
As it is the case in other countries, the COVID-19 outbreak has forced Indonesian people to
change their consumption patterns. Throughout March 2020, we saw some significant
changes in the way Indonesian people spend their money: they are basically hoarding basic
necessities while dumping non-essentials.
Just a few moments after the government confirmed the first two COVID-19 cases in
Indonesia, both modern and traditional markets across the country, especially in Jakarta
and its surrounding areas, were experiencing a surge in customers. This coincided with
broader practices of staying at home as regional governments decided to postpone school
activities.
From our on-the-ground checks at several malls of different market segments during the
period of March 22-25 (when malls were still operating), including those for: 1) mid-to-high
income people, i.e. Central Park, Taman Anggrek, and Grand Indonesia; and, 2) mid-to-low
income people, i.e. City Plaza Jatinegara, we found that those malls had much fewer visitors
since the week following March 16, 2020, recorded at only around 10% rate of the normal
condition. Another finding was that customers still spent money on staples, vitamins, and
medicine, while reducing spending on others.
Figure 48. People rushing at
Figure 49. Hoarding basic necessities Figure 50. Ignoring non-essentials
supermarket
Source: Kompas, Mirae Asset Sekuritas Indonesia Source: Mirae Asset Sekuritas Indonesia Research Source: Mirae Asset Sekuritas Indonesia Research
Research xxxxxx xxxxx
Mirae Asset Sekuritas Indonesia Research 18April 30, 2020 Economic Outlook 2020
Figure 51. Central Park on weekend Figure 52. No queue at Chatime
Source: Mirae Asset Sekuritas Indonesia Research Source: Mirae Asset Sekuritas Indonesia Research
Even way before the COVID-19 broke out, consumption has been in a downward trajectory,
contradicting consumer confidence that remained relatively high. This kind of anomaly
shows that even though consumers remain optimistic about the future of Indonesia’s
economy, they are being more and more conservative to anticipate sudden shocks to their
financials.
Throughout the Ramadan period in 2019 (May-June), consumption was relatively weak.
Although retail sales rose by 7.7% YoY in May 2019, there was a contraction of 1.8% YoY in
June; this marks the first time since at least 2011 that retail sales contracted during the
festive season. A preliminary figure from Bank Indonesia shows that March’s retail sales
shrunk by 5.4% YoY, marking the second-worst contraction ever recorded since the survey
was conducted back in 2011.
There is one interesting finding in the central bank’s latest retail sales survey. Throughout
March 2020, all components of retail sales were down in YoY terms, even “Food, Beverages,
and Tobacco”, which was recorded at -0.1%; this signals that the extent of COVID-19
outbreak towards Indonesia’s economy is really severe so that its people need to consume
less of the basic necessities.
Figure 53. Indonesia’s consumer confidence index and retail
Figure 54. Breakdown of March 2020 retail sales figure
sales
(pts) (% YoY)
140 Consumer Confidence Index (L) 30 -0.1 F&B
Retail Sales Growth (R)
25
130 -2.6 Other Household Equipment
20
-5.1 Motor vehicles
120
15
-8.1 Automotive Fuels
110 10
-10.5 Communication Equipment
5
100
0 -11.6 Cultural & Recreation Goods
90
-5 -40.6 Other Goods
80 -10 -50 -40 -30 -20 -10 0
1/11 11/11 9/12 7/13 5/14 3/15 1/16 11/16 9/17 7/18 5/19 3/20 (% YoY)
Source: Bloomberg, Mirae Asset Sekuritas Indonesia Research Source: Bank Indonesia, Mirae Asset Sekuritas Indonesia Research
March’s data are preliminary figures Data are preliminary figures
Mirae Asset Sekuritas Indonesia Research 19April 30, 2020 Economic Outlook 2020
Exports and investments to greatly suffer
From the perspective of exports, which makes up 21% of Indonesia’s GDP, we foresee a big
blowout to come. Indeed, cumulatively in the first three months of the year, exports
improved by 2.91% YoY, while imports were down merely by 3.69% YoY. As a matter of fact,
economists have clearly failed in quantifying the impact of COVID-19 outbreak on
Indonesia’s international trade. For March 2020, for example, economists expect both
exports and imports to record a pretty deep decline of 5.49% YoY and 7.51% YoY,
respectively; in fact, both exports and imports edged down by merely 0.2% YoY and 0.75%
YoY, respectively.
Figure 55. Indonesia’s international trade figures
(US$ mn) (US$ mn)
20,000 4,000
Exports (L)
18,000 Imports (L)
Trade Balance (R) 3,000
16,000
14,000 2,000
12,000
1,000
10,000
0
8,000
6,000 -1,000
4,000
-2,000
2,000
0 -3,000
1/18 4/18 7/18 10/18 1/19 4/19 7/19 10/19 1/20
Source: Statistics Indonesia, Mirae Asset Sekuritas Indonesia Research
Figure 56. Indonesia’s exports vs. consensus Figure 57. Indonesia’s imports vs. consensus
(% YoY) (% YoY)
14
Actual 11.99 0
12
Bloomberg consensus -1
10 -0.75
8 -2
6 -3
4 -3.1
-4
2 1.19
0 -5
-4.82 -4.75
-2 -0.20
-6 -5.54
-2.12
-4 Actual
-7
-6 Bloomberg consensus
-5.6 -5.49 -8 -7.51
-8 Jan-20 Feb-20 Mar-20
Jan-20 Feb-20 Mar-20
Source: Statistics Indonesia, Bloomberg, Mirae Asset Sekuritas Indonesia Research Source: Statistics Indonesia, Bloomberg, Mirae Asset Sekuritas Indonesia Research
While international trade data for March might bring some sort of relief for some, in our
opinion, it would be premature to say that Indonesia’s economy was doing better than
others in navigating the COVID-19 outbreak. The main reason is that in March, although
several big economies were witnessing severe jumps in the number of COVID-19 cases in
their countries, the movement of people and, thus, economic activities had only been
limited nearing the end of the month.
Mirae Asset Sekuritas Indonesia Research 20April 30, 2020 Economic Outlook 2020
Meanwhile, as previously mentioned, Indonesia’s official measure to limit the movement of
people, or the so-called large-scale social restrictions, was just adopted in April. Although
work-from-home practices have previously been enforced by companies before the large-
scale social restrictions were enacted, we suspect that large-scale companies engaged in
international shipments were still operating at nearly full capacity, thus limiting the decline
in Indonesia’s both exports and imports.
Table 2. Lockdown measures in Indonesia’s key export markets
Country Place Start Date End Date Level
China Hubei January 23 April 8 Province
California March 19 State
Clark County, NV March 20 County
Connecticut March 23 April 22
State
Illinois March 21
Kansas City, KS March 24 April 19 City
US
Massachusetts March 24
Michigan March 24
New York March 20 April 29 State
Oregon March 24
Wisconsin March 24
Chiba
Fukuoka
Hyōgo
Japan Kanagawa April 7 May 6 Prefecture
Osaka
Saitama
Tokyo
Singapore April 7 May 4 National
India March 25 May 3 National
Malaysia March 18 April 28 National
South Korea No heavy-handed lockdown
Cebu March 27 Province
Davao Region March 19 Region
Philippines April 30
Luzon March 15 Island group
Soccsksargen March 23 Region
Thailand March 25 April 30 National
Vietnam Ha Loi April 7 April 21 Rural district
Source: Various sources, Mirae Asset Sekuritas Indonesia Research
Starting in April, we foresee our exports to reflect the impact of COVID-19 outbreak, based
on two reasons. First, out of Indonesia’s biggest export markets in 2019, most of them,
particularly the US, were struggling with the COVID-19 outbreak throughout the month,
which then led to a blowout to their economic activities as respective governments took the
necessary measures to prevent the disease from spreading further.
Mirae Asset Sekuritas Indonesia Research 21April 30, 2020 Economic Outlook 2020
Figure 58. Indonesia’s top-5 export destinations Figure 59. Cumulative COVID-19 cases in key export markets
(Jan 30, 2020=100)
China 27.9 100,000,000 China
US
Japan
US 17.6
1,000,000 Singapore
India
Japan 15.9
10,000
Singapore 12.9
100
India 11.8
0 5 10 15 20 25 30 1
1/30 2/06 2/13 2/20 2/27 3/05 3/12 3/19 3/26 4/02 4/09 4/16 4/23
(USD bn)
Source: Statistics Indonesia, Mirae Asset Sekuritas Indonesia Research Source: Bloomberg, Mirae Asset Sekuritas Indonesia Research
Data are as of 2019 Data are as presented in logarithmic scale
Second, most of Indonesia’s exports consist of the non-essentials – considered so at least
during the pandemic – and these items are commodities; 60% out of Indonesia’s total
exports are commodities. Amid the current situation when economic activities have basically
come to a full stop, commodities are becoming less and less essential, especially with all the
inventories the world has been piling up.
Figure 60. Indonesia’s exports composition Figure 61. Indonesia’s key export commodities
Coal 18.9
Palm oil 15.6
Commodities Gas 8.8
60%
Others
Iron/steel 7.9
Precious metals 4.6
0 5 10 15 20
(US$ bn)
Source: Cekindo Business International, Mirae Asset Sekuritas Indonesia Research Source: Statistics Indonesia, Mirae Asset Sekuritas Indonesia Research
Data are from the 12-months period ending October 2018 Data as of 2019
One extreme example of commodities becoming less and less valuable could be observed
on April 20, when the prices of expiring May oil contract closed at –US$38/barrel. As of April
24, the benchmark contracts for WTI and Brent oil were trading at US$16.9/barrel and
US$21.4/barrel, respectively.
Mirae Asset Sekuritas Indonesia Research 22April 30, 2020 Economic Outlook 2020
Figure 62. WTI oil price (May 2020 contract) Figure 63. Benchmark WTI & Brent oil price
(US$/barrel) (US$/barrel)
70 100 WTI
80 Brent
50
60
30
40
10 20
-10 0
-20
-30
-40
-50 -60
1/19 3/19 5/19 7/19 9/19 11/19 1/20 3/20 1/19 3/19 5/19 7/19 9/19 11/19 1/20 3/20
Source: Bloomberg, Mirae Asset Sekuritas Indonesia Research Source: Bloomberg, Mirae Asset Sekuritas Indonesia Research
In this so messed-up world, chip turns out to be the winner. During the period of March,
export orders of Taiwan, the world’s largest chip producer, rose by 4.3% YoY, defying the
expectation of a -7.8% YoY decline and marking the first improvement in 3 months.
Breaking down the data, almost all of the components went down, with electronics and
electrical products being the rare exceptions.
Figure 64. Taiwan’s export orders growth Figure 65. Breakdown of Taiwan’s March 2020 export orders
(% YoY) Electronics 23.8
25
Electrical products 8.6
20 Infocomm 6.9
Transportation equipments -0.7
15
Machineries -1.1
10 Others -2.1
Optical instruments -6
5
Basic metals -8.5
0 Textile -9.9
-5 Plastics -11.6
Chemicals -19.8
-10 Mineral products -45.8
-15 -60 -40 -20 0 20 40
1/15 7/15 1/16 7/16 1/17 7/17 1/18 7/18 1/19 7/19 1/20 (% YoY)
Source: Bloomberg, Mirae Asset Sekuritas Indonesia Research Source: Bloomberg, Mirae Asset Sekuritas Indonesia Research
Concerning our GDP outlook from the expenditure approach, another massive blow will be
dealt by investments; as of 2019, investments constituted 33% of Indonesia’s GDP. In 2020,
FDI realization, which contributed 52% to Indonesia’s direct investment in 2019, is most
likely to keep underperforming as key players in Indonesia’s FDI market are dealing with the
COVID-19 outbreak.
For information, 2019 marks the second consecutive year during which FDI realization came
in below 100% under the regime of President Jokowi, recorded by the Indonesian
Investment Coordinating Board at IDR423.1tr, realizing only 87.5% of the target set at
IDR483.7tr.
Mirae Asset Sekuritas Indonesia Research 23April 30, 2020 Economic Outlook 2020
Figure 66. Key players on Indonesia’s FDI Market Figure 67. FDI realization vs. target
(IDR tr)
Singapore 600 Realization
6.5
Target
500
China 4.7 430.5 423.1
396.6 392.7
400 365.9
Japan 4.3
300
Hong Kong 2.9
200
Netherland 2.6 100
1 2 3 4 5 6 7 0
(US$ bn) 2015 2016 2017 2018 2019
Source: Indonesian Investment Coordinating Board, Mirae Asset Sekuritas Source: Indonesian Investment Coordinating Board, Mirae Asset Sekuritas
Indonesia Research Indonesia Research
While we deem that the uncertainty over Indonesia’s geopolitical landscape was the main
problem that hampered foreign investors from pouring their money into Indonesia, strong
Rupiah also contributed in dampening FDI realization. For 2020, it is clear that there is a
weak investment trend all around the globe, shown by rising inventories of global nickel
and tin.
Figure 68. Global nickel inventories Figure 69. Global tin inventories
('000 tonnes) ('000 tonnes)
500 30
450
25
400
350 20
300
250 15
200
10
150
100
5
50
0 0
2010 2011 2012 2013 2014 2015 2016 2017 2018 2019 2020 2010 2011 2012 2013 2014 2015 2016 2017 2018 2019 2020
Source: Bloomberg, Mirae Asset Sekuritas Indonesia Research Source: Bloomberg, Mirae Asset Sekuritas Indonesia Research
Another strong evidence that FDI and investments in general will underperform this year
comes from imports figure. Cumulatively in the first three months of 2020, imports of raw
materials fell by 2.82%, while imports of capital goods contracted by 13.07%. Lower value of
raw material imports aligned with weak manufacturing activities; in March, IHS Markit
recorded Indonesia’s manufacturing PMI at 45.3, marking the worst contraction ever in the
nine-year survey history. Meanwhile, lower value of capital goods imports indicates weak
confidence over the future of Indonesia’s economic outlook, which then led companies to
scale back their investment.
Mirae Asset Sekuritas Indonesia Research 24April 30, 2020 Economic Outlook 2020
Figure 70. Indonesia’s imports
(% YoY)
50 Total Imports
Consumer Gooods
40
Raw Materials
30 Capital Goods
20
10
0
-10
-20
-30
1/18 3/18 5/18 7/18 9/18 11/18 1/19 3/19 5/19 7/19 9/19 11/19 1/20 3/20
Source: Statistics Indonesia, Mirae Asset Sekuritas Indonesia Research
Data are cumulative figures
“Information & Communication” & “Health & Social Work” to outperform
From industries’ perspective, Statistics Indonesia breaks down Indonesia’s GDP to 17
industries. Out of these 17 industries, we foresee 15 of them to deliver lower growth in 2020
compared to 2019, except for the “Information & Communication” and “Health & Social
Work” industries.
We forecast “Information & Communication” industry to record massive growth of 12% in
2020 as we believe that data consumption should increase dramatically due to longer time
spent at home; currently, the operations of at least 48 malls in Jabodetabek area are being
limited.
Higher usage of communication services has resulted in the appreciation on the shares of
Telekomunikasi Indonesia (TLKM), the largest mobile operator in Indonesia, and First Media
(KBLV), one of the biggest fixed broadband providers. A similar case could also be seen in
developed economies, in which entertainment-related stocks, such as Activision and Netflix,
rose during the pandemic.
Figure 72. Share prices of entertainment-related stocks in the
Figure 71. Share prices of TLKM & KBLV
US
(Jan 2, 2020-=100) (Jan 2, 2020-=100)
140 TLKM 140 Netflix
Activision Blizzard
130 KBLV
Take-Two Interactive Software
130
120
120
110
100 110
90
100
80
90
70
60 80
1/02 1/11 1/20 1/29 2/07 2/16 2/25 3/05 3/14 3/23 4/01 4/10 4/19 1/02 1/11 1/20 1/29 2/07 2/16 2/25 3/05 3/14 3/23 4/01 4/10 4/19
Source: Bloomberg, Mirae Asset Sekuritas Indonesia Research Source: Bloomberg, Mirae Asset Sekuritas Indonesia Research
Mirae Asset Sekuritas Indonesia Research 25April 30, 2020 Economic Outlook 2020
Over the years, the contribution of “Information & Communication” towards Indonesia’s
GDP has been rising considerably. Back in 2010, the industry only contributed 3.7% to
Indonesia’s GDP; in 2019, the figure rose to 5.4%. Low prices of data as a result of ongoing
price war between telecommunication providers, higher smartphone penetration, and the
presence of online-based transportation and food delivery services, such as Gojek and Grab,
have played a crucial part in placing “Information & Communication” as the sixth biggest
industry in Indonesia’s economy.
Figure 73. “Information & Communication” contribution to
Figure 74. Data subscribers in Indonesia
GDP
(IDR tr) (%) (data subscribers) TLKM EXCL ISAT
700 5.5 160,000
Information & Communication (L)
600 Shares to total GDP (R) 140,000
5.0 120,000
500
100,000
400
4.5 80,000
300
60,000
200
4.0 40,000
100
20,000
0 3.5 0
2010 2011 2012 2013 2014 2015 2016 2017 2018 2019 3Q14 3Q15 3Q16 3Q17 3Q18 3Q19
Source: Statistics Indonesia, Mirae Asset Sekuritas Indonesia Research Source: Company data, Mirae Asset Sekuritas Indonesia Research
Another industry that we expect to record higher growth in 2020 is “Health & Social Work”,
considering the higher budget allocated by the government for healthcare-related
infrastructure (IDR75tr). Furthermore, the outbreak of COVID-19 in Indonesia could be the
beginning of a new trend, namely an online-based health consultation.
Figure 75. halodoc Figure 76. GrabHealth x Good Doctor
Source: halodoc, Mirae Asset Sekuritas Indonesia Research Source: Grab, Mirae Asset Sekuritas Indonesia Research
Mirae Asset Sekuritas Indonesia Research 26You can also read