HIV Nef and Antiretroviral Therapy Have an Inhibitory Effect on Autophagy in Human Astrocytes that May Contribute to HIV-Associated Neurocognitive ...
←
→
Page content transcription
If your browser does not render page correctly, please read the page content below
cells
Article
HIV Nef and Antiretroviral Therapy Have an
Inhibitory Effect on Autophagy in Human Astrocytes
that May Contribute to HIV-Associated
Neurocognitive Disorders
Laura Cheney 1, * , Hillary Guzik 2 , Frank P. Macaluso 2,3 , Fernando Macian 4 ,
Ana Maria Cuervo 5 and Joan W. Berman 4
 1    Department of Medicine, Division of Infectious Diseases, Montefiore Medical Center and Albert
      Einstein College of Medicine, 1300 Morris Park Ave, Bronx, NY 10461, USA
 2    Analytical Imaging Facility, Montefiore Medical Center and Albert Einstein College of Medicine,
      1300 Morris Park Ave, Bronx, NY 10461, USA; hillary.guzik@einsteinmed.org (H.G.);
      frank.macaluso@einsteinmed.org (F.P.M.)
 3    Department of Anatomy and Structural Biology, Montefiore Medical Center and Albert Einstein College of
      Medicine, 1300 Morris Park Ave, Bronx, NY 10461, USA
 4    Department of Pathology, Montefiore Medical Center and Albert Einstein College of Medicine,
      1300 Morris Park Ave, Bronx, NY 10461, USA; fernando.macian@einsteinmed.org (F.M.);
      joan.berman@einsteinmed.org (J.W.B.)
 5    Department of Developmental and Molecular Biology, Montefiore Medical Center and Albert
      Einstein College of Medicine, 1300 Morris Park Ave, Bronx, NY 10461, USA;
      ana-maria.cuervo@einsteinmed.org
 *    Correspondence: lcheney@montefiore.org

 Received: 25 February 2020; Accepted: 5 June 2020; Published: 9 June 2020

 Abstract: A significant number of people living with HIV (PLWH) develop HIV-associated
 neurocognitive disorders (HAND) despite highly effective antiretroviral therapy (ART). Dysregulated
 macroautophagy (autophagy) is implicated in HAND pathogenesis. The viral protein Nef, expressed
 even with suppressive ART, and certain antiretrovirals affect autophagy in non-CNS cells. Astrocytes,
 vital for CNS microenvironment homeostasis and neuronal health, require autophagy for their
 own homeostasis. We hypothesized that extracellular Nef and/or ART impact astrocyte autophagy,
 thus contributing to HAND. We studied in-bulk and selective autophagic flux in primary human
 astrocytes treated with extracellular Nef and/or a combination of tenofovir+emtricitabine+raltegravir
 (ART) using Western blotting, a tandem fluorescent LC3 reporter, and transmission electron
 microscopy/morphometry. We show that after 24 h treatment, Nef and ART decrease autophagosomes
 through different mechanisms. While Nef accelerates autophagosome degradation without inducing
 autophagosome formation, ART inhibits autophagosome formation. Combination Nef+ART further
 depletes autophagosomes by inducing both abnormalities. Additionally, extracellular Nef and/or
 ART inhibit lysosomal degradation of p62, indicating Nef and/or ART affect in-bulk and selective
 autophagy differently. Dysregulation of both autophagic processes is maintained after 7 days of Nef
 and/or ART treatment. Persistent autophagy dysregulation due to chronic Nef and/or ART exposure
 may ultimately result in astrocyte and neuronal dysfunction, contributing to HAND.

 Keywords: HIV-associated neurocognitive disorders; Nef; astrocytes; antiretroviral therapy;
 autophagy; LC3; p62/SQTM1

Cells 2020, 9, 1426; doi:10.3390/cells9061426                                      www.mdpi.com/journal/cells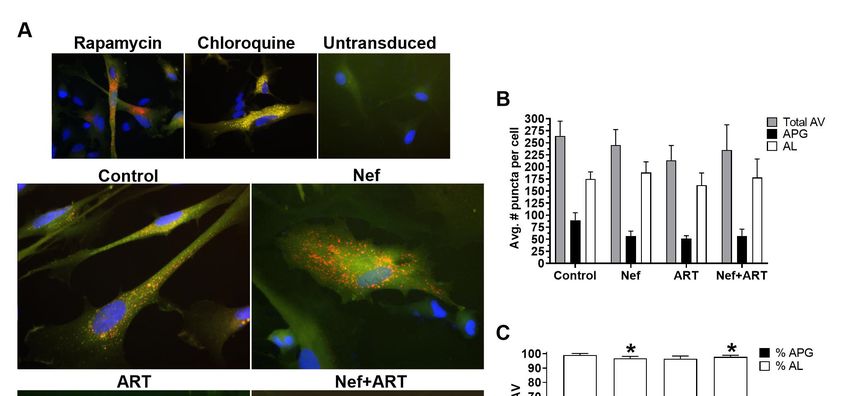
Cells 2020, 9, 1426                                                                                  2 of 25

1. Introduction
      Antiretroviral therapy (ART) has dramatically improved the lifespan of people living with Human
Immunodeficiency Virus (PLWH). The population of PLWH, however, is developing a variety of
age-related comorbidities at an accelerated rate relative to those without HIV infection. One such
comorbidity is HIV-associated neurocognitive disorders (HAND). HAND is a spectrum of behavioral,
psychomotor, and cognitive abnormalities, ranging from subclinical cognitive dysfunction to frank
dementia. Although ART has changed the landscape of cognitive dysfunction from a predominance of
dementia to mainly milder forms of deficits, HAND still affects 15–55% of people despite virologic
control with ART [1–6]. HAND is highly burdensome. Compared to PLWH without HAND,
PLWH with cognitive deficits have lower quality of life, with difficulties in interpersonal functioning,
employment, and medication adherence [7–10]. HAND is an independent risk factor for mortality
even in the current ART era [11–13]. Understanding HAND pathogenesis, which is incompletely
characterized, is key to developing specific treatments to mitigate this serious comorbid condition of
HIV infection.
      Astrocytes are the most abundant cell type in the brain. They serve numerous functions
in CNS physiology, globally for structure and blood–brain barrier integrity, nervous system
repair, and immunity, and also in the neuronal microenvironment by supplying energy substrates,
recycling neurotransmitters, protecting against reactive oxygen species (ROS), and balancing pH [14].
Astrocytes are believed to be infected with HIV at a low level [15–21], serving as one of the CNS
reservoirs for HIV, among macrophages and microglia. Reservoirs are not eliminated by ART.
      The inability to eradicate viral reservoirs results in ongoing cell exposure to toxic viral proteins,
including HIV Nef. Nef is a small protein without enzymatic activity that impacts many cell processes
by interacting with a multitude of cell proteins. It is expressed extracellularly by infected cells even
in the presence of suppressive ART, including by astrocytes, and extracellular Nef, by action at the cell
surface or by entering into neighboring cells, causes altered functioning, cell injury, and death [22–32].
Intracellular and extracellular Nef are believed to contribute to the development of HAND. For example,
its detection in astrocytes correlates with dementia in people who had Acquired Immunodeficiency
Syndrome (AIDS) [17]. Rats transplanted with Nef-expressing astrocytes experience neuronal loss,
and spatial and object recognition deficits [33]. Exogenous Nef is toxic to neurons in culture [34],
and Nef-expressing neurons undergo axonal and neurite degeneration [28]. Human brain microvascular
endothelial cells undergo apoptosis when exposed to extracellular Nef [35].
      That HIV establishes reservoirs also necessitates lifelong treatment with antiretroviral compounds,
which themselves can disrupt CNS cell homeostasis. Tenofovir and emtricitabine, nucleoside reverse
transcriptase inhibitors that comprise the backbone of most current ART regimens, decrease human
astrocyte proliferation and increase expression of cell cycle inhibitor p21, features consistent with cell
senescence [36]. Lopinavir, a protease inhibitor, disrupts glutamatergic signaling in and uptake by
human astrocytes [37]. Emtricitabine and lopinavir impair astrocyte cell membrane integrity [38].
Off-target effects of ART on astrocytes possibly contribute to HAND pathogenesis, yet the neurotoxicity
of ART and that of Nef are not completely defined.
      One very important function necessary for astrocyte homeostasis that we hypothesize could be
impacted by Nef and ART, and therefore contribute to HAND, is macroautophagy, hereafter called
autophagy. Autophagy is a highly regulated process by which organelles and macromolecules are
degraded in lysosomes as part of cellular quality control [39]. Autophagy is initiated by the formation
of a double-membrane vesicle, an autophagosome (APG), that sequesters organelles and proteins
(cargo) targeted for lysosomal degradation. Cargo can be included in the APG non-selectively, termed
“in-bulk” autophagy, in that the APG engulfs cytosolic components that are nearby [40]. It can also
be selective, whereby autophagy adapters and/or receptors bring selected cargo to the forming APG
for lysosomal degradation of specific cytosol material [40]. Once fully formed, the APG fuses with a
lysosome and the cargo inside is rapidly degraded by lysosomal proteases. The resulting catabolites are
recycled out of the lysosome as building blocks for cellular metabolism. The rate at which this process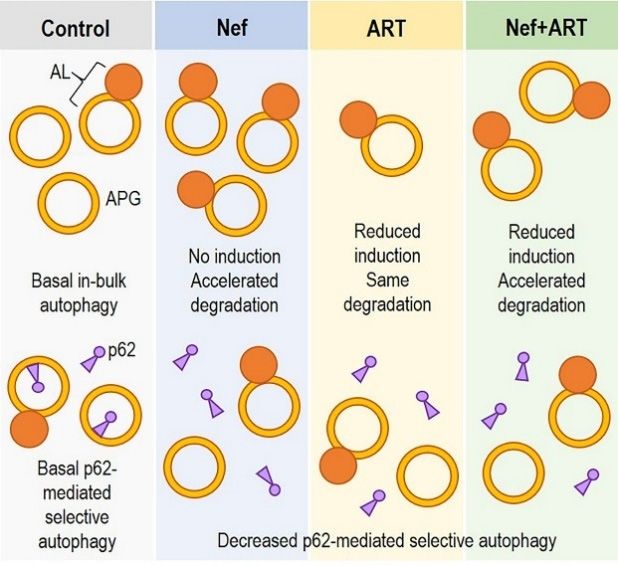
Cells 2020, 9, 1426                                                                              3 of 25

progresses from start to finish is termed autophagic flux [40]. Flux occurs constitutively, at a basal
level, for turnover of intracellular proteins and organelles, and therefore maintains cell homeostasis.
Autophagy is also induced by a variety of stimuli that perturb homeostasis, such as starvation,
oxidative stress, hypoxia, proteotoxicity, lipid insults and pathogens, among others. Balance of APG
formation with APG degradation is vital for maintenance of the cytosolic environment and proper
cargo disposal. Disruptions to autophagic activity, specifically in astrocytes, have been linked to
the pathogenesis of several neurodegenerative conditions, including Amyotrophic Lateral Sclerosis
(ALS), and Huntington’s and Parkinson’s diseases [41–46].
     Nef as well as certain antiretroviral drugs impact autophagy [47–53]. A few studies have examined
the relationship between autophagy and HIV-induced and/or ART-induced neuropathology [54–61], but
very few have examined how dysregulated autophagy in astrocytes by HIV proteins and/or ART may
contribute to HAND pathogenesis [28,62–65]. Given the significant prevalence of cognitive dysfunction
in PLWH who take ART, and the importance of autophagy to astrocyte homeostasis, we propose
that extracellular Nef and ART impact autophagy in astrocytes, contributing to neurodegeneration
and HAND. Therefore, we studied the effects of Nef, a common ART regimen, and Nef and ART
together on autophagy in primary human astrocytes. Our results show that Nef and/or ART induce
imbalance in autophagy. Specifically, Nef accelerates APG degradation without inducing APG
formation. ART inhibits APG biogenesis without decreasing degradation, and Nef+ART induce
both changes in autophagy. We also show that Nef and/or ART inhibit lysosomal degradation of
p62/SQTM1, which indicates that they also affect selective autophagy. These findings demonstrate a
novel mechanism by which HIV, and its treatment, may contribute to neurodegeneration and cognitive
dysfunction in PLWH.

2. Materials and Methods

2.1. Cells and Treatments
     Primary human astrocytes were isolated as previously described [66]. Several different astrocyte
lineages were used for experiments. Cells were maintained in Dulbecco’s Modified Eagle Medium
(DMEM), supplemented with 10% fetal bovine serum (FBS) and 5% penicillin/streptomycin at 37 ◦ C
with 5% CO2 atmosphere. Confluent astrocytes were treated with 100 ng/mL HIV Nef (HIV-1 ARMA029
Nef Recombinant Protein, NIH AIDS Reagent Program), and/or with 5 ng/mL tenofovir + 109 ng/mL
emtricitabine + 14.5 ng/mL raltegravir (ART) for the indicated durations. The antiretroviral
concentrations are consistent with average drug levels achieved in human cerebral spinal fluid
(CSF) [67]. Antiretroviral compounds were obtained through the NIH AIDS Reagent Program, Division
of AIDS, NIAID, NIH as follows: tenofovir (Cat# 10199); emtricitabine (Cat# 10071); and raltegravir
(Cat# 11680). Nef and all three antiretrovirals were resuspended in water, and aliquots of stock
concentrations were stored at −80 and −20 ◦ C, respectively. Media were aspirated and replaced with
fresh DMEM prior to the start of all treatments. For treatments lasting 7 days, media were changed
every 4 days, with treatments added daily.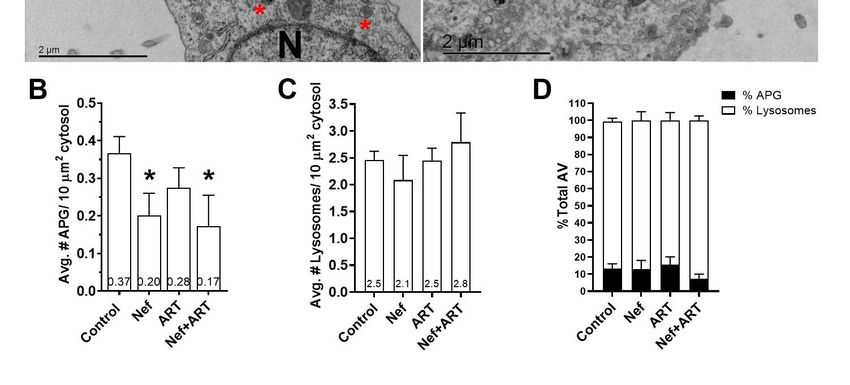
Cells 2020, 9, 1426                                                                                  4 of 25

2.2. Western Blotting
      Astrocytes were treated with Nef and/or ART for 24 h or daily for 7 days. Untreated cells were used
as control. 30–70 µM chloroquine (CQ) were added to some of the samples for the last 2 or 4 h of treatment
to inhibit lysosome degradation and assess autophagic flux [68,69]. At treatment completion, cells
were washed with ice-cold PBS, and then lysed with Radioimmunoprecipitation Assay (RIPA) buffer
containing 1× Halt Protease Inhibitor and Phosphatase Inhibitor Cocktail (Thermo Fisher Scientific).
Protein concentration was determined by the Bradford method with Protein Assay Reagent Concentrate
(Bio-Rad). Equal amounts of protein were resolved by sodium dodecyl sulfate poly-acrylamide gel
electrophoresis (SDS-PAGE) under reducing conditions, followed by transfer overnight at 4 ◦ C to
activated poly-vinylidene difluoride (PVDF) membranes. Revert Total Protein Stain (Li-Cor) was
used to determine total protein optical density (O.D.) following transfer, using the very sensitive
Odyssey Fc System (Li-Cor) for visualization, and Image Studio v. 5.2 software (Li-Cor) for O.D.
measurement. Membranes were blocked in 5% non-fat dry milk in 1× TBS plus 0.1% Tween-20
prior to overnight incubation at 4 ◦ C with rabbit anti-LC3 (Cell Signal #2775) or with rabbit anti-p62
(Enzo BML-PW9860) at dilutions of 1:1000. HRP-conjugated goat anti-rabbit antibody (Cell Signal #7074)
was used as the secondary antibody for both LC3-II and p62 blots, also at 1:1000 dilution. Blots were
developed using 1:1 Super Signal West Femto Chemiluminescent Substrate and Luminol/Enhancer
(Thermo Fisher Scientific), and visualized and analyzed the same as for total protein. Primary human
cells are inherently variable. To address this variability, LC3-II and p62 O.D. were normalized with
two approaches. First, LC3-II and p62 were normalized to total protein O.D. We normalized to total
protein because it is an accurate representation of global protein expression within the cell, compared
to protein products of housekeeping genes such as GAPDH or actin, which are degraded by lysosomal
and non-lysosomal mechanisms, and could thereby skew the normalization of LC3-II or p62 [68].
Second, we normalized LC3-II and p62 to a select 25 kDa band on the total protein stain. This band did
not vary by more than 10% across all lanes on 6 different blots, suggesting that the proteins in this region
were not significantly impacted by our treatments or changes in autophagy. This band was then used to
normalize LC3-II and p62 for all blots. 150 LC3-II values normalized to total protein were then randomly
selected for statistical comparison to the corresponding LC3-II values normalized to the 25 kDa band.
To determine changes in autophagic flux, LC3-II was analyzed four ways, as suggested in [68,69].
First, the LC3-II level (steady state) was determined as the amount of normalized LC3-II in cells not
treated with CQ. Next, APG biogenesis was determined by subtracting normalized LC3-II in cells
treated with CQ for 2 h from LC3-II in cells treated with CQ for 4 h. Third, degradation rate (flux) was
determined by dividing the normalized LC3-II in cells with CQ for 4 h by the LC3-II in cells without
CQ. Fourth, degradation amount (net flux) was determined by subtracting LC3-II in cells without CQ
from LC3-II in cells treated with CQ for 4 h. Flux and net flux were determined only with 4 h CQ
inhibition. The 2 h CQ inhibition was only used for calculation of APG biogenesis. Changes in overall
cellular content (steady state) and rates of p62 degradation in lysosomes (flux, and net flux) were
determined in a similar fashion. The effect of any treatment (Nef, ART, or Nef+ART) was calculated as
a fold change relative to untreated control cells.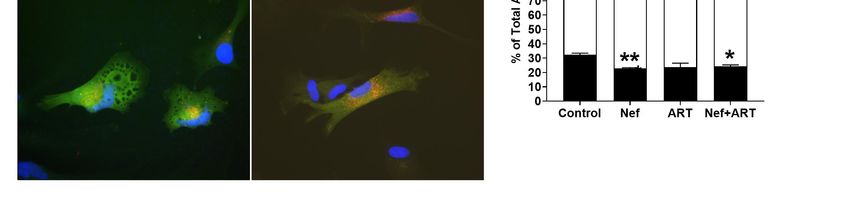
Cells 2020, 9, 1426                                                                               5 of 25

2.3. Fluorescence Microscopy
      Astrocytes were transduced in 6-well plates at a density of 2 × 10⁵ with a 1:4 dilution in cell
medium of lentivirus carrying the tandem mCherry–GFP–LC3 construct [70]. Transduced cells were
allowed to express the dual fluorescent LC3 protein for 23 days prior to transfer to 12 mm poly-d-lysine
coated glass coverslips (Corning). Once adhered, cells were treated with Nef and/or ART for 24 h.
One additional set of cells was treated for 16 h with 2.5 µM rapamycin, a known autophagy inducer,
and another set with 70 µM CQ for 4 h, an autophagy inhibitor. Although manipulation of autophagy
with rapamycin or CQ is not needed to evaluate autophagy when using the tandem fluorescent reporter,
we included these treatments as controls to show that astrocytes were appropriately responsive to
pharmacologic manipulation. Transduced untreated, and untransduced untreated cells also served
as controls. After treatments, cells were fixed in 4% Paraformaldehyde/PBS for 20 min, washed
twice with cold PBS, and then mounted onto glass slides with Prolong Diamond Mountant with
40 ,6-diamidino-2-phenylindole (DAPI) (Invitrogen). Three independent experiments were performed.
In total, 6080 non-saturated images of individual cells for each treatment condition and control from
each of the three experiments were taken using the 63x oil objective 1.4 na, on the Zeiss AxioObserver
microscope (Zeiss). Images were analyzed using Volocity Quantitation software (Quorum Technologies).
Briefly, the average number of red and green puncta per cell was quantified in the cytosol using
the measure object algorithm after establishing appropriate fluorescent thresholds for puncta detection
for each individual experiment. Quantification of the total number of red puncta was used to determine
the total number of autophagic vesicles (AV = APG + AL). Puncta positive for both fluorophores
correspond to APG, whereas those positive only for mCherry correspond to AL. Images were captured
and analyzed in a blinded fashion. Puncta were counted in untransduced cells using the same
threshold algorithm determined for each experiment. There were negligible numbers of puncta
in untransduced cells.

2.4. Transmission Electron Microscopy
     Cells were treated with Nef and/or ART for 24 h. Untreated cells were used as control.
After treatment, cell monolayers were fixed with 2.5% glutaraldehyde in 0.1 M sodium cacodylate
buffer, post-fixed with 1% osmium tetroxide followed by 2% uranyl acetate, then dehydrated through
a graded series of ethanol. Cells were lifted with propylene oxide and embedded as a loose pellet
in LX112 resin (LADD Research Industries). Ultrathin sections were cut on a Leica UC7 ultramicrotome,
and stained with uranyl acetate followed by lead citrate. Images were captured on a JEOL 1400 Plus
transmission electron microscope at 120 kv. Two independent experiments were performed, and twelve
to eighteen images per treatment condition were obtained. A priori defined criteria for organelle
scoring [71–73] were applied to each image to determine the number of APG and total lysosomes
per µm2 cytosol, which was determined using Adobe Photoshop (Adobe), discounting the area of
the nucleus when present in an image. Images were captured and analyzed in a blinded fashion.

2.5. qRT-PCR
     Cells were treated for 8 or 24 h, or daily for 7 days with Nef and/or ART. Untreated cells were
used as control. At treatment completion, cells were washed in ice-cold PBS, and total RNA isolated
with Trizol reagent, according to the manufacturer’s protocol (Thermo Fisher Scientific), including
the chloroform extraction step. RNA was eluted in RNase free water (Ambion) and stored at −80 ◦ C.
RNA was quantified using a NanoDrop 2000 Spectrophotometer (Thermo Fisher Scientific). 2 µg RNA
were reverse transcribed into cDNA using SuperScript Vilo Master Mix (Invitrogen), according to
the manufacturer’s protocol, and cDNA was stored at −20 ◦ C if not used immediately for qRT-PCR.
Taqman Gene Expression Assays for human 18S and p62 (Applied Biosystems) were performed using
Taqman Gene Expression Master Mix on a StepOne Plus Real-Time PCR system (Applied Biosystems).
PCR cycling conditions were as recommended for Taqman Assays. The relative quantity of p62 mRNA
Cells 2020, 9, 1426 6 of 25
in treated cells was calculated using the 2−∆∆Ct method relative to the same mRNA in control cells,
with 18S serving as the reference gene for treated and control cells.
2.6. Statistical Analysis
Data were analyzed using GraphPad Prism software v. 8.4.2 (GraphPad). Data were tested
for normality using the D’Agostino and Pearson normality test. Paired T-tests were used to
compare LC3-II or p62 values normalized to total protein to the corresponding LC3-II or p62
numbers normalized to the 25 kDa band. For this specific test, a value of p < 0.1 was considered
significant. When normally distributed, experimental treatments were compared to controls by T-test,
and the Wilcoxon Matched-Pairs Signed Rank test when not normally distributed. For fold-change
analyses, One-Sample T-tests were used for normally distributed data, and the Wilcoxon Signed
Rank test was used for data not normally distributed. Comparisons were made between treatment
and control, which was set to a theoretical mean of 1. Values of p < 0.05 were considered significant.
3. Results
3.1. Nef and/or ART Imbalance Autophagy
Nef is produced by infected cells, and present in the extracellular space, even when
viremia is suppressed by ART [22–28]. Extracellular Nef can alter cell function [23,26,28–32].
Autophagy alterations are increasingly recognized as a contributing factor of HAND, yet little
is understood regarding the impact of extracellular Nef and/or ART on autophagy in astrocytes,
an essential cellular process of which dysregulation is linked to neurodegeneration. To address this,
we performed Western blotting for the well-established APG marker, LC3-II. LC3 undergoes cleavage
and conjugation to phosphatidylethanolamine to form LC3-II, which is required for autophagosome
formation. LC3-II associates with both sides of the APG membrane, and the fraction of LC3-II on
the inner APG membrane is degraded when the APG fuses with the lysosome. To determine APG
biogenesis, and also rate and amount of APG degradation, we measured changes in LC3-II levels
between cells treated or not with chloroquine (CQ) to inhibit lysosome degradation, as described
in Methods and elsewhere [68,69]. We show data resulting from normalization to total protein. There
was no significant difference between LC3-II normalized to total protein relative to LC3-II normalized
to the 25 kDa band (p = 0.15; Figure S1).
Treatment with Nef for 24 h without CQ resulted in a significant 35% decrease in mean LC3-II
steady-state level compared to control (Figure 1A,B; p < 0.05), with a mean 0.42-fold reduction (Figure 1F;
p < 0.05). This decrease could be due to decreased APG biogenesis and/or increased APG degradation.
Western blot analyses comparing LC3-II at two different points after addition of CQ demonstrated no
differences in APG biogenesis, measured as the difference in LC3-II levels between 4 h and 2 h of CQ
treatment (Figure 1A,C). Instead, we observed that the decrease in LC3-II was due to accelerated APG
clearance (flux) (Figure 1A,D,E) as Nef significantly accelerated autophagic flux (Figure 1A,D; p < 0.05),
2.3-fold above control (Figure 2F; p < 0.05). Despite this increase in autophagic flux, we observed
that the total amount of APG degraded (net flux) after Nef treatment was not different from control
(mean 69.5 compared to control mean of 63.82, Figure 1A,D, or 1.1-fold that of control, Figure 1F).
This further supports that the reduction in LC3-II was due to accelerated degradation without changes
in APG formation. These data indicate that Nef increased efficiency of APG degradation but not
the overall amount of degradation by autophagy since it was not associated with an accompanying
induction of APG formation.Cells 2020, 9,
Cells 2020, 9, 1426
x FOR PEER REVIEW 77 of
of 25
25
Figure 1. LC3-II steady-state level, autophagosome (APG) biogenesis and APG degradation after
Figure
treatment 1. with
LC3-II
Nefsteady-state level, autophagosome
and/or antiretroviral therapy (ART) (APG)for 24 h.biogenesis
Primary humanand APG degradation
astrocytes after
were treated
treatment with Nef and/or antiretroviral therapy (ART) for 24 h. Primary
daily for 7 days with extracellular Nef and/or ART, without and with chloroquine (CQ) for the last human astrocytes were
treated
2 or 4 h,daily for 7LC3
and then daysWestern
with extracellular
blotting was Nef and/or ART,
performed. without and
Steady-state with
level, chloroquine
biogenesis, flux(CQ) for
and net
the
fluxlast 2 or 4 h,
for LC3-II andcalculated
were then LC3asWestern
described blotting was performed.
in Methods. Steady-state level,
(A,G,M) Representative LC3-IIbiogenesis, flux
Western blots
and
afternet flux G.
A. Nef, forART,
LC3-II were
or M. calculated
Nef+ART as described
treatment. B–E, H–K,in Methods.
and N–Q (A,G,M) Representative
show individual LC3-II
experiments
(dots)
Western andblots
the means
after A.ofNef,
the experiments
G. ART, or M. (bars). (B,H,N)
Nef+ART LC3-II steady-state
treatment. B–E, H–K, and levelN–Q
in control
show and B. Nef,
individual
H. ART, or N.(dots)
experiments Nef+ART
and thetreated
means astrocytes. (C,I,O) APG
of the experiments biogenesis
(bars). (B,H,N) in LC3-II
controlsteady-state
and C. Nef,level
I. ART,
in
or O. Nef+ART
control and B. Nef,treated cells.or(D,J,P)
H. ART, Rate oftreated
N. Nef+ART APG degradation
astrocytes. (C,I,O)(Flux)APGin control and D.
biogenesis in Nef, J. ART,
control and
P. Nef+ART
C. Nef, I. ART, treated
or O.astrocytes. (E,K,Q)cells.
Nef+ART treated Amount of Rate
(D,J,P) APGof degradation
APG degradation(net flux) in control
(Flux) and and
in control E. Nef,
D.
K. ART,
Nef, or Q.P.Nef+ART
J. ART, Nef+ARTtreated
treatedcells. (F,L,R)(E,K,Q)
astrocytes. show the fold changes
Amount of APG ofdegradation
the same autophagy
(net flux)parameters
in control
afterE.treatment
and withorF.Q.
Nef, K. ART, Nef, L. ART,treated
Nef+ART and R.cells.
Nef+ART
(F,L,R)overshow controls
the foldofchanges
individual
of theexperiments (dots)
same autophagy
and the means
parameters of the
after fold changes
treatment with F. of Nef,
the experiments
L. ART, and (bars). Controls were
R. Nef+ART over set to 1, represented
controls of individualby
the dashed lines.
experiments (dots)Error
andbars
the depict
means SD. n =fold
of the 7–11; *, p < 0.05;
changes of the p < 0.005 by the
**, experiments Wilcoxon
(bars). ControlsMatched-Pairs
were set to
Signed
1, Rank test
represented byorthe
thedashed
Wilcoxon Signed
lines. ErrorRankbarstest.
depict SD. n = 7–11; *, p < 0.05; **, p < 0.005 by the
Wilcoxon Matched-Pairs Signed Rank test or the Wilcoxon Signed Rank test.
3.2. Nef Alone or in Combination with ART Accelerates APG Maturation in Astrocytes
Our Western blot analysis demonstrated that distinct steps in autophagy were dysregulated by
Nef and ART. To validate our Western blot findings, and gain additional information on the changes
in the autophagic system, astrocytes were transduced with lentivirus carrying a tandem fluorescent-
tagged LC3 (mCherry–GFP–LC3) [70] and then treated with Nef and/or ART, imaged, and puncta
quantified as described in Methods. The degree of autophagic flux is reflected by the ratio of yellow
and red fluorescent puncta. APG are detected as yellow fluorescent puncta (mCherry+GFP+) due toCells 2020,
Cells 9, 9,
2020, 1426
x FOR PEER REVIEW 98 of
of 25
25
Figure 2. Autophagic vesicles (AV) after treatment with Nef and/or ART. Primary human astrocytes were
Figure 2. Autophagic vesicles (AV) after treatment with Nef and/or ART. Primary human astrocytes
transduced with a lentivirus expressing the mCherry–GFP–LC3 autophagy reporter, and treated with
were transduced with a lentivirus expressing the mCherry–GFP–LC3 autophagy reporter, and treated
rapamycin for 16 h, chloroquine for 4 h, or with extracellular Nef and/or ART for 24 h. Red and green
with rapamycin for 16 h, chloroquine for 4 h, or with extracellular Nef and/or ART for 24 h. Red and
puncta were analyzed as described in Methods. (A) Representative images from transduced and treated
green puncta were analyzed as described in Methods. (A) Representative images from transduced
cells, and untransduced cells. (B) The mean number of puncta per cell in control, Nef, ART, and Nef+ART
and treated cells, and untransduced cells. (B) The mean number of puncta per cell in control, Nef,
treated cells. (C) Mean percent APG and AL of total AV in control, Nef, ART, and Nef+ART treated cells.
ART, and Nef+ART treated cells. (C) Mean percent APG and AL of total AV in control, Nef, ART, and
Error bars represent SEM. n = 3 independent experiments, with a total of 189–229 cells per condition
Nef+ART treated cells. Error bars represent SEM. n = 3 independent experiments, with a total of 189–
analyzed; *, p < 0.05; **, p < 0.005 by the Wilcoxon Matched-Pairs Signed Rank test.
229 cells per condition analyzed; *, p < 0.05; **, p < 0.005 by the Wilcoxon Matched-Pairs Signed Rank
test.
We performed similar studies with ART. Treatment with ART for 24 h also resulted in a significant
47% decrease in LC3-II steady-state level relative to control (Figure 1G,H; p < 0.05; or 0.46-fold that of
3.3. Nef and/or ART Decrease the Number of APG in Human Astrocytes
control, Figure 1L; p < 0.005). This decrease, unlike for Nef, which caused accelerated degradation,
was dueToto obtain further
a significant 60% information
decrease in APG on biogenesis
possible (Figure
effects 1G,I;
of pNef < 0.05;
and/or ART less
or 0.36-fold on thanthe
control; p < 0.05). With biogenesis
autophagic/lysosomal system, we used transmission
significantly reduced, we electron microscopy
anticipated a decreased and amount
morphometric
of APG
analyses on(net
degradation primary
flux).astrocytes
That is, if treated
there areforsubstantially
24 h with Nef and/or
fewer APGART. We did
formed, thisnot use
will an to
lead inhibitor
less APG of
lysosomal
maturing intodegradation to halt the
AL. In agreement withdynamic
decreased autophagic process,
biogenesis, in order
we found to capture
a trend towardsareduced
snapshotnet of flux
the
after ART treatment relative to control (mean 55.9 compared to control mean of 66.9, Figure 1G,K; as
steady-state of autophagy compartments after treatments. We scored images for numbers of APG or
well
10% asthan
less for control,
numbersFigure
of lysosomes. Figure 3A decreased
1L), thus suggesting provides an exampleafter
biogenesis APG ART and an autolysosome,
treatment. Similar to
identified
Nef, by the apresence
we observed of degrading
trend towards cytosolic
accelerated material,
LC3-II and representative
degradation rate (flux) thatimages
was from
134%control
higher
and Nef and/or ART treated cells. Analyses showed that treatment with Nef and Nef+ART
in ART-treated than in control cells (Figure 1J; 1.9-fold over control, Figure 1L). This average was driven for 24 h
caused a significant reduction in the mean number of APG per 10µm 2 cytosol (46% and 54%,
upwards by a group that demonstrated a striking increase in the fold change in flux relative to control
respectively,
(3.2-fold increase,Figure 3A,B;
n = 5, p < 1L).
Figure 0.05). ART
This also
is in decreased
contrast the mean
to another number
group of APG
in which per 10µm
the fold changecytosol
2
in flux
to 24% of control (Figure 3B), although not significantly. The numbers of
was not changed relative to control (mean 0.88-fold, n = 6, Figure 1L). These data demonstrate that ARTlysosomes are not
significantly different than control (Figure 3C), but it is important to note that all types of lysosomes
consistently inhibited APG biogenesis, but there is a variable response to the drugs with regards to
were included in the analysis, since AL resulting from autophagy cannot be differentiated from other
APG clearance. It is possible that individuals may have different capacity for degradation in presence
subtypes of lysosomes on the basis of morphological criteria alone. There was a 44% decrease in
of antiretroviral drugs.
percent APG, and 107% increase in lysosomes after Nef+ART treatment (Figure 3D). This snapshot is
consistent with our biochemical analyses, confirming the reduction in APG and accelerated
maturation of APG into AL after treatments.Cells 2020, 9, 1426 9 of 25
Concomitant treatment with Nef and ART for 24 h resulted in effects on biogenesis and degradation
similar to the sum of the affects shown after individual treatments with Nef or ART. Specifically,
Nef+ART treatment caused a significant 32% decrease in LC3-II steady-state level relative to control
(Figure 1M,N; p < 0.05), or mean 0.5-fold less than control (Figure 1R; p < 0.005). This decrease
was a consequence of the 38% reduction in APG biogenesis (Figure 1M,O), and a 3-fold acceleration
of APG degradation (flux) over control (Figure 1P,R; p < 0.005). As expected from the reduced
biogenesis and accelerated clearance, the net flux was 28% decreased in cells exposed to Nef+ART
(Figure 1Q). These indicate that Nef+ART resulted in both decreased APG biogenesis and accelerated
APG degradation. These data suggest an imbalance in astrocyte autophagy with short-term exposure
to Nef or ART which is accentuated when Nef and ART are combined.
3.2. Nef Alone or in Combination with ART Accelerates APG Maturation in Astrocytes
Our Western blot analysis demonstrated that distinct steps in autophagy were dysregulated
by Nef and ART. To validate our Western blot findings, and gain additional information on
the changes in the autophagic system, astrocytes were transduced with lentivirus carrying a tandem
fluorescent-tagged LC3 (mCherry–GFP–LC3) [70] and then treated with Nef and/or ART, imaged,
and puncta quantified as described in Methods. The degree of autophagic flux is reflected by the ratio
of yellow and red fluorescent puncta. APG are detected as yellow fluorescent puncta (mCherry+ GFP+ )
due to colocalization of mCherry and GFP fluorescence, both present in the tagged LC3. When the APG
fuses with the lysosome, creating an autolysosome (AL), the GFP fluorescence is quenched by the acidic
lysosomal environment, so that AL appear as are red only puncta (mCherry+ GFP− ). Under normal
conditions, the number of APG (yellow puncta) at any given time is relatively low, since once formed
they rapidly mature into AL (red only puncta). In contrast, a block in APG maturation would manifest
as increased yellow puncta with decreased red-only puncta.
An advantage of this image-based approach is that it does not require use of chemical degradation
inhibitors to estimate flux. However, we included treatments with rapamycin, to induce autophagy,
and chloroquine, to inhibit degradation, as controls to show that astrocytes were appropriately
responsive to pharmacologic manipulation of flux. As seen in Figure 2A, transduced astrocytes
treated with rapamycin had a striking increase in red puncta compared to untreated control, indicating
increased APG maturation into AL, as expected in the presence of an autophagy inducer. This is
in contrast to chloroquine treatment, which demonstrated only yellow puncta (Figure 2A), as well as an
apparent increase in the total number of puncta compared to untreated control. This was also expected
because chloroquine dissipates lysosomal pH and prevents GFP quenching such that autophagic
vesicles (AV) will accumulate but not degrade. Untransduced cells displayed no puncta (Figure 2A).
Untreated astrocytes had about 30% APG and 70% AL (Figure 2A,C), reflecting their basal level of
fully functional autophagic flux.Cells 2020, 9, 1426 10 of 25
Astrocytes treated with Nef (Figure 2A) displayed a 37% lower mean number of APG per cell,
and a 108% increase in AL, relative to control, respectively (Figure 2B). The decrease in APG was a
result of faster maturation into AL, as shown by analyses of the percent of APG and AL that comprise
the total AV. Nef significantly decreased the percent APG relative to control (23% compared to 32%,
Figure 2C; p < 0.005), and increased percent AL (74% compared to control 66%, Figure 2C; (p < 0.05),
reflecting an accelerated maturation of APG toward AL after Nef. These data show that Nef increased
APG maturation to AL but did not induce APG biogenesis, agreeing with the Western blot data.
Treatment with ART caused a mean 20% reduction in total autophagic vesicles compared to
control cells (Figure 2A,B). This reduction was due to a decrease in both APG and AL relative to control
(42% and 7%, respectively, Figure 2B). Additionally, the percent APG comprising total AV was 7%
lower than control (Figure 2C), although not significant. These indicate decreased total AV, confirming
an inhibitory effect of ART on autophagy at the level of induction/ biogenesis, with less effects on
maturation, which are both supportive of our Western blot data.
Concomitant treatment with Nef and ART reduced the number of total AV and accelerated
maturation of APG into AL. There was an 11% decrease in total AV after Nef+ART treatment
relative to control (Figure 2A,B), with APG comprising 24% and AL comprising 74% of total AV
(Figure 2C). This is significantly decreased and increased, compared to control with 32.4% and 66.6%,
respectively (Figure 2C; p < 0.005 and p < 0.05). These data indicate that Nef+ART decreased autophagy
induction/APG biogenesis and accelerated maturation of already formed APG into AL, supporting
the dual effects seen by Western blotting.
3.3. Nef and/or ART Decrease the Number of APG in Human Astrocytes
To obtain further information on possible effects of Nef and/or ART on the autophagic/lysosomal
system, we used transmission electron microscopy and morphometric analyses on primary astrocytes
treated for 24 h with Nef and/or ART. We did not use an inhibitor of lysosomal degradation to halt
the dynamic autophagic process, in order to capture a snapshot of the steady-state of autophagy
compartments after treatments. We scored images for numbers of APG as well as for numbers of
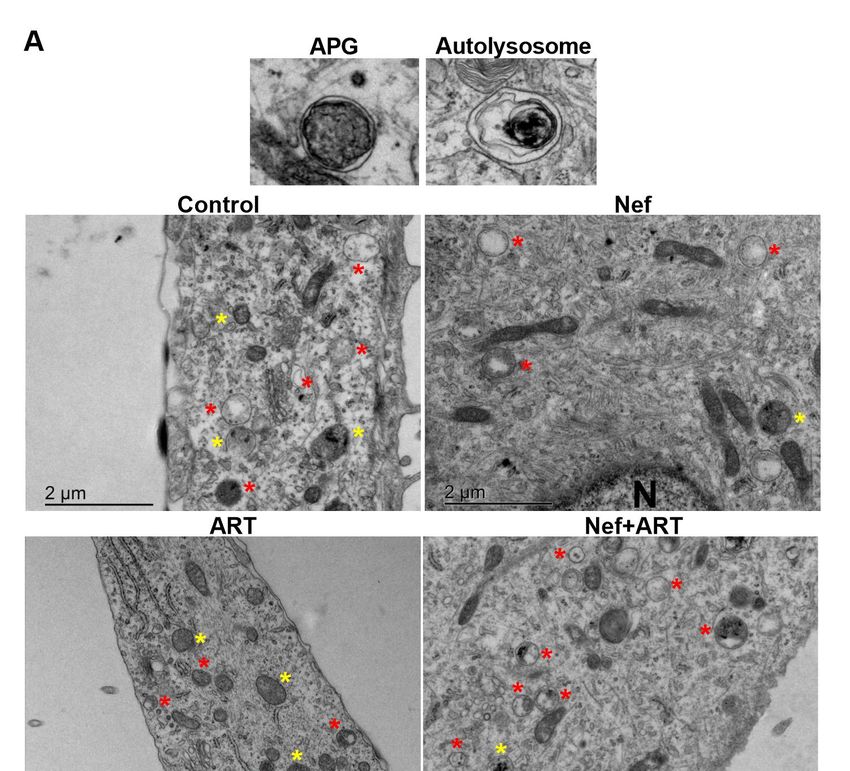
lysosomes. Figure 3A provides an example APG and an autolysosome, identified by the presence of
degrading cytosolic material, and representative images from control and Nef and/or ART treated
cells. Analyses showed that treatment with Nef and Nef+ART for 24 h caused a significant reduction
in the mean number of APG per 10µm2 cytosol (46% and 54%, respectively, Figure 3A,B; p < 0.05).
ART also decreased the mean number of APG per 10µm2 cytosol to 24% of control (Figure 3B),
although not significantly. The numbers of lysosomes are not significantly different than control
(Figure 3C), but it is important to note that all types of lysosomes were included in the analysis,
since AL resulting from autophagy cannot be differentiated from other subtypes of lysosomes on
the basis of morphological criteria alone. There was a 44% decrease in percent APG, and 107% increase
in lysosomes after Nef+ART treatment (Figure 3D). This snapshot is consistent with our biochemical
analyses, confirming the reduction in APG and accelerated maturation of APG into AL after treatments.Cells2020,
Cells 2020,9,9,1426
x FOR PEER REVIEW 10of
11 of25
25
Figure 3. Ultrastructural analysis of APG and lysosomes after treatment with Nef and/or ART.
Primary
Figure 3.human astrocytes analysis
Ultrastructural were treated with and
of APG extracellular
lysosomes Nefafter
and/or ART forwith
treatment 24 h Nef
and prepared for
and/or ART.
and analyzed by transmission electron microscopy as described in Methods. (A) Representative
Primary human astrocytes were treated with extracellular Nef and/or ART for 24 h and prepared for APG
and
andautolysosome, and imageselectron
analyzed by transmission of control, Nef, ART,as
microscopy and Nef+ART
described treated cells.
in Methods. (A) Yellow stars = APG;
Representative APG
red
andstars = Lysosomes;
autolysosome, = nucleus.
andNimages (B) The
of control, mean
Nef, ART,number of APG per
and Nef+ART 10 µm
treated
2 cytosol. (C) The mean
cells. Yellow stars = APG;
number
red starsof=lysosomes
Lysosomes; perN10 µm2 cytosol.
= nucleus. (D) mean
(B) The Mean number
percent APG
of APGandperlysosomes of total AV
10 µm2 cytosol. (C) in
Thecontrol,
mean
Nef, ART, and Nef+ART treated astrocytes. Error bars represent SEM. n = 2 independent
number of lysosomes per 10 µm cytosol. (D) Mean percent APG and lysosomes of total AV in control,
2 experiments,
with
Nef, aART,
totaland
of 23–27 cells treated
Nef+ART per condition analyzed.
astrocytes. *, pCells 2020, 9, 1426 12 of 25
less; p < 0.005). Degradation rate (flux) remained 120% accelerated relative to control (Figure 4A,D),
or 1.4-fold above control (Figure 4A,F; p < 0.05). At this extended time point, there was not a significant
change from control in APG biogenesis after Nef treatment (mean 19.7 compared to control mean
22.4, Figure 4A,C), nor in the amount of APG degraded (net flux) (mean 35.7 compared to control
mean 31.8, Figure 4A,E), confirming that accelerated degradation, and not reduced biogenesis, leads to
Cells 2020, 9, x FOR PEER REVIEW 12 of 25
the significantly reduced LC3-II level.
Figure 4. LC3-II steady-state level, APG biogenesis and APG degradation after treatment with Nef
Figure ART
and/or 4. LC3-II
for 7 steady-state
days. Primary level, APG
human biogenesis
astrocytes wereand APG daily
treated degradation
for 7 daysafter treatment
with with Nef
extracellular Nef
and/or ART for 7 days. Primary human astrocytes were treated daily for 7 days
and/or ART, without and with chloroquine (CQ) for the last 2 or 4 h, then LC3 Western blotting was with extracellular Nef
and/or ART, without and with chloroquine (CQ) for the last 2 or 4 h, then LC3
performed. Steady-state level, biogenesis, flux and net flux for LC3-II were calculated as described Western blotting was
performed.
in Methods.Steady-state level, biogenesis,
(A,G,M) Representative flux Western
LC3-II and net flux
blotsforafter
LC3-II
A. were
Nef, G.calculated
ART, orasM. described
Nef+ART in
Methods. (A,G,M)
treatment. B-E, H-K,Representative LC3-II Western
and N-Q show individual blots after
experiments (dots)A.andNef,
theG. ART,of or
means theM. Nef+ART
experiments
treatment.
(bars). B-E,LC3-II
(B,H,N) H-K, and N-Q show
steady-state individual
level in controlexperiments
and B. Nef, H. (dots)
ART,and the
or N. means oftreated
Nef+ART the experiments
astrocytes.
(bars). (B,H,N) LC3-II steady-state level in control and B. Nef, H. ART,
(C,I,O) APG biogenesis in control and C. Nef, I. ART, or O. Nef+ART treated cells. (D,J,P) Rate ofor N. Nef+ART treated
APG
astrocytes. (C,I,O)
degradation (Flux) APG biogenesis
in control and D.inNef,
control andP.C.Nef+ART
J. ART, Nef, I. ART, or O.astrocytes.
treated Nef+ART treated
(E,K,Q)cells.
Amount(D,J,P)
of
Rate of
APG APG degradation
degradation (net flux)(Flux) in control
in control and and D. Nef,
E. Nef, J. ART,
K. ART, or Q.P.Nef+ART
Nef+ART treated cells.astrocytes.
(F,L,R)(E,K,Q)
show
Amount
the of APGofdegradation
fold changes (net flux)
the same autophagy in controlafter
parameters and treatment
E. Nef, K.withART, or Q.L.Nef+ART
F. Nef, ART, and treated
R. Nef+ARTcells.
(F,L,R)
over show the
controls fold changes
of individual of the same
experiments autophagy
(dots) and theparameters
means of the after treatment
fold changeswith F. experiments
of the Nef, L. ART,
and R.Controls
(bars). Nef+ARTwere oversetcontrols of individual
to 1, represented by theexperiments
dashed lines.(dots) and
Error thedepict
bars meansSD. = 7–11;
of nthe *, p < 0.05;
fold changes of
**, < 0.005 by the
thep experiments (bars). Controls
Wilcoxon were set toSigned
Matched-Pairs 1, represented
Rank test byorthe
thedashed
Wilcoxonlines. ErrorRank
Signed bars depict
test. SD.
n = 7–11; *, p < 0.05; **, p < 0.005 by the Wilcoxon Matched-Pairs Signed Rank test or the Wilcoxon
After
Signed7Rank
daystest.
of daily ART, LC3-II steady-state level remained significantly 11% less relative
to control (Figure 4G,H; p < 0.005), or 0.11-fold less than control (Figure 4L; p < 0.005). This is
We do not have statistical power to compare 24 h results to 7 days results. However, we include
graphs for comparison of autophagy parameters at the two time points (Figure S2). These data
demonstrate that changes present at 24 h after Nef and/or ART remain present after 7 days of daily
treatment though the changes after 7 days is not as dramatic after 24 h.Cells 2020, 9, 1426 13 of 25
again resulting from a significant decrease in APG biogenesis (33% less than control, Figure 4G,I;
p < 0.05; or 0.32-fold less, Figure 4L; p < 0.005). Similar to the 24 h treatment, there were different
groups of response to 7 days of ART (Figure 4K,L). At this extended time point, there are three groups
present: one with increased degradation (mean 1.49-fold increase; n = 3, Figure 4L), one with no
change in degradation relative to control (mean 1.1-fold; n = 2, Figure 4L), and one with decreased
degradation relative to control (mean 0.62-fold decrease; n = 2, Figure 4L). The mean fold increase
in the high responders is not as high as the mean fold increase in the high responders after 24 h of
treatment (Figure S2). The third group with decreased flux was not detected after 24 h of treatment
(Figure 1D). These data suggest that prolonged ART exposure may lead to reduced overall autophagic
flux, with decreased biogenesis and degradation.
LC3-II steady-state level remained decreased after treatment with Nef+ART for 7 days, at 27%
less than control (Figure 4M,N), or 0.24-fold less than control (Figure 4M,R), although this was
not significant. The decreased biogenesis and increased degradation rate (flux) present after 24 h
of treatment with Nef+ART was maintained after 7 days. Biogenesis was 10% less than control
(Figure 4M,O,R), and degradation was accelerated to 187% above control (Figure 4P), or 1.6-fold
above control (Figure 4R). These data are consistent with the changes noted after 24 h of treatment
(Figure 1M–R).
We do not have statistical power to compare 24 h results to 7 days results. However, we include
graphs for comparison of autophagy parameters at the two time points (Figure S2). These data
demonstrate that changes present at 24 h after Nef and/or ART remain present after 7 days of daily
treatment though the changes after 7 days is not as dramatic after 24 h.
3.5. Nef and/or ART Compromise p62-Mediated Selective Autophagy Short and “Long Term”
Autophagosomes can engulf cytosolic components that are near to the forming autophagosome in a
non-selective manner (“in-bulk”) [40]. Autophagy can also be selective through autophagy adaptors
and/or receptors that bring specific cargo to the forming autophagosome for selective lysosomal
degradation [40,74]. P62 is a well-characterized autophagy receptor that brings ubiquitinated cargo,
among other cargo types, to the autophagosome for selective degradation by autophagy [74]. P62 is
trapped with cargo within the APG as the APG membrane closes and, consequently, degraded
in the autolysosome along with the cargo. Therefore, whereas measurement of LC3-II degradation
provides information on overall autophagy independent of its selectivity, lysosomal degradation of
p62 can be used as a surrogate to infer changes in selective autophagy [68]. To determine whether Nef
and/or ART interfere with selective autophagy, or impact only non-selective autophagy as we showed
by LC3-II analysis, we performed Western blot analysis of p62 after 24 h and 7 days of daily Nef and/or
ART treatment as described in Methods. We analyzed p62 turnover in a similar way as we assessed
LC3-II turnover to measure autophagy flux. We show data resulting from normalization to total
protein. There was no significant difference between p62 normalized to total protein relative to p62
normalized to the 25 kDa band (p = 0.62 by paired T-test; data not shown).
After 24 h of Nef treatment, there is significantly increased p62, 1.5-fold over control (Figure 5A,B;
p < 0.05). This increase is likely due to a 12% decrease in the degradation rate (flux) of p62 after Nef
treatment (Figure 5B). ART also increases p62 1.2-fold above control after 24 h of treatment. This is
also due to a 12% decrease in the rate of degradation (flux) as well as a 15% decrease in the amount of
p62 degradation (net flux), though these are not significant (Figure 5C,E). Treatment with Nef+ART
for 24 h significantly increased p62 1.8-fold over control (Figure 5E,F; p < 0.005). This increase is due
to a significant 35% decrease in p62 degradation rate (flux) (Figure 5F; p < 0.05) and a 52% decrease
in degradation amount (net flux) (Figure 5F). These data indicate that Nef and/or ART can impair p62
lysosomal degradation in astrocytes after 24 h of treatment. It is likely that the reduced formation of
APG after Nef and/or ART treatment results in the high levels of p62 in these cells.ART for 24 h significantly increased p62 1.8-fold over control (Figure 5E,F; p < 0.005). This increase is
due to a significant 35% decrease in p62 degradation rate (flux) (Figure 5F; p < 0.05) and a 52%
decrease in degradation amount (net flux) (Figure 5F). These data indicate that Nef and/or ART can
impair p62 lysosomal degradation in astrocytes after 24 h of treatment. It is likely that the reduced
Cells 2020, 9, of
formation 1426
APG after Nef and/or ART treatment results in the high levels of p62 in these cells.14 of 25
Figure 5. p62 lysosomal degradation after treatment with Nef and/or ART for 24 h. Primary human
Figure 5. p62
astrocytes lysosomal
were degradation
treated with afterNef
extracellular treatment with for
and/or ART Nef24and/or ARTand
h, without for 24 h. chloroquine
with Primary human (CQ)
astrocytes
for the last 2 or 4 h, after which p62 Western blotting was performed. Steady-state level,chloroquine
were treated with extracellular Nef and/or ART for 24 h, without and with flux and net
(CQ) the last
flux for p62 were2 or 4 h, afteras
calculated which p62 Western
described blotting
in Methods. was performed.
(A,C,E) Steady-state
Representative level,blots
p62 Western flux after
and
net flux C.
A. Nef, forART,
p62 or
were calculatedtreatment.
E. Nef+ART as described in Methods.
(B,D,F) show the (A,C,E) Representative
fold changes of autophagy p62parameters
Western blotsafter
after A.D.Nef,
B. Nef, ART,C.and
ART, or E. Nef+ART
F. Nef+ART treatmenttreatment. (B,D,F)
over control show the
of individual fold changes
experiments (dots) of
andautophagy
the means
parameters after B. Nef,
of the fold changes of theD.experiments
ART, and F.(bars).
Nef+ART treatment
Controls over
were set tocontrol of individual
1, represented by the experiments
dashed lines.
(dots)
Error and
barsthe means
depict SD.of = 7–9;
n the p < 0.05;of**,the
fold*,changes pTo confirm further that the increased amount of p62 protein after Nef and/or ART treatment was
due to decreased p62 degradation rather than to upregulation in p62 transcription, we performed
qRT-PCR after 8 or 24 h or 7 days of Nef and/or ART treatment. P62 transcription is not changed
relative to control after 8 h of treatment, nor after 7 days of daily treatment (Figure 7). After 24 h of
Cells 2020,
Nef or ART9, 1426
treatment, there is a significant decrease in p62 mRNA relative to control, 23% and1525%, of 25
respectively (Figure 7; p < 0.05). While after 24 h of Nef+ART treatment there is no overall difference
compared
(Figure 7; pto< control, 7 outafter
0.05). While of the
24 10 experiments
h of show decreased
Nef+ART treatment there is mRNA after
no overall Nef+ART
difference relative to
compared to
control
control, 7 out of the 10 experiments show decreased mRNA after Nef+ART relative to controldecreased
(Figure 7). No change in p62 mRNA after treatments relative to control, and even (Figure 7).
p62 mRNA after
No change in p62treatments
mRNA afterrelative to control,
treatments supports
relative our conclusion
to control, and eventhat Nef and/or
decreased p62ART
mRNAincrease
after
p62 level because lysosomal p62 degradation is inhibited. Thus, Nef and/or ART impair p62
treatments relative to control, supports our conclusion that Nef and/or ART increase p62 level because selective
autophagy.
lysosomal p62 degradation is inhibited. Thus, Nef and/or ART impair p62 selective autophagy.
Figure 7. p62 mRNA transcription after treatment with Nef and/or ART for 8 or 24 h or 7 days.
Figure 7. p62 mRNA transcription after treatment with Nef and/or ART for 8 or 24 h or 7 days.
Primary human astrocytes were treated with extracellular Nef and/or ART for 8 or 24 h or daily for
Primary human astrocytes were treated with extracellular Nef and/or ART for 8 or 24 h or daily for 7
7 days, and qRT-PCR was performed. Graph depicts the fold change of p62 mRNA over control of
days, and qRT-PCR was performed. Graph depicts the fold change of p62 mRNA over control of
individual experiments (dots), and the mean of all experiments (bars). Control is depicted as the dashed
individual experiments (dots), and the mean of all experiments (bars). Control is depicted as the
line 9,
Cells 2020, atx1.FOR
Error bars
PEER represent SEM. n = 5–10; **, p < 0.005; by the Wilcoxon Signed Rank test.
REVIEW 15 of 25
dashed line at 1. Error bars represent SEM. n = 5–10; **, p < 0.005; by the Wilcoxon Signed Rank test.
We do
We do not
nothave
have statistical
statistical powerpower to compare
to compare 24 h
24 h p62 p62 to
results results
7 daystop627 days p62However,
findings. findings.
However,
we includewe include
graphs for graphs for comparison
comparison of p62
of p62 changes at changes at thepoints
the two time two time
(Figure points
S3). (Figure S3).
These data
These data demonstrate that changes present at 24 h after Nef and/or ART remain present
demonstrate that changes present at 24 h after Nef and/or ART remain present after 7 days of daily after 7 days
of daily treatment.
treatment.
In summary,
In summary, ourour findings
findings show
show that
that extracellular
extracellular Nef and/or ART
Nef and/or ART induce
induce autophagy imbalance
autophagy imbalance
in astrocytes and may differently interfere with “in-bulk” and “selective” autophagy
in astrocytes and may differently interfere with “in-bulk” and “selective” autophagy (Figure 8). Over (Figure 8).
Over periods
long long periods of exposure
of exposure to extracellular
to extracellular NefNef and/or
and/or ART,
ART, this
this mayresult
may resultininastrocyte
astrocyte dysfunction
dysfunction
and loss of homeostasis, leading to neuronal dysfunction and development
and loss of homeostasis, leading to neuronal dysfunction and development of HAND. of HAND.
Schematic depicting
Figure 8. Schematic depicting in-bulk
in-bulk autophagy
autophagy dysregulation
dysregulation and inhibition of p62-medicated
selective autophagy in astrocytes after Nef and/or
and/or ART
ART treatment.
treatment.
4. Discussion
Autophagy is essential for maintaining CNS cell homeostasis, especially in long-lived cells such
as astrocytes. Autophagy not only clears damaged organelles and proteins, and protects against stress
and starvation, but is also linked to other vital cell processes such as glutamate uptake, response toCells 2020, 9, 1426 16 of 25
4. Discussion
Autophagy is essential for maintaining CNS cell homeostasis, especially in long-lived cells
such as astrocytes. Autophagy not only clears damaged organelles and proteins, and protects
against stress and starvation, but is also linked to other vital cell processes such as glutamate
uptake, response to ROS, cytokine regulation, and to apoptosis [75–80]. Autophagy dysregulation
has been identified in many neurodegenerative diseases, and may also contribute to HAND
pathogenesis [28,38,54–64]. Mechanisms underlying development of HAND, particularly in the current
ART era, however, remain minimally defined. This is the first report, to our knowledge, to describe
an imbalance in autophagy in astrocytes resulting from exposure to extracellular Nef, as well
as to commonly prescribed antiretroviral drugs in a concentration consistent with CSF levels.
We find that Nef accelerated APG degradation, ART decreased APG biogenesis, and exposure
to concomitant Nef and ART resulted in both decreased APG biogenesis and accelerated APG
degradation. These effects manifested with short-term treatment, confirmed with three independent
and complimentary techniques, and were maintained after “long-term” exposure. We also find that
selective autophagy, quantified by p62 lysosomal flux, may be inhibited by all three treatments after both
short- and “long-term” treatment. We propose that this imbalance in autophagy will disrupt astrocyte
homeostasis and function, and thus has important implications for PLWH and their development
of HIV-associated neurocognitive disorders. Our data also indicate some potential interventional
strategies to mitigate this burdensome comorbidity.
Upregulation of autophagic flux is a normal cellular response to stress and is usually manifested
by increased APG biogenesis coupled with increased APG degradation. While we found accelerated
APG degradation after Nef, there was not an accompanying increase in APG biogenesis, as would
be expected if autophagic flux were induced as a normal response to the presence of a flux inducing
stimuli. Similarly, degradation after ART treatment was variably impacted while APG biogenesis was
consistently decreased, and astrocytes treated with concomitant Nef and ART had defects in both of
these steps in autophagy. The changes induced by Nef and/or ART in biogenesis and degradation are
not balanced by appropriate changes in the other steps of autophagic flux, suggesting that the alterations
did not result from the normal cellular response to stress. This indicates that Nef and ART cause
abnormalities in distinct steps of autophagy, thus creating an imbalance in flux. These effects were
not due to the inclusion of chloroquine. First, our experiments with the dual-fluorescent LC3 reporter
corroborate our Western blot data, and chloroquine was not used to assess flux in the reporter
experiments. Second, we found similar changes in synthesis and degradation after treatment with Nef
and/or ART when ammonium chloride plus leupeptin were used to inhibit lysosomal degradation
instead of chloroquine (data not shown). Additionally, treatment with chloroquine lasted 4 h. This short
duration is unlikely to cause any significant toxicity to the astrocytes. Thus, these effects on autophagy
are due specifically to Nef and/or ART.
Autophagy is upregulated by stimuli typically within a few to several hours. We performed
time course experiments in which we evaluated flux after 6 and 11 h of Nef and/or ART treatment
but did not see significant changes relative to control cells (data not shown). We found that APG
biogenesis and degradation were most altered after 24 h of treatment, long after the expected duration
of autophagic upregulation. Moreover, the changes to autophagy induced by Nef and/or ART persisted
over 7 days of treatment, suggesting there are long-lasting effects of these treatments. We postulate
that ongoing abnormalities induced by Nef and/or ART ultimately contribute to long-term imbalance
in autophagic flux, leading to autophagy exhaustion and failure. Similar defects in autophagy have
been shown in neurodegeneration as well as in physiological aging [81–83]. To this point, it has also
been postulated that autophagy dysregulation in CNS cells from people with HIV encephalitis, a type
of HAND, reflects a picture of autophagy exhaustion and accelerated aging [55]. This hypothesis is
supported by our Western blot data in that the fold changes in LC3-II level, biogenesis, and degradation
relative to control were not as pronounced after 7 days as compared to 24 h, suggesting that the cells
could not keep up with the ongoing imbalance between biogenesis and degradation induced byYou can also read