Report - Concawe's Transport and Fuel Outlook towards EU 2030 Climate Targets
←
→
Page content transcription
If your browser does not render page correctly, please read the page content below
Report
Report no. 2/21

       Concawe’s Transport and
                  "

       Fuel Outlook towards EU
       2030 Climate Targets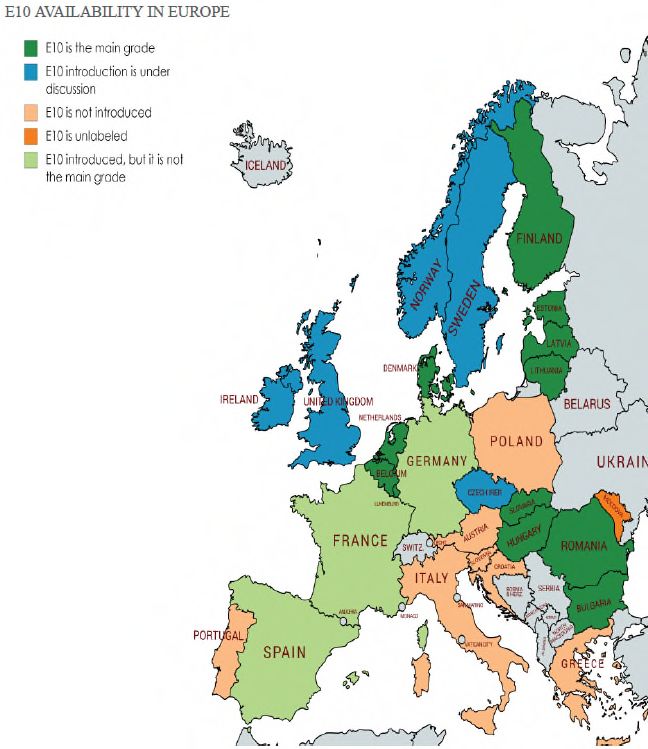
report no. 2/21
Concawe’s Transport
and Fuel Outlook
towards EU 2030
Climate Targets
This report was prepared by:
Marta Yugo, Ehsan Shafiei, Linda Ager-Wick Ellingsen, John Rogerson
Under the supervision of:
M. Yugo (Concawe Science Executive)
Transport_LowCarbonPathways@concawe.eu
At the request of:
Concawe Fuels Quality and Emissions Management Group
Thanks for their contribution to the members of the Concawe STF-14 Task Force
Reproduction permitted with due acknowledgement
Concawe
Brussels
April 2021
I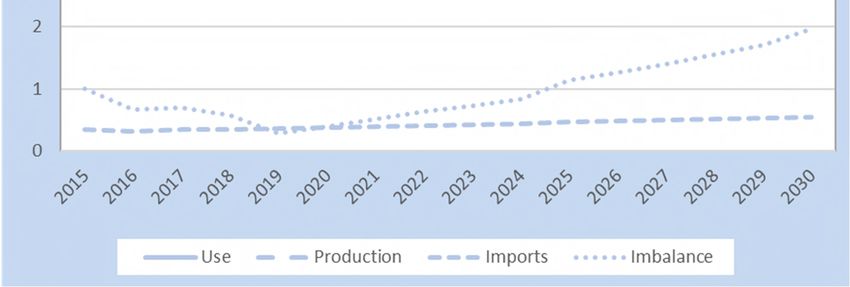
report no. 2/21

            ABSTRACT

            This Concawe report aims at providing an outlook on the European transport sector
            by modelling elements such as the evolution of the different powertrains and the
            availability of different alternative fuels over the period 2018-2030.

            An analytical fleet-based model has been used, projecting the evolution of the fleet
            composition as well as the corresponding fuel demand towards 2030. The analytical
            tool is used to simulate different parameter combinations of vehicle and fuel (and
            thereof renewable fuel) technologies to assess fuel demand scenarios looking at
            vehicle fleet mix, fossil fuel demand, total renewable energy demand, and RED-II
            target. The composition of 2030 new vehicle sales has been defined based on market
            trends and experts’ view, in compliance with the current 2030 CO2 intensity targets
            for new sales in road transport. Besides this, a current and future estimate on both
            the total energy requirements and alternative fuel penetration have been included
            for other transport modes including aviation, rail and maritime sectors. The
            analytical tools evaluate fuel supply availability based on an updated market-based
            outlook on production plants currently in operation as well as the planned capacities
            for biofuels.

            This study finally explores the compliance with RED II regulation and 2030 targets
            in a baseline scenario considering the impact of two different interpretations of
            using renewable electricity in the transport sector. Complementing the baseline,
            additional sensitivities on key individual parameters have been explored, mainly
            around the uptake of electric vehicles, bio-kerosene, biomethane, liquid biofuels,
            and gasoline fuel grades. The sensitivity analysis was conducted to show their
            individual impact on reaching the RED II targets, to inform the currently on-going
            process on future RED II targets for road transport (to be agreed in 2021).

            KEYWORDS

            Transport, Energy Demand, CO2 Emissions, RED II Target, Well-To-Tank, Well-To-
            Wheels, Alternative Fuels

            INTERNET

            This report is available as an Adobe pdf file on the Concawe website
            (www.concawe.org).

            Note. The Appendix of this report can be found with the following link:
            report no. 2/21A

NOTE
Considerable efforts have been made to assure the accuracy and reliability of the information
contained in this publication. However, neither Concawe nor any company participating in
Concawe can accept liability for any loss, damage or injury whatsoever resulting from the use
of this information.

This report does not necessarily represent the views of any company participating in Concawe.

II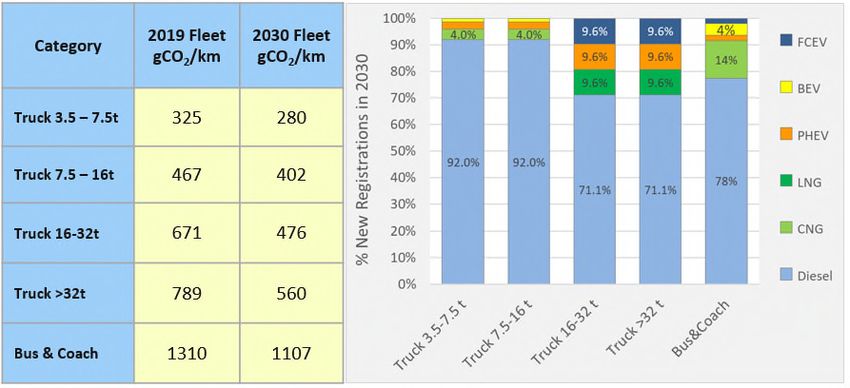
report no. 2/21

CONTENTS                                                                            Page

LIST OF FIGURES                                                                       V

LIST OF TABLES                                                                       VI

SUMMARY                                                                              VII

1.        INTRODUCTION AND METHODOLOGY                                                1
          1.1.      SCOPE AND OBJECTIVE                                               1
          1.2.      METHODOLOGY                                                       1
          1.3.      REGULATORY FRAMEWORK                                              3
          1.3.1.    Fuel Quality Directive – FQD 7a [Directive 2009/30/EC]            4
          1.3.2.    Renewable Energy Directive – RED II [Directive
                    2018/2001/EU ]                                                    4
          1.3.3.    New Light-Duty Vehicle CO2 emissions [EC 333’/14, EC
                    253’/14 and Regulation (EU) 2019/631]                             4
          1.3.4.    New Heavy-Duty vehicle CO2 emissions (Regulation (EU)
                    2019/1242)                                                        5
          1.3.5.    Worldwide Harmonized Light Vehicles Test Procedure WLTP           5

2.        BASELINE DEFINITION: FLEET COMPOSITION AND MODEL CALIBRATION                6
          2.1.       PASSENGER CARS (PC)                                              6
          2.1.1.     Passenger Car Stock                                              9
          2.1.2.     Model Calibration for Ethanol Grades                            11
          2.2.       LIGHT COMMERCIAL VEHICLES (LCV)                                 13
          2.3.       HEAVY-DUTY VEHICLES (HDV)                                       14
          2.4.       OTHER MODES                                                     16
          2.4.1.     Aviation sector                                                 16
          2.4.1.1.   Background information                                          16
          2.4.1.2.   Fuel demand outlook                                             17
          2.4.1.3.   Expected alternative fuel penetration                           17
          2.4.2.     RAIL                                                            19
          2.4.2.1.   Fuel demand outlook                                             19
          2.4.2.2.   Alternative fuel penetration                                    19
          2.4.2.3.   Inputs to the model – 2030 baseline                             20
          2.4.3.     Maritime and waterways                                          21
          2.4.3.1.   Fuel demand outlook                                             21
          2.4.3.2.   Alternative fuel penetration: Opportunities                     22
          2.4.3.3.   Alternative fuel penetration: Inputs to the model – 2030
                     baseline                                                        23

3.        ENERGY DEMAND                                                              25
          3.1.      ENERGY DEMAND OUTLOOK: EUROPEAN COMMISSION (2015-
                    2050)                                                            25
          3.2.      FLEET MODEL RESULTS: CURRENT AND 2030 ENERGY DEMAND              25
          3.2.1.    CURRENT ENERGY DEMAND – FLEET MODEL CALIBRATION                  25
          3.2.2.    FUTURE ENERGY DEMAND: 2030 PROJECTIONS                           27

4.        BIOFUEL AVAILABILITY AND USE                                               29
          4.1.      BIOFUEL AVAILABILITY (2015-2030)                                 30
          4.1.1.    Biofuel production in Europe                                     30
          4.1.2.    Biofuel trade                                                    32
          4.1.2.1.  Ethanol imports (2017)                                           32
          4.1.2.2.  FAME imports (2017)                                              33
          4.1.2.3.  Projection of future imports                                     34

                                                                                       III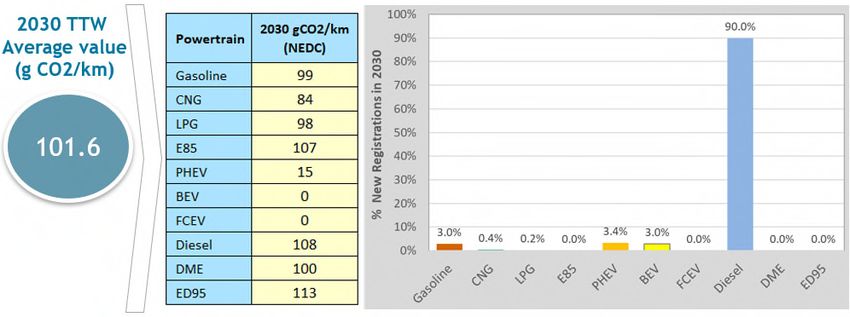
report no. 2/21

     4.1.3.      Total biofuel availability                                       34
     4.2.        BIOFUEL USE IN EUROPE (2015-2030)                                35
     4.3.        BIOFUELS BALANCE: AVAILABILITY VERSUS USE (2015-2030)            37
     4.4.        A LOOK INTO FEEDSTOCKS (2015-2030)                               40
     4.4.1.      Feedstocks for ethanol, FAME, and HVO produced in Europe         41
     4.4.2.      Feedstocks for other biofuels                                    42
     4.4.3.      Import feedstocks                                                43
     4.5.        WELL-TO-TANK (WTT) CARBON INTENSITY OF BIOFUELS                  43

5.   RESULTS. IMPACT ON GHG EMISSIONS AND COMPLIANCE WITH EXISTING
     REGULATORY FRAMEWORK                                                         46
     5.1.       TOTAL ENERGY USE FOR THE TRANSPORT SECTOR                         46
     5.2.       GREENHOUSE GAS EMISSIONS FROM TRANSPORT                           48
     5.2.1.     GHG emissions per transport sector                                49
     5.2.2.     GHG emissions per fuel or energy carrier                          50
     5.3.       COMPLIANCE WITH CURRENT REGULATORY FRAMEWORK                      50
     5.3.1.     RED II (Recast of Renewable Energy Directive, Directive (EU)
                2018/2001)                                                        51
     5.3.1.1.   RED II calculations                                               51
     5.3.1.2.   Multiplicator values                                              53
     5.3.1.3.   RED II results –2030 Baseline                                     55
     5.3.1.4.   RED II results – sensitivity analyses                             59
     5.3.1.4.1  Key parameters                                                    59
     5.3.1.4.2  Results of sensitivity analysis                                   62
     5.3.2.     GHG emission intensity reduction (Fuel Quality Directive)         65

6.   GLOSSARY                                                                     67

7.   BIBLIOGRAPHY                                                                 69

IV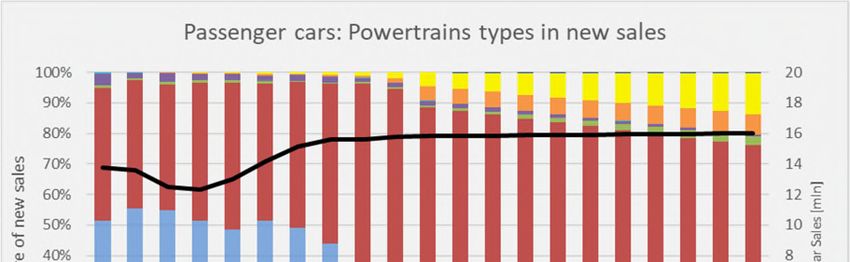
report no. 2/21
LIST OF FIGURES
Figure 1. Methodology followed in the fuel supply & demand outlook presented in this report ......... 1
Figure 2. NEDC emission figures and new registration for new passenger car sales in 2030 ................ 7
Figure 3. Powertrain share for new registrations in 2030 ..................................................................... 7
Figure 4. Electric cars registered in the EU-27, Iceland, Norway and the United Kingdom (EEA, 2019) 8
Figure 5. Year 2005 model passenger car survival curve ....................................................................... 9
Figure 6. Fleet model output: powertrain types in new sales ............................................................. 10
Figure 7. Fleet model output: powertrain types in the fleet stock ...................................................... 10
Figure 8. Predicted gasoline and ethanol usage to 2030 ..................................................................... 12
Figure 9. Ethanol usage in various grades ............................................................................................ 12
Figure 10. E10 availability in Europe (Figure from SGS Inspire (2020)) .................................................. 13
Figure 11. NEDC figures and new registration for light-duty commercial vehicle sales in 2030............ 14
Figure 12. Figures for emission intensity and new registration for heavy-duty commercial vehicle sales
in 2030 ................................................................................................................................... 15
Figure 13. EU international maritime fuel mix and consumption, in the Baseline and alternative
scenario (EC, 2018) ................................................................................................................ 22
Figure 14. Final energy consumption from (Eurostat, 2019) ................................................................. 25
Figure 15. Comparison in different fuel consumption between the outcome of the fleet modelling
presented in this report and Eurostat data (Eurostat, 2020) – Road transport .................... 26
Figure 16. Fuels consumed in the transport sector towards 2050 (2030 Impact Assessment, 2020) ... 28
Figure 17. Schematic drawing of approach to map total energy use. ................................................... 29
Figure 18. Development of biofuel utilized production capacity in Europe from 2015 through 2030 .. 31
Figure 19. Estimated import volumes and countries of origin for ethanol (Concawe estimate) ........... 33
Figure 20. Import volumes and countries of origin for FAME (Concawe estimate) ............................... 33
Figure 21. Estimated availability of various biofuel types in Europe. Note that ethanol and FAME also
includes import volumes. The total import volumes are denoted with a dashed line in the
figure. .................................................................................................................................... 34
Figure 22. Biofuel use per fuel type. The ethanol and FAME imports are included in the total uses of
the fuels, and the total import volume is denoted by a dashed line .................................... 35
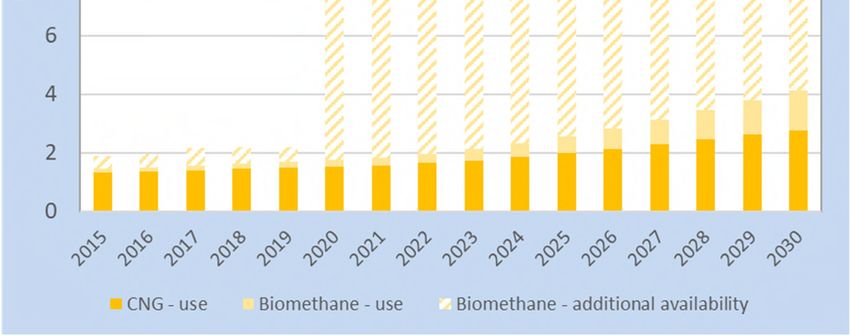
Figure 23. CNG and biomethane use, and additional biomethane availability ...................................... 37
Figure 24. Estimated imbalance of biofuels in transport based on availability and use (delta) ............ 38
Figure 25. Estimated development of ethanol supply and demand ...................................................... 40
Figure 26. Estimated development of FAME supply and demand ......................................................... 40
Figure 27. Feedstocks for ethanol, FAME, and HVO in Europe in 2017 and 2030. ................................ 41
Figure 28. Feedstocks for biomethane ................................................................................................... 42
Figure 29. Feedstocks for ethanol and FAME imports ........................................................................... 43
Figure 30. Estimated WTT GHG intensity factors based on the projected biofuel feedstocks and their
assigned WTT GHG intensity factors (simplified approach). ................................................. 45
Figure 31. Total energy use per sector ................................................................................................... 46
Figure 32. Total energy use per fuel or energy carrier ........................................................................... 47
Figure 33. Extracted from JEC WTT v5 - EU electricity production mix (2016 data and projections for
2030) ..................................................................................................................................... 48
Figure 34. Total GHG emissions per sector ............................................................................................ 49
Figure 35. Total GHG emissions per fuel or energy carrier .................................................................... 50
Figure 36. Development of the RES-T percentage shares with the multiplicator values in the
numerator. Interpretation 1 are shown on the left chart while Interpretation 2 are shown
on the right chart .................................................................................................................. 59
V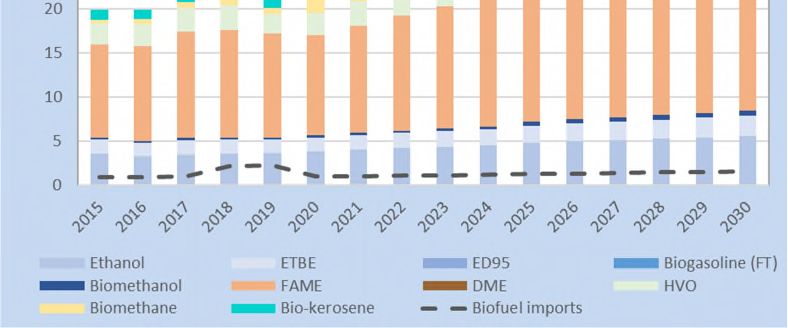
report no. 2/21

LIST OF TABLES

Table 1.    Alternative fuels ...................................................................................................................... 3
Table 2.    Comparison between fleet model output and Eurostat data in 2018 (Eurostat, 2020) ........ 11
Table 3.    Expected jet fuel demand (in Million Tonne and Mtoe) for EU aviation sector (Domestic
            flights plus international extra-EU *) ..................................................................................... 17
Table 4.    Expected fuel demand for EU aviation sector to completely mitigate growth in GHG
            emissions (Based on Table 3) ................................................................................................ 18
Table 5.    Proposed Baseline for aviation (estimate ramping up from today) ...................................... 19
Table 6.    Pathways used to model the share of renewable electricity ................................................ 19
Table 7.    Baseline for rail (2030). Type of fuels and carbon intensity values used in the present study
            (Well-To-Tank and Tank-To-Wheels) ..................................................................................... 20
Table 8.    LNG EU mix 2030 (estimate) .................................................................................................. 20
Table 9.    H2 EU mix 2030 (Estimate) ..................................................................................................... 21
Table 10.   Comparison of consumption data for EU domestic, inland waterways and international,
            based on (EC, 2018), (EASA & EEA, 2016) .............................................................................. 23
Table 11.   Baseline for maritime (Domestic and inland waterways) - summary ................................... 24
Table 12.   Baseline scenario for maritime (domestic and inland waterways): Alternative fuel
            penetration in 2030 ............................................................................................................... 24
Table 13.   Comparison in energy demand from different sub-groups between the outcome of the fleet
            modelling presented in this report and IDEES (Gasoline and Diesel including bio, Mtoe) –
            Road transport....................................................................................................................... 26
Table 14.   Baseline energy demand ....................................................................................................... 27
Table 15.   Comparison between 2030 Impact assessment (baseline and range of scenarios considered)
            and outcome of the Concawe’s baseline presented in this report ....................................... 28
Table 16.   Multiplicator values for various fuels and energy carriers used in the numerator (num.) as
            well as the denominator without (den. w/o) or with (den. w) .............................................. 54
Table 17.   Results in terms of energy content for 2030 Baseline - Interpretation 1 .............................. 55
Table 18.   Results in terms of percentage shares for the 2030 Baseline - Interpretation 1................... 56
Table 19.   Results in terms of energy content for the 2030 Baseline - Interpretation 2........................ 57
Table 20.   Results in terms of percentage shares for 2030 Baseline - Interpretation 2 ......................... 58
Table 21.   Sensitivity cases ..................................................................................................................... 60
Table 22.   Summary of the sensitivity analysis considering a change in model parameters
            (Interpretation 1) ................................................................................................................... 62
Table 23.   Summary of the sensitivity analysis considering a change in the modelling (Interpretation 2)
            65
Table 24.   Baseline results for road transport fuels in terms of GHG intensity reduction ..................... 66

VI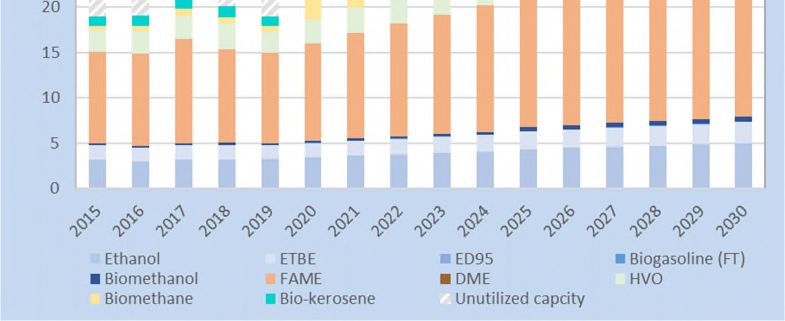
report no. 2/21
SUMMARY
Objectives:
This report aims at providing an outlook on the European transport sector by
modelling elements such as the evolution of the different powertrains and the
availability of different alternative fuels over the period 2018-2030. In this regard,
the main objectives of this specific baseline outlook are:
To conduct a thorough assessment for the progressive penetration of energy
efficiency measures and different powertrain technologies into the EU vehicle
fleet, combined with the market-based availability of alternative fuels and
energy carriers.
To assess the potential of various renewable alternative fuels, with focus on
biofuels and electricity taking into consideration factors such as availability of
supply, technology readiness levels and existing fleet constraints (only a very
limited e-fuel production capacity is reported in the explored timeframe).
To explore the current status of the potential of the EU transport sector to
integrate renewable fuels and reduce GHG emissions towards 2030 (as a
baseline), including the comparison of this baseline versus the currently in
revision EU targets defined by the CO2 standards in vehicles, the Renewable
Energy Directive 2 (RED II) and the Fuel Quality Directive (FQD).
To run sensitivity analysis on key parameters identified to show their individual
impact on reaching the RED II targets, to inform the currently on-going process
on future RED II targets for road transport (to be agreed in 2021).
Analytical tools:
In order to conduct the analysis, an analytical fleet-based model has been used,
projecting the evolution of the fleet composition as well as the corresponding fuel
demand towards 2030. The fleet model is based upon historical road fleet data (for
both light- and heavy-duty vehicles) updated with recent statistics aggregated at
European level (EU27 plus UK, Norway and Switzerland). Once the calibration has
been conducted up to 2018, projections on the vehicle fleet are conducted towards
2030, including the effect of key parameters such as the potential composition of
new sales in 2030 (meeting the CO2 regulatory targets for both passenger cars and
heavy-duty vehicles), scrappage rates, and expected efficiency improvements in
different powertrains.
The modelled fleet composition leads to a road transport fuel demand and provides
the basis upon which the introduction and availability of alternative fuels are
explored to assess the total contribution of renewable energy and GHG emissions in
transport. Besides this, a current and future estimate on both the total energy
requirements and alternative fuel penetration have been included for other
transport modes (aviation, rail and maritime sectors) and compared against current
RED II targets.
Results:
The analytical tool is used to simulate different parameter combinations of vehicle
and fuel (and thereof renewable fuel) technologies to assess fuel demand scenarios
looking at:
Vehicle fleet mix;
Fossil fuel demand and diesel/gasoline balance;
VII
report no. 2/21
Total renewable energy demand (including conventional and advanced
biofuels);
Renewable energy demand for transport to be used for achieving the RED-II
and FQD targets.
a) Fleet evolution/Energy demand:
The composition of 2030 new sales has been defined based on market trends
and experts’ view, in compliance with the current 2030 CO2 intensity targets
for new sales in road transport (expressed in NEDC terms for comparison
purposes):
Passenger cars: 95 g CO2/km in 2021 and further 37.5% reduction by
2030 (equivalent to ~59 g CO2/km NEDC in 2030 baseline).
Light commercial vehicles (vans): 147 g CO2/km in 2020 and being 31%
less TTW intensive than in 2020/2021 (equivalent to ~100 g CO2/km
modelled in the 2030 baseline).
Heavy-duty vehicles: 30% emissions reduction by 2030, compared to 2019
(for Trucks>16t in gCO2/tkm) and a value of 536 g CO2/km as average for
heavy-duty commercial vehicles in 2030.
Figure S1. New fleet sale mix in 2030 to meet CO2 emission target
Overall, the share of alternative vehicles (including PHEV, BEV, FCEV, and
CNG/LNG/LPG) in new sales for road transport accounts for ~24% for
passenger cars (versus ~4% in 2018), 7% of vans (versus 1.9% in 2018), 8% of
heavy-duty trucks 16t
(versus 0.5% in 2018), and 23% in the case of buses and coaches (versus 4.7%
in 2018).
As a result of the composition of the fleet and the fuel efficiency
improvements towards 2030, the total energy demand in road transport has
been estimated in 239 Mtoe/y. Besides the road segment, the evolution of
aviation, rail and maritime sectors (international extra-EU trips
considered), generally increasing their activity towards 2030, represents an
additional ~80 Mtoe/y, resulting in an estimated ~318 Mtoe/y energy
demand for the whole EU transport sector in the 2030 baseline.
VIIIreport no. 2/21
Figure S2. Breakdown per type of fuel (2018 vs 2030) and % market share
b) Energy supply and alternative fuel availability:
Liquid and gaseous (excluding H2) fuels:
It is based on an updated outlook on production plants currently in operation,
under construction and recent announcements in Europe (based on the
STRATAS’s 2017 database mapping the facilities worldwide, updated with recent
announcements in Europe), maximising the current utilisation rate of existing
plants towards 2030. These volumes are also complemented by additional
imports, keeping the same domestically produced vs imported volume ratio in
2030 as today. As a conclusion, it is worth noting that:
The current alternative fuel production (installed) capacity is still very
based on food-crop biofuels and despite some recent announcements about
new built plants in Europe, including the production of second-generation
biofuels, the market-based signals seem to show a modest ramp-up, at least
regarding the projects announced to the public domain.
IXreport no. 2/21
Fully utilising the existing (installed) capacities in 2018 would be able to
deliver an additional volume of ~11 Mtoe/y (100% utilisation considered at
the end of the 2030 period). When all existing and new facilities are
considered, the 2030 baseline reports a maximum technical availability of
~47 Mtoe/y (based on the maximum installed capacity), of which only
~21 Mtoe/y are deemed to be used in transport as a result of the energy
demand modelled.
Electricity and hydrogen (as final fuels):
Due to the foreseen electricity demand in transport in the 2030 baseline
(~12 Mtoe/y of total demand of electricity mainly in road and rail modes
representing about 4% of the current gross generation capacity in EU27+3) as a
simplification, no limitations on the EU electricity generation capacity have been
assumed at this stage (meeting the additionality criteria).
Hydrogen production for transport applications is limited in the 2030 baseline
(2.1 Mtoe/y as the total demand in the whole transport sector), where the
majority is directed to road transport (2.0 Mtoe/y). Based on the current pace
of development of renewable hydrogen in Europe, an increase in renewable
hydrogen was assumed for road and rail applications (25% in 2030).
Figure S3. Estimated availability of various biofuel types in Europe. Note that ethanol and
FAME includes import volumes as well
c) RED II targets (baseline and sensitivity analysis)
As the RED II “framework on additionality in the transport sector” (article
27/point 3) is in the process of being fully defined by the Commission, this study
explores the impact of two different interpretations when this concept the
renewable electricity is applied to the transport sector. The results of the
baseline, in terms of the percentage of equivalent renewable energy versus the
RED-II 14% minimum sub-target in road and rail transport by 2030 are presented
below:
Xreport no. 2/21
(1) Interpretation 1 (Additionality criteria on renewable electricity in
transport ): RES-T 15.6%
(2) Interpretation 2 (Additionality criteria on total renewable installed
capacity): RES-T 17.0%
Note that the difference between both interpretations is mainly due to the
current electricity consumption in rail, helping meet the RED-II target. In both
cases, all the sub-targets are met with the exception of the Annex A (min 3.5%)
which, with the current market trends/announcements, is deemed to be at risk
of being accomplished.
When the compliance with RED II regulation is explored, the 2030 baseline shows
that:
The multipliers boost the contribution of electrically-driven powertrains
and the role of biofuels in transport in compliance with RED-II up to a total
of 15.6% (Interpretation 1) and 17.0% (Interpretation 2) in the baseline.
The impact of these multipliers is significant and deemed to represent
~56% in energy content within the current baseline (without multipliers,
absolute renewable energy share would represent 10.3% (Interpretation 1)
and 11.1% (Interpretation 2)).
Renewable electricity use in transport represents 3.9% (Interpretation 1)
and 5.4% (Interpretation 2) of the total renewable energy in transport
(RES-T) target (with multipliers) while the contribution of biofuels is ~11.5%
(5.3% of which corresponds to advanced biofuels).
Based on both the expected availability and blending walls, the share of
first-generation (crop-based) biofuels remains below the imposed cap (max
7%).
Regarding advanced biofuels, while the physical cap on Annex IX Part B is
respected (1.7%), the minimum requirement on Annex IX Part A is not
reached (2.2% vs the 3.5% min defined in RED II).
Based on these results, additional investments/supports on alternative fuels
(including liquid, gaseous and electricity) will be required to realise their
potential towards 2030, versus current trends/public announced projects.
Complementing the baseline, additional sensitivities on key individual
parameters have been explored. The following table summarises the main
findings of the sensitivity analysis.
XIreport no. 2/21
Table S1. Summary of the sensitivity analysis considering a change in model parameters
Case RED-II % RED-II % Key Outcome
Interpretation 1 Interpretation 2
Baseline 15.6% 17.0%
30% BEV+PHEV in 2030 sales 16.4% 17.8% Additional sales of 1.6 million
new EVs in 2030 raises RED-II by
~0.8%
5% bio-kerosene in 2030 aviation 16.7% 18.1% Rising RED-II by 1.1%. Compliance
fuel with the food-crop based
feedstock cap could be at risk
depending on the primary
feedstocks selected for the
conversion processes.
Higher HVO use to reach min 16.9% 18.4% The use of feedstock A is about
3.5% Annex A feedstock 60% higher than baseline
40% share of biomethane in total 16.8% 18.3% Towards meeting all RES-T
gas targets and biofuel feedstock
sub-targets with Annex A at risk
(3.4%)
1.7% administrative cap on 14.1% 15.6% 1.5% lower RED-II compared to
Annex B feedstocks baseline
E10 limited uptake (78% of fuel 15.4% 16.9% Slight reduction in RED-II by 0.2%
grades by 2030)
Only E5 grade (theoretical 14.6% 16.1% ~1% reduction in RED-II
assessment)
Liquid biofuels in 2030: 20% in 16.0% 17.5% Small increment of 0.5% in RED-II
maritime and 10% in non-
electric rail
LNG trucks (>16t segment) with 15.5% 17.0% Very small decrease in RED-II due
dual-fuel HPDI technology in to lower use of biomethane
2030
In summary, regarding the RED-II targets:
All sensitivity cases meet the RED II target.
The share of first-generation crop-based feedstocks was successfully kept
below the 7% cap under all conditions.
Reaching the target of 3.5% Annex A feedstocks can be obtained in the
sensitivity case of 3x increase in HVO use. Approaching this target was also
observed in the case where diverted (or additional production) of biomethane
replaced at least 40% of fossil CNG/LNG in transport. Biomethane is envisaged
to be a key potential player when reaching RED-II targets in the current market-
based scenario. It is important to remark that the higher use of biomethane in
transport may not imply any additional GHG reduction versus the baseline
unless the whole energy system is considered (potential risk of shifting GHG
reduction among sectors).
d) GHG reduction (towards FQD targets):
At the moment of publication of this report, the revision of the FQD directive is
being undertaken by the EU COM. The results of the assessment based on the
accounting routes and Well-To-Tank intensity factors considered in this Concawe
XIIreport no. 2/21
report are summarised in the following table. The 2030 baseline estimates a GHG
intensity reduction in road transport fuels in 2030 of 8.8% versus 2010. The
results of the 2030 baseline are intended to be used to inform the ongoing
revision.
Table S2. Baseline results for road transport fuels in terms of GHG intensity reduction in
road
Year GHG Emissions Energy Use Emission Factor GHG intensity reduction from
(Mt CO2-eq) (Mtoe) (g CO2-eq/MJfuel) 2010
2030 857 238 85.8 -8.8 %
It should be noted that the 2018 baseline does not represent any individual company’s views,
and is the result of a consensus prior to the publication of the EU’s 2030 Impact Assessment. The
modification of various parameters (some of them already explored as sensitivities in this
analysis) or any additional policy considerations (e.g. the use of renewable fuels of non-biological
origin (RFNBO), electrolytic hydrogen and e-fuels versus electricity) could have an impact, and
could effectively enable a higher penetration of renewable energy in the transport sector.
XIIIreport no. 2/21
1. INTRODUCTION AND METHODOLOGY
1.1. SCOPE AND OBJECTIVE
The scope of this fuel outlook is:
To estimate a fuel demand baseline scenario in the EU transport sector
towards 2030.
Through a detailed fleet modelling exercise of both Light- and Heavy-Duty
segments, the potential penetration of alternative powertrains and energy
efficiency measures is investigated. The currently in place 2030 CO2 standards
for road transport are met as the baseline for future alternative scenarios.
Other modes (aviation, maritime and rail) are also investigated following a
more simplified approach.
To integrate a market-based outlook on the potential availability of alternative
fuels (supply), replacing conventional oil-based fuels at EU level for the same
timeframe.
To assess the total impact of the combination of energy efficiency measures
and alternative powertrains and fuels to reduce GHG emissions and energy
demand in EU transport by 2030.
To inform the on-going definition of new 2030 EU targets for transport by
comparing the GHG reduction and penetration of renewable energy in
transport in this market and industry-based scenario (as well as additional
sensitivity cases) versus the current 2030 EU Renewable Energy Directive 2 and
Fuel Quality Directive targets.
1.2. METHODOLOGY
The methodology to define the baseline for the 2030 fuel supply and demand in
the EU transport sector follows a three-step approach as defined in the figure
below:
Figure 1. Methodology followed in the fuel supply & demand outlook presented in this
report
1report no. 2/21
How are the fleet projections estimated?
The fleet modelling tool used covers the road vehicle fleet development and the
resulting demand for fossil fuels and biofuels and aggregated for 30 European
countries (EU27 plus UK, Norway and Switzerland). The model has been developed
to enable projections towards the year 2030 based on a set of assumptions.
The model is a spreadsheet-based tool for passenger cars, light-duty commercial
vehicles and heavy-duty vehicles including buses and coaches. The model also has
the facility to report on the use of each type of fuels (including biofuel breakdown),
greenhouse gas (GHG) emissions, share of renewable energy used in each segment
and calculate the outcome of the Fuels Quality Directive and the Renewable Energy
Directive when applied to the different scenarios and sensitivities.
The key assumptions in the model are: new registrations, fleet stock levels, fleet
fuel efficiency and annual vehicle mileage. As a summary:
Passenger car (PC):
PC fleet parameters, for example, new registrations and stock
Alternative powertrains (see more details in Section 2.1)
Fleet average annual mileage
Vehicle fleet fuel consumption and related CO2 efficiency1
Light commercial vehicles (LCV) or vans
LCV fleet parameters: new registration and stock
Alternative powertrains
Average annual mileage
Vehicle efficiency vs. diesel or gasoline vehicle efficiency
Heavy-duty vehicles (HDV):
HDV fleet parameters (such as new registrations and stock per class
category)
Alternative powertrains penetration
Alternative powertrains efficiency vs. diesel vehicle efficiency.
Average annual activity per vehicle class category, either as ton
kilometres (tkm) or passenger kilometres (pkm) as appropriate.
A complete set of assumptions can be found in the Appendix of this report.
Motorcycles are excluded from this modelling, as they only contribute to 1% of all
transportation GHG emissions in EU28 (Roland Berger, 2016).
An extensive review of statistics, database, market trends, external outlooks and
expert’s view gathering has been conducted to calibrate this fleet model. Linear
growth patterns have been assumed for forward predictions to 2030 for the major
fleet parameters. Besides this, sensitivity cases on key parameters are also explored
to investigate the impact on 2030 EU targets. A comprehensive set of assumptions
can be found in the Appendix of this report.
1
For PHEV there is a proportion for the combustion engine efficiency and a proportion for the EV, scaled
for the amount of driving in EV mode.
2report no. 2/21
Due to simplifications made and estimates used, the model has not to be considered
as a tool for cost optimized strategies but rather looking at a variety of scenarios of
fleet and fuel development based on informed and expert views. Therefore, the
assumptions made should not be considered as a forecast of or commitment to the
future availability of vehicle technologies or vehicle features.
What alternative fuels are included in the baseline?
The result of the model is the fuel consumption estimate and each type of fuel is
reported out in PJ/a and Mtoe/a. The model is capable of calculating also the
alternative fuel usage as it relates to the Renewable Energy Directive recast
(RED-II) and the Fuels Quality Directive (FQD).
For the purposes of this report, alternative fuels (according to Directive
2014/94/EU, Article 2) are ‘’Fuels or power sources which serve, at least partly,
as a substitute for fossil oil sources in the energy supply to transport and which have
the potential to contribute to its decarbonisation and enhance the environmental
performance of the transport sector. They can be liquid, gaseous or electricity’’
In this context, the followings are being considered as examples of alternative fuels
(detailed in the JEC WTT v5 report (Prussi, et al., 2020)) and most of them included
in the fleet and fuel model depending on the expected availability and/or
penetration in the 2030 timeframe:
Table 1. Alternative fuels
Alternative fuels (Examples)
Liquid Gaseous Electricity
Ethanol Hydrogen Electricity
Hydroprocessed vegetable oils (HVO) Compressed natural gas (CNG)
Fatty acid methyl esters (FAME) Compressed upgraded
Hyroprocessed Esters and Fatty Acids (HEFA) biomethane
Synthetic gasoline and diesel from Compressed synthetic methane
biomass/waste from biomass gasification
Synthetic gasoline and diesel via Power-to- Compressed synthetic methane
Liquid. via Power-to-Gas
Liquefied natural gas (LNG) DME
Liquefied petroleum gas (LPG)
Liquified upgraded biomethane
Liquified synthetic methane from biomass
gasification
Liquified synthetic methane via Power-to-Gas
routes
Methanol
ED95
1.3. REGULATORY FRAMEWORK
A number of EU regulations and directives target GHG emissions reduction in the
road transport sector; this normative framework has been considered in developing
the current analysis.
3report no. 2/21
1.3.1. Fuel Quality Directive – FQD 7a [Directive 2009/30/EC]
The fuel supply industry is regulated via the FQD. The FQD 7a set a minimum 6%
reduction target in GHG intensity by 2020 for road transport fuels, compared to
2010 levels. This is accompanied by a definition of sustainability criteria for
biofuels.
1.3.2. Renewable Energy Directive – RED II [Directive 2018/2001/EU]
In December 2018, the revised renewable energy directive was adopted. In RED II,
the overall EU target for Renewable Energy Sources consumption by 2030 has been
raised to 32%, with a specific minimum share of 14% of the energy consumed in road
and rail transport by 2030 as renewable energy where aviation and maritime sectors
are also eligible towards the target (See Section 5.3.1 for more details).
1.3.3. New Light-Duty Vehicle CO2 emissions [EC 333’/14, EC 253’/14 and
Regulation (EU) 2019/631]
CO2 emissions from vehicles are regulated via obligations on OEMs (original
equipment manufacturers, i.e. carmakers) via vehicle CO2 emissions targets2. This
affects fleet CO2 emissions of new passenger cars and vans. Average CO2 emissions
for all new passenger cars are to be lowered from 130 g/km (2015) to 95 g/km by
2021. This reduction is a step-by-step approach until 2021 and represents a
reduction of 40% compared with the 2007 fleet average emission of 158.7 g CO2/km.
New light commercial vehicles (vans) need to meet a target of 175 g CO2/km by
2017 and 147 g CO2/km in 2020. New EU fleet-wide CO2 emission targets are set for
the years 2025 and 2030, both for newly registered passenger cars and newly
registered vans (Regulation (EU) 2019/631).
These targets are defined as a percentage reduction from the 2021 starting points:
Cars: 15% reduction from 2025 on and 37.5% reduction from 2030 on.
Vans: 15% reduction from 2025 on and 31% reduction from 2030 on.
The specific emission targets for manufacturers to comply with are based on the EU
fleet-wide targets, taking into account the average test mass of a manufacturer's
newly registered vehicles. A zero- and low-emission vehicles (ZLEV) are defined in
the Regulation as a passenger car or a van with CO2 emissions between 0 and
50 g/km. (Commission, Post-2020 CO2 emission performance standards for cars and
vans, 2019). However, these values may be subject to further revision by 2023 (as
described in the revision clause (Article 15) below and potentially to any additional
modifications as a result of the Green Deal revision in 2021.
Extract from Article 15: […] The Commission shall, in 2023, thoroughly review the
effectiveness of this Regulation and submit a report to the European Parliament
and to the Council with the result of the review. The report shall, where
appropriate, be accompanied by a proposal for amending this Regulation, in
particular, the possible revision of the EU fleet-wide targets for 2030 in light of
the elements listed in paragraph 2, and the introduction of binding emissions
reduction targets for 2035 and 2040 onwards for passenger cars and light
commercial vehicles to ensure the timely transformation of the transport sector
towards achieving net-zero emissions in line with the objectives of the Paris
Agreement. […]
2
https://ec.europa.eu/clima/policies/transport/vehicles/cars_en
4report no. 2/21
1.3.4. New Heavy-Duty vehicle CO2 emissions (Regulation (EU) 2019/1242)
In 2019, Europe adopted the first-ever EU-wide CO2 emission standards for new
heavy-duty vehicles (HDVs), the Regulation (EU) 2019/1242, setting CO2 emission
standards for heavy-duty vehicles entered into force on 14 August 2019.
HDV manufacturers will have to meet the targets set for the fleet-wide average CO2
emissions of their new vehicles registered from 2025, with stricter targets foreseen
from 2030 on. The targets are expressed as a percentage reduction of emissions
compared to EU average in the reference period (1 July 2019–30 June 2020):
from 2025 onwards: 15% reduction
from 2030 onwards: 30% reduction
In 2022, a revision is foreseen and by 2023, the Commission shall evaluate the
possibility of developing a common methodology for the assessment and reporting
of the full life-cycle CO2 emissions of heavy-duty vehicles. As part of the 2022
review, the Commission should assess the extension of the scope to other vehicle
types such as smaller lorries, buses, coaches and trailers.
The monitoring and reporting Regulation require that, as of 1 January 2019, Member
States monitor and report to the Commission information on the heavy-duty vehicles
registered for the first time in the Union; and lorry manufacturers monitor and
report to the Commission CO2 emission and fuel consumption data as determined
pursuant to the certification Regulation for each new vehicle produced for the EU
market. This information will be calculated using the Vehicle Energy Consumption
Calculation Tool (VECTO)3.
1.3.5. Worldwide Harmonized Light Vehicles Test Procedure WLTP
Along with CO2 emissions reduction, a new test procedure aimed at measuring fuel
consumption and vehicle CO2 emissions will replace the existing New European
Driving Cycle (NEDC): The Worldwide Harmonized Light-Duty Vehicles Test
Procedure (WLTP). The introduction of the WLTP aims to reduce the gap between
CO2 emissions certified in the laboratory and those experienced under real driving
conditions. Until 2020, WLTP will have no effect on the average CO2 emissions target
for new vehicles defined by NEDC.
3
VECTO is a simulation software that can be used cost-efficiently and reliably to measure the CO2 emissions and fuel
consumption of heavy-duty vehicles for specific loads, fuels and mission profiles (e.g. long haul, regional delivery, urban
delivery, etc.), based on input data from relevant vehicle components.
5report no. 2/21
2. BASELINE DEFINITION: FLEET COMPOSITION AND MODEL
CALIBRATION
As presented, the current model covers EU27+3. It uses historical data from the
Tremove database (Tremove, 2014), updated with the latest statistical data (ACEA,
ACEA-pocket-guide, 2019) (ACEA, Registrations-and-press-release-calendar, 2019)
for new registrations and stock.
2.1. PASSENGER CARS (PC)
The major inputs available within the model can be summarized as follow:
Stock: total fleet mileage by % Year-on-Year (YoY) growth, new registrations,
g CO2/km (emission intensity),
Share of diesel and gasoline of new registrations, %
Alternative fuel types in new registrations:
Compressed Natural Gas (CNG),
Liquefied Petroleum Gas (LPG),
Flexible Fuelled Vehicles (FFVs),
Battery Electric Vehicles (BEVs) and Plug-in Hybrids (PHEVs),
Fuel Cell Electric Vehicles (FCEV)
% BEV of EVs (BEV + PHEV),
Share of Electric driving (e-driving) in PHEV.
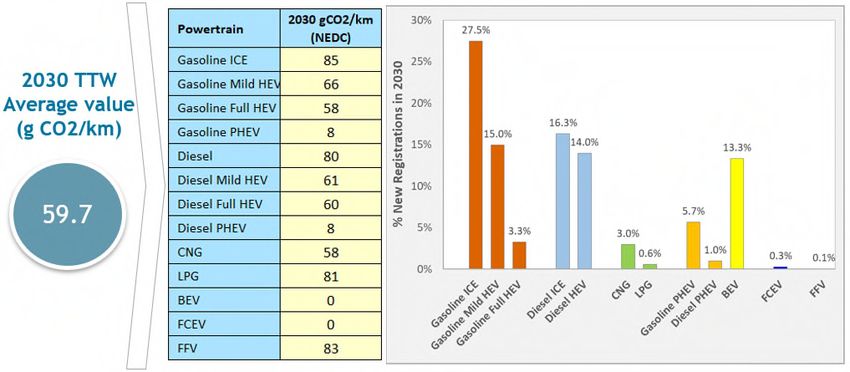
The composition of the fleet and the TTW CO2 assumptions are shown in Figure 2.
This data for the composition of the fleet and the TTW CO2 assumptions were
derived following a careful analysis of the JEC TTW study v5 (JEC, 2020). It is worth
reminding that in the report only C-segment passenger cars is used as reference for
the best available technology for 2025 onwards; therefore, this is to be considered
as an estimate and cannot be considered as fully representative of all new
registrations.
The fleet model has historically used NEDC figures for the calculation of TTW CO2
emissions and for vehicle fuel consumption. The JEC TTW v5 report calculated C-
segment technology TTW emissions on a WLTP basis. The expert group decided to
convert these WLTP figures to NEDC using the JRC conversion factors reported in
several publications from the European Commission4 to ensure continuity with the
historical data (JRC, 2017).
With the 2030 powertrain share, the corresponding NEDC TTW contribution for the
C-segment technology, these numbers were combined and then proportioned to
meet the 59.7 g/km fleet CO2 target (equivalent to 37.5% reduction compared to
2021 (95 gCO2/km) as defined in Regulation (EU) 2019/631).
4
https://ec.europa.eu/jrc/en/publication/eur-scientific-and-technical-research-reports/nedc-wltp-
effect-type-approval-co2-emissions-light-duty-vehicles
https://www.sciencedirect.com/science/article/pii/S0965856417312831
6report no. 2/21
Figure 2. NEDC emission figures and new registration for new passenger car sales in
2030
It has to be noted that the baseline is not representing any individual company
views and it is the result of the consensus within the consulted experts prior to
the publication of the Green Deal. The objective is to offer a market and
industrial view to inform the on-going discussion on the new 2030 transport
related targets.
The aggregated simplified powertrain shares for new registrations in 2030 (baseline)
are shown in Figure 3, aiming to comply with the current 2030 CO2 standards.
Figure 3. Powertrain share for new registrations in 2030
Note: Gasoline and diesel categories refer to internal combustion engines with different level
of hybridization (see more granularity in Figure 2).
7report no. 2/21
Some relevant comments regarding the assumptions:
a) Full hybrids and mild hybrids
The 2030 gasoline sales were split between 60% Internal Combustion Engines (ICE)
and 33% Mild Hybrid (MH), as used in the French Automotive Organization (La
Plateforme automobile – PFA) (Brossard & Duquesnoy, 2019), and 7% full hybrid
(higher than the value reported by (Roland Berger, 2016).
b) Electric Vehicle (BEV / PHEV) shares
The 2030 EVs (BEVs/PHEVs) share in new sales has been assumed to be 20% which,
together with the assumptions in terms of energy efficiency, could help meet the
current 2030 trends. A higher share of 30% reported in other recent studies, e.g.
(IEA, 2020), (Deloitte, 2020), is also taken into account as a sensitivity case. Within
this study, a split of 1/3 PHEV and 2/3 BEV is assumed for EV registration in 2030
(consistent with recent trends shown by Figure 4 and the proposed values by (IEA,
2020) and (Deloitte, 2020).
Figure 4. Electric cars registered in the EU-27, Iceland, Norway and the
United Kingdom (EEA, 2019)
c) Diesel share
In recent years, the diesel share of new registrations in EU has fallen from ~55% in
2013 to ~37% in 2018 (Eurostat, 2020). Based on the recent falling trend, the
proposed baseline for the fleet model assumes a slower reduction rate towards 2030
to reach about 30% by 2030. This assumption, which is in line with (Emisia, 2019),
reflects a reduction of new diesel sales with the expectation that the reduction rate
versus gasoline will recover somewhat from present values. Looking at 2030 new
sales, the 30% of diesel new car registrations are split 16% diesel ICE and 14% diesel
hybrid, this is broadly in line with the PFA study (Brossard & Duquesnoy, 2019).
Diesel PHEV’s are grouped separately in the PHEV assumptions.
8report no. 2/21
d) Gaseous fuels: CNG, LPG, H2
For CNG, 3% new registrations were assumed for 2030, in line with JEC Biofuel Study
(JEC, 2011) and (Roland Berger, 2016). The sales of LPG vehicles adopt Roland
Berger assumptions (0.6%).
It is assumed that Fuel Cell Vehicles will reach 300,000 by 2030 (Note that this is
notably lower than the 800,000 FCEVs by 2030 proposed by the Hydrogen Council).
Flex-fuelled vehicles are assumed to have a low penetration, 0.1%, as there is no
aggressive deployment foreseen in the supply infrastructure. This assumption is in
line with Roland Berger assumptions.
2.1.1. Passenger Car Stock
The passenger cars sales can be correlated to GDP and customer purchase behaviour
(e.g. car sharing); in this study, new passenger car sales are assumed to increase
with the annual growth rate of 0.11% per year, reaching about 16 million cars by
2030. The passenger car stock has been increased at a lower rate than the historical
year-on-year (yoy) growth rate, to reflect a higher scrappage rate as customers may
change their behaviour due to access restrictions in cities.
Sales and passenger car stock sizes are linked. In the model, a scrappage function
is set up in which the total number of vehicles to be scrapped is distributed over
the age profile of an individual car model year. The older the vehicle in the model
year, the higher the number of scrapped cars, following a typical S-shaped
distribution curve observed in TREMOVE. In updating the fleet model, the scrappage
functions have been tuned to obtain an average fleet age in line with the data
available from statistics.
Figure 5. Year 2005 model passenger car survival curve
The model contains historical data and based on the input parameters, predicts
future road vehicle fleet development in EU27 +3 countries. As an example, the
baseline prediction of powertrain types in new sales and the share of the
powertrains in the total stock are given in the figures below.
9report no. 2/21 Figure 6. Fleet model output: powertrain types in new sales Figure 7. Fleet model output: powertrain types in the fleet stock 10
report no. 2/21
Due to the uncertainty about the post-COVID recovery, the baseline analysis of fleet
composition assumes no impact towards 2030. The average vehicle mileage is
predicted to reduce from about 12,000 km/yr in 2018 to 11,250 km/yr in 2030
(Roland Berger), this is attributed to a slow population growth in Europe, a
demographic change resulting in a larger percentage of the elderly with lower
mobility requirements, as well as a gradual modal shift towards public transport.
This will deliver a relatively constant level of fleet kilometres as there is an increase
in the number of vehicles in the stock. The JEC TTW v5 data suggests that with
increased battery size allocation for PHEV’s, the percentage of distance running on
electric drive should be approximately 90% by 2030. The assumptions and settings
for the other model inputs are listed in the Appendix.
2.1.2. Model Calibration for Ethanol Grades
The model only accommodates three grades of gasoline (E5, E10 and E85). The
assumptions for these grades are summarized below:
a) Grade 1 gasoline (E5)
Data for 2010 only has two grades: E0 and E5 (23% of E0 and 77% of E5).
This gives E5 a concentration equivalent to 3.85% ethanol.
Thus, for the baseline in the model, the setting for Grade 1 gasoline,
nominally E5, was set as a constant factor of 3.95%, introduced in 2010,
with a ramp up in volume from 2005 (The actual values used in the model
calculations are at 0.1% volume below the model input values, to allow
for blending tolerances in the market).
b) Grade 2 gasoline (E10)
Grade 2 gasoline, nominally E10, was phased into the model from 2010,
at 10% volume.
The phase-in for Grade 2 used the default ramp up in the model up to 2017
and then the introduction is accelerated to 100% in 2030 in the baseline
case, rather than the default values in the model (78% in 2030).
The total gasoline and ethanol content for 2018 is compared to published data by
Eurostat in Table 2, this shows the model is in good agreement with the published
data:
Table 2. Comparison between fleet model output and Eurostat data in
2018 (Eurostat, 2020)
Year 2018 Fleet model Eurostat5
Gasoline (Mtoe/a) 76.6 77.9
Ethanol (Mtoe/a) 2.97 3.01
Figure 8 presents the fleet and fuel demand predictions for gasoline and ethanol
usage from 2005 through 2030. The figure is based on full E10 ramp-up and
represents the baseline scenario. Note that two separate sensitivity analyses in
Section 5 consider E5 uptake only and E10 ramp-up based on extrapolation of
historical data.
5Eurostat complete energy balances:
https://ec.europa.eu/eurostat/databrowser/view/NRG_BAL_C/default/table
11report no. 2/21
Figure 8. Predicted gasoline and ethanol usage to 2030
Figure 9 shows the estimated ethanol use in various grades used in the baseline.
Figure 9. Ethanol usage in various grades
Despite the fact that FQD allowed sales of the E10 grade since 2009, only a few
countries initially decided to deploy E10 in their markets as part of their biofuels
compliance: France, Germany, and Finland. Several countries have recently (2019,
2020) introduced the gasoline grade E10 (Denmark, Hungary, Slovakia, Latvia,
Lithuania, and Spain). Numerous countries still distribute only E5 grade: Poland,
Italy, Greece, and Portugal (SGS INSPIRE, 2020).
12report no. 2/21
Figure 10. E10 availability in Europe (Figure from SGS Inspire (2020))
2.2. LIGHT COMMERCIAL VEHICLES (LCV)
For vans and other light commercial vehicles, the main inputs can be summarized
as:
new registrations by % YoY growth,
stock by % YoY growth,
activity by % YoY growth,
energy use (MJ/km)
emission intensity (g CO2/km),
% alternative fuel vehicle types in new sales (CNG, LPG, FFV, PHEV, BEV, FCEV,
Dimethyl Ether (DME) and 95% Ethanol (ED95)).
13report no. 2/21
The Roland Berger study reports, based on the current market situation and expert
assessments, an expected, significant increase in the share of alternative
powertrains for LCVs in the coming years. Hybrids (mild, full and plug-in hybrids)
are expected to be the most important alternative powertrains.
The composition of the fleet and the assumed TTW CO2 assumptions are shown in
Figure 11. The assumed fleet composition has been found in good agreement with
the Roland Berger report. TTW CO2 figures reflect legislative targets (Note: the 2030
value in the following figure is assumed to be 31% less than 2020 as the target for
2021 is not given).
Figure 11. NEDC figures and new registration for light-duty commercial vehicle sales in
2030
The model has three categories of Light-Duty Commercial Vehicles:
Gasoline Vans,
Diesel 2.5 t.
It has been assumed that the PHEV / BEV and CNG technologies will be accounted
for in the gasoline vans segment; as a consequence, a total of 10% of new
registrations in 2030 will be in this category, rising from 4.1% from 2015. For this
study, it is assumed that the average mileage is 9,900 km/a for gasoline segment
and 16,000 km/a for diesel segments as in JRC IDEES database 2015. The main
assumptions and model settings for each of these categories are listed in the
Appendix, and are based on available statistics, the Roland Berger report, and
experts’ view analysis.
2.3. HEAVY-DUTY VEHICLES (HDV)
For HDVs the main inputs used can be summarised as:
Stock segmentation into:
Trucks 3.5 to 7.5 tonnes,
Trucks 7.5 to 16 tonnes,
Trucks 16 to 32 tonnes,
Trucks >32 tonnes,
Buses and Coaches.
14report no. 2/21
Sales %YoY growth,
Stock by % YoY growth,
Tonne (or passenger) km,
% load YoY growth,
% fuel economy improvement,
Alternative fuel types in new sales (DME, ED95, CNG, LNG, Electric, %BEV in
PHEV+BEV),
% share in e-driving of PHEV
Similar to LCV, Roland Berger study (Roland Berger, 2016) together with expert’s
views have been used as a relevant source of information, for this commercial
sector. The study foresees a significant increase in the share of alternative
powertrains for HDVs in the coming years.
In this outlook, the trucks heavier than 16t are assumed as the regulated vehicles
under EU heavy-duty vehicles’ CO2 emissions regulation - EU 2019/1242 (see
Section 1.3). It is assumed that 50% of new ICE diesel vehicles within the regulated
trucks will be hybrid technology by 2030. Due to the market uncertainty around the
penetration of alternative powertrains, the new sale composition for 2030 in
Baseline has been proposed based on a balanced distribution between LNG, PHEV
and FCEV (following a technology-neutral approach) so that the emission reduction
target of 30% is met by 2030 (see Figure 12). For the truck segment 3.5-16t and
buses, CNG is considered to be the most important alternative drivetrains by 2030,
with new registration shares of about 4% and 14% respectively.
For this version of the Fleet & Fuel model, the selection of technologies has been
expanded, in order to reflect this increased share of alternative powertrains. The
composition of the fleet and the TTW CO2 assumptions are shown in Figure 12.
Figure 12. Figures for emission intensity and new registration for heavy-duty
commercial vehicle sales in 2030
Note. Assumption: 50% of new ICE diesel vehicles (16-32 t segment) will be equipped with hybrid technology
by 2030.
15report no. 2/21
In developing the model, a challenging task has been to gathering information about
Heavy-Duty commercial vehicles activity. After internal verifications (on the
average activity per vehicles, etc.), the project team defined specific assumptions
for each HDV segments as listed in the Appendix tables; the defined values are
experts’ elaboration on data available from available statistics and Roland Berger’s
report.
2.4. OTHER MODES
Other modes, including aviation, maritime and railway, have been also modelled in
a simplified way to provide an estimate of the total fuel demand mix towards 2030.
2.4.1. Aviation sector
2.4.1.1. Background information
Among transport modes, road is still using the largest share of energy, but aviation
is showing a significant, steady and quite rapid growth: the total number of
passengers travelling by air in the European Union in 2018 have been 1.1 billion,
with an increment of 6% compared to 2017. In EU-28, international aviation
accounts for ~12.8% of energy consumed (1916 PJ), whereas domestic aviation uses
only 1.5% (232 PJ) (EUROSTAT, 2017).
Forecasts for civil aviation in the coming years draw a steady growth and, associated
with this growth scenario, an increasing pressure on the environment is expected.
The sector industry has set an aspirational goal for a carbon-neutral growth from
2020 onward (IATA, 2017), but specific mandates are not present. The main
measures today available to mitigate aviation environmental impact are related to
technical engine and aircraft aerodynamic improvements, new materials, better air
traffic management (SESAR, 2020), and the utilization of alternative fuels. Despite
the high innovation rate that the sector has been showing, decarbonising aviation
will be challenging, also due to the few alternatives available (EC, 2018);
alternative propulsion options, like liquified natural gas, hydrogen, hybrid systems,
etc., have been proposed and several solutions already tested but the most
attractive short-to-medium term options for the air transport industry still remains
to operate existing engines with lower carbon drop-in fuels (IRENA, 2017), not
requiring separate refuelling infrastructure.
At European level, the Renewable Energy Directive recast (RED II) (EC, 2018)
contains a set of criteria, which an alternative fuel must meet in order to be
considered sustainable. Based on RED II, sustainable biofuels (made in facilities
beginning operation after 2020) will have to achieve GHG savings of at least 65%
respect to the road fossil fuel comparator; other sustainability criteria in the RED
and RED II require that the biofuel feedstock has not been grown in areas converted
from land with previously high carbon stock such as wetlands or forests; and does
not come from land which has high biodiversity. Beyond these criteria, the RED and
RED II also include non-mandatory socio-economic sustainability criteria on the
impacts of biofuels production. At international level, CORSIA initiative (ICAO,
2017) limits the definition of sustainability to minimum GHG emissions reduction
threshold compared to the jet fuel baseline and to carbon stock concerns defining
what it is called as Sustainable Aviation Fuel (SAF).
The RED II includes aviation as an opt-in at the discretion of EU Member States and
defines no mandates for this transport mode: a multiplier factor of 1.2 has been
introduced, towards the mandated renewable energy target in transport.
16You can also read