Sustainable Marine Biofuel for the Dutch Bunker Sector - ART ...
←
→
Page content transcription
If your browser does not render page correctly, please read the page content below
Sustainable Marine
Biofuel for the Dutch
Bunker Sector
Assessing the extent to which current policies lead to achieving
shipping sector targets

Final Report
August 2018
Author:
Peter Grijpma –Master student Utrecht University
Supervisors:
Eric van den Heuvel – Netherlands Platform Sustainable Biofuels
Martin Junginger – Utrecht University

Platform Duurzame Biobrandstoffen Kosterijland 15, 3981 AJ Bunnik
KvK: 66963850 contact@platformduurzamebiobrandstoffen.nl
Triodos bank: NL40 TRIO 0338 4321 24 twitter: @PlatfDuurzBiobr
BIC TRIONL2U www.platformduurzamebiobrandstoffen.nl
BTW: 8567.72.999.B01
Sustainable Marine Biofuel for the
Dutch Bunker Sector
Assessing the extent to which current policies lead to achieving
shipping sector targets

Final Report

Date: August 2018
Written by: Peter Grijpma, Master Student University
 Utrecht
Context: Internship project

Creative Commons License.
Platform Duurzame Biobrandstoffen, 2018
Kosterijland 15
3981 AJ Bunnik
the Netherlands
Contact:
06-83223098
contact@platformduurzamebiobrandstoffen.nl
www.platformduurzamebiobrandstoffen.nl

 2
Acknowledgements
I would like to thank Eric van den Heuvel and Loes Knotter for their undying support
throughout this project, their supervision and for always being willing and available to
address my questions. I would like to thank Martin Junginger for his supervision from the
University of Utrecht. I would like to thank Tijs Lammens and Sjors Geraedts for making
time available for me to interview them as well as their prompt and thorough replies to
all my follow-up questions.
Finally, I would like to extend a special word of gratitude to Joost van Stralen, who
devoted dozens of hours to performing model simulations and responding to my
questions and without whom this research would not have been possible.
Peter Grijpma

 3
Table of content

Acknowledgements 3
Table of content 4
1 Introduction 6
 1.1 Context 6
 1.2 Research aim and research question 8
 1.3 Scientific and societal relevance 8
 1.4 Reading guide 9
2 Legislation 10
 2.1 International 10
 2.1.1 Energy Efficiency and Design Index (EEDI) 10
 2.1.2 Ship Energy Efficiency and Management Plan (SEEMP) 11
 2.1.3 Non-GHG Emissions and Emissions Control Areas (ECAs) 11
 2.2 EU 13
 2.2.1 Renewable Energy Directive (Directive 2009/28/EC) (RED I) 13
 2.2.2 Fuel Quality Directive (Directive 98/70/EC) 14
 2.2.3 EU Sulphur Directive ((EU) 2016/802) 14
 2.2.4 Renewable Energy Directive for the period 2021-2030 (RED II) 14
 2.3 Netherlands 15
 2.3.1 Implementation of the Renewable Energy Directive 16
 2.3.2 Shipping emission policies 17
 2.3.3 Summary 17
3 Marine biofuel production pathways 19
 3.1 Chemical production pathways 19
 3.1.1 Straight Vegetable Oils (SVO) 19
 3.1.2 Fatty Acid Methyl Esters (FAME) 19
 3.1.3 Hydrogenated Vegetable Oils (HVO) 20
 3.2 Thermochemical conversion via bio-crude upgrading 20
 3.2.1 Hydrothermal Liquefaction (HTL) 20
 3.2.2 Refinery co-processing 21
 3.3 Thermochemical conversion via biomass gasification 22
 3.3.1 Fischer-Tropsch (FT) 23
 3.3.2 Bio-methanol 23
 3.3.3 Bio-dimethylether (Bio-DME) 23
 3.4 Bio-LNG 24
4 Scenarios for biofuel demand present-2030 26
 4.1 EU international shipping energy demand present-2030 27

 4
4.2 Biofuel requirements for meeting the IMO GHG reduction target 31
 4.3 Fuel mix 31
5 Biofuel deployment scenarios 33
 5.1 Introduction 33
 5.2 RESolve-biomass model 33
 5.3 Model assumptions 34
 5.4 Results 35
 5.4.1 Scenarios for biofuel deployment under RED II 35
 5.4.2 Scenarios for biofuel deployment under IMO target 38
6 Conclusions and recommendations 41
Annexes 43
 Annex I – Biofuel deployment scenarios 43
 Annex II – Parity price calculation 47
References 48

 5
1 Introduction
1.1 Context
In the 2015 Paris climate agreement 195 signatories recognized climate change as an
urgent threat and agreed to the need to hold the increase in global average
temperature to below 2⁰ C above pre-industrial levels (UNFCCC, 2015). In order to meet
this objective, it is imperative that society transition away from fossil fuels as its primary
energy source and move increasingly towards alternatives with low GHG emissions.
Accordingly, in the 2017 Dutch coalition agreement the Dutch government has
expressed the ambition to reduce GHG emissions by 49% relative to 1990 levels by
2030, with the intention of realising further reductions by 2050 to meet the goals of the
Paris agreement.
However, due to their international character the aviation and shipping sectors are not
covered by the Paris agreement (IMERS, 2016). The aviation and international shipping
sectors have both adopted industry-wide targets for the reduction of GHG emissions
through their UN standards setting organizations, the ICAO and IMO respectively. The
aviation sector aims to achieve carbon neutral growth by 2020 and halve emissions by
50% by 2050 relative to 2005 levels (IATA, 2018). As of 13 April 2018, the IMO aims to
reduce GHG emissions from international shipping by at least 50% relative to 2008
levels by 2050 (IMO, 2018a).
In 2015, EU shipping emissions comprised of 12,8% of total EU transport emissions
(EEA, 2017a). While several possibilities for alternative energy sources exist for stationary
energy users, the challenges of large-scale energy storage at sufficient density and cost
(Lloyd’s, 2017) place significant constraints on the options to reduce GHG emissions in
the transportation sector (Agrawal et al., 2007). As these challenges become more acute
for longer transportation distances and greater cargo weights (EC, 2013a), it is expected
that the heavy vehicle transport, aviation and shipping sectors will continue to exhibit a
heavy reliance on energy-dense gaseous and liquid fuels for the foreseeable future (EC,
2013a). This has put forth sustainable biofuels as a promising alternative for reducing
emissions in these sectors in the short- and medium-term.
A modest uptake of sustainable biofuel in the road transport sector has been present for
some time, comprising 3.0% (13.4 PJ) of road sector energy consumption in the
Netherlands in 2015 (excluding double counting) (CBS, 2016a; CBS, 2016b;
EurObserver, 2017) and 3.7% (603 PJ) in the EU in 2015 (EurObserver, 2017; EEA,
2017b), principally as a result of blending mandates included in the Renewable Energy
Directive (EC, 2017).
The aviation sector has also been actively engaged with implementing the use of
sustainable aviation biofuel for a number of years (IRENA, 2017) and has since witnessed
a number of important developments. These include numerous biofuel demonstration
flights starting from 2006 (ETIP Bioenergy, 2018a), the decision to include aviation in the
EU Emission Trading System in 2008 (EU, 2009), ICAO agreement in 2010 to strive for
carbon neutral growth by 2020 and halve emissions by 2050 relative to 2005 (ICAO,
2010) and formal adoption of the CORSIA resolution to offset growth in aviation
emissions past 2020 in 2016 (ICAO, 2016). This has been followed by ASTM certification
of HEFA derived biofuel in 2011 (ASTM, 2011) and more recently the instigation of multi-
stakeholder supply chain initiatives for the commercial provision of sustainable aviation
biofuel (IRENA, 2017).
However, while the aviation sector has moved beyond strategy formulation and proof-of-
concept demonstrations on to commercialization initiatives, comparable efforts in the

 6
shipping sector are considerably less developed, with a formal agreement on CO2
reduction targets having only been reached as of 13 April 2018.
Technology roadmaps can serve a useful purpose in managing and implementing
technological transitions (McDowall, 2012). They do so by identifying which parties are
likely to play a relevant role in the transition (McDowall, 2012), identifying specific
technology and policy needs (IEA, 2014) and engaging stakeholders and forming
consensus on the preferred technological pathways (IEA, 2014). This in turn allows
informed and strategic decision making on the part of government and industry
stakeholders (IEA, 2014) and can help to foster alignment of stakeholder actions as well
as research, investment and policy goals around a strategic vision (IEA, 2014).
In order to develop an effective strategy for implementing the use of Sustainable Marine
Biofuel (SMB) in the shipping sector and allow for the formulation of a roadmap to
support achieving industry targets, greater insight is required into which feedstock-
technology pathways offer the potential to contribute substantially to shipping GHG
emission reductions and into the extent to which they are sustainable, economical and
supported by the legislative environment.
The aspects of sustainability and economics of biofuels in conjunction with the nature of
the legislative environment critically determine the efficacy and viability of biofuels as a
component of climate change mitigation strategies and are therefore central to any
actionable deployment strategy. Accurate emissions data are a prerequisite for the
effective management of climate mitigation efforts and hence reliable carbon accounting
mechanisms for biofuel emissions should be in place (Shishlov & Cochran, 2016). Wider
sustainability concerns1 also need to be addressed, however, for biofuels to gain social
acceptance and to enable their widespread adoption (de Jong et al, 2017). Finally,
economic viability has to be achieved either through regulatory requirements (mandates,
prohibitions) or through cost competitiveness with fossil alternatives, potentially in
conjunction with policy support measures (FAO, 2013). The legislative environment is of
pivotal influence on the attainment of these preconditions. It is therefore necessary to
examine the merit of biofuels for climate mitigation in light of their sustainability,
economics and relation to the legislative environment.
The Netherlands is a large supplier of bunker fuel to the international shipping sector2
and holds an important position internationally. The amount of bunker fuel sold from
Dutch ports annually (533 PJ in 2016 (CBS, 2016b)) is equal to roughly 1.2 times the
energy used in the Dutch road transport sector (448 PJ in 2016 (CBS, 2016b)). The Dutch
international shipping sector therefore offers a large potential for GHG emission
reductions and is of sufficient size to offer valuable insights into the role biofuels can play
in shipping globally. In addition, in the 2016 ‘Energie Agenda’ the Dutch government
expressed that in light of industry targets and expected future legislation, carbon
intensive operations associated with the provision of bunker fuels might put the
Netherlands’ future competitive position under pressure (GovNed, 2016). Furthermore,
the Dutch chemical industry fulfils an important function in the Dutch economy and
holds a competitive position internationally yet has few options to untether itself from
fossil fuels. Biobased resources offer the industry a way to do so but have not yet
reached the stage of technological maturity to be viable. The development of biofuel
supply chains for other sectors allows part of the cost, schedule and technology risk
associated with technological maturation, feedstock mobilization and capacity

1
 E.g. water use, land use, air quality, health effects, socio-economic factors, displacement effects, food
security, and biodiversity
2
 The term ‘international shipping sector’ is used in this report to refer to the ‘deep-sea’ and ‘short-sea’
shipping sectors and excludes the ‘inland’ shipping sector.

 7
deployment to be retired so that the Dutch chemical sector is in a position to transition
away from fossil resources when future legislation so requires.

1.2 Research aim and research question
 While the Renewable Energy Directive contains a binding target for renewable energy
adoption in the transport sector as a whole, there are currently no binding legislative
requirements for renewable energy adoption in the shipping sector specifically.
However, any renewable energy supplied to the shipping or aviation sectors does count
towards the obligation for renewable energy adoption in the transport sector as a whole.
This raises the question of what level of biofuel adoption can be expected to occur in
the absence of a binding shipping sector target.
As the shipping sector can make use of lower quality fuels than the road and aviation
sectors, it is possible that SMB may be produced at reduced cost relative to road and
aviation quality biofuel. This would increase the economic viability of SMB and lower the
threshold for its adoption. The hypothesis that some level of biofuel adoption in the
shipping sector will occur in the absence of a binding sector target, therefore, warrants
further investigation.
In order to develop an effective strategy for achieving industry targets, insight is
required into the level of renewable energy adoption current policies are likely to result
in and hence the extent to which additional efforts are required. Therefore, the following
research question is formulated:
What level of sustainable marine biofuel adoption can be expected in the Dutch
international shipping sector by 2030 under the current legislative environment and how
can sustainable marine biofuel cost-optimally enable GHG emission reductions by 2030
consistent with industry targets?
A number of scenarios are developed in support of this endeavour by making minimal
assumptions with regard to future legislative conditions up to 2030 and making use of
the best current knowledge on sustainable marine biofuel production methods. Based
on these scenarios, a number of biofuel deployment scenarios were formulated through
the use of the RESolve-Biomass model. The RESolve-Biomass model allows for the
determining of the cost-optimal deployment of biofuel production pathways to achieve
a given share of renewable energy through using policy information and techno-
economic data on biofuel production technologies. These deployment scenarios were
then analysed for their level of sustainable marine biofuel adoption, nature of technology
deployment, interaction between demand sectors and other factors affecting sustainable
marine biofuel adoption, in order to gain insight into what would be required to reach a
certain adoption level and which adoption targets might be considered achievable.
These insights may then be used to guide the development of a roadmap for the
implementation of sustainable marine biofuel in the Dutch international shipping sector.

1.3 Scientific and societal relevance
A comprehensive overview of the possibilities for reducing GHG emissions through the
use of SMB in the Dutch international shipping sector contributes to the knowledge base
on the options for decarbonisation in shipping. This may be used as input for the
formulation of a roadmap. In addition, insight into the cost-optimal mix of feedstock-
technology pathways to offer sizable volumes of biofuel to the Dutch international
shipping sector allows government and industry stakeholders to make informed
decisions with regard to policy, investments and R&D efforts and supports the
development of strategy for biofuel implementation. Decarbonising the Dutch
international shipping sector also serves to secure the Dutch port of Rotterdam’s

 8
competitive position from future GHG reduction obligations and maintains and
contributes to the port’s ‘license to operate’ (van den Bosch et al, 2011). Finally,
shedding light on which feedstock-technology pathways have a high likelihood of being
cost-optimal for the provision of biofuel yields insights that can be of value for the
development biofuel supply chains in Netherlands.

1.4 Reading guide
Chapter 2 will outline the legislative context relevant to sustainable marine biofuel
adoption on the international, EU and Dutch level. Chapter 3 describes pathways for the
production of biofuels that can be used as marine fuels and provides a techno-economic
assessment for two production pathways. Chapter 4 illustrates how the scenarios for
energy demand in the EU international shipping sector were developed. Chapter 5
describes the working of the RESolve biomass model, the assumptions made in model
runs and the results of the model runs for biofuel deployment. Chapter 6 presents the
conclusions and recommendations of this report and provides an answer to the research
question. Chapter 7 contains the annexes and chapter 8 contains the references.

 9
2 Legislation
2.1 International
Shipping is regulated at the international level by the International Maritime
Organisation (IMO), a specialised body of the United Nations. The IMO was founded in
1948 as the “Intergovernmental Maritime Consultative Organisation” and was meant as
a forum for intergovernmental cooperation for the promotion of maritime safety and to
facilitate international trade (UN, 1948). Its role has since evolved to include all matters
related to shipping safety, environmental performance and the establishment of a level
playing-field for international commerce (IMO, 2018b). The IMO considers the
promotion of sustainable shipping and sustainable maritime development as one of its
top priorities (IMO, 2018b). Examples of shipping aspects covered by IMO measures
include ship design, construction, equipment, manning, operation and disposal (IMO,
2018b). In addition, the IMO provides a forum for stakeholders including member states,
civic society and the shipping industry to work together to develop and implement
global standards with regard to maritime education and training, maritime security,
energy efficiency, maritime traffic management, new technology and innovation and the
development of maritime infrastructure (IMO, 2018b), with the ultimate aim of providing
a unified institutional framework for the global maritime transportation system (IMO,
2018b). This has led to the development of over 60 binding international treaties (IMO,
2018c). The most important of which regarding GHG emissions is the 1973 International
Convention for the Prevention of Pollution from Ships, commonly known as MARPOL for
maritime pollution (Hsieh & Felby, 2017). The treaty is divided into six annexes according
to the type of pollutant that, through the adoption of successive amendments, have
become more comprehensive over time. Annex VI deals with the prevention of air
pollution from ships (IMO, 2018d). The most important policies under MARPOL Annex VI
affecting GHG emissions and biofuel adoption are the Energy Efficiency and Design
Index, the Ship Energy Efficiency and Management Plan and the implementation of
Emission Control Areas. These are discussed below.

2.1.1 Energy Efficiency and Design Index (EEDI)
The Energy Efficiency and Design Index was adopted at the 62nd Marine Environment
Protection Committee in 2011 (MEPC 62) and is intended to improve the specific fuel
consumption of ships covered by the measure (Hsieh & Felby, 2017). It applies to all
newly built ships from 2013 onwards. According to IMO, the EEDI is intended to
“stimulate continued innovation and technical development of all the components
influencing the fuel efficiency of a ship from its design phase.” (IMO, 2011).
The EEDI sets a mandatory upper-bound on the allowable CO2 emissions per amount of
transport work delivered as measured in grams of CO2 per tonne-mile of cargo
transported. It prescribes a different limit for each ship type identified in the measure.
The following ship types are identified: oil tankers, bulk carriers, gas carriers, general
cargo, container ships, refrigerated cargo and combination carriers. For each type of
ship, the reference value of the limit is equal to the average for ships of that type built
between 2000 and 2010 for the period 2013-2015. The limit is to be tightened every five
years from then onwards, starting with a 10% reduction with respect to the reference
value for the period 2015-2020. Limits have been established until 2030, with a 20%
reduction relative to the reference value for the period 2020-2025 and a 30% reduction
for the period 2025-2030.
By not prescribing a particular technology for achieving the required performance and
leaving the choice of how to comply with the regulation up to the industry – while at the
same time tightening the standards every five years - the IMO hopes to stimulate the

 10
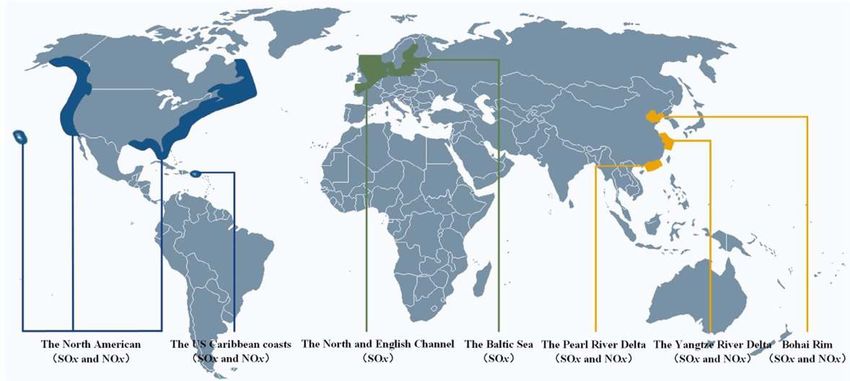
development of innovative and cost-effective approaches to improving energy efficiency
on a continual basis (IMO, 2011).

2.1.2 Ship Energy Efficiency and Management Plan (SEEMP)
Whereas the Energy Efficiency and Design Index only applies to ships built after 2013,
the Ship Energy Efficiency and Management Plan applies to all ships 400 gross tonnes
and above (Hsieh & Felby, 2017). It establishes a mechanism to review industry best
practices for the fuel-efficient operation of ships (IMO, 2011). It mainly focuses on
operational practices like slow steaming, but also includes the review of new
technologies such as waste heat recovery systems or new propeller designs (IMO, 2011).
It focuses on the monitoring of ship efficiency through monitoring tools such as the
Energy Efficiency Operational Indicator (EEOI) (E4tech, 2018) and to track improvements
in efficiency over time. The EEOI allows ship operators to quantify the effect of any
changes made to improve the energy efficiency of ships, such as more frequent
propeller or hull cleaning, improved journey planning or the introduction of technical
measures (IMO, 2011).
The SEEMP requires all ships of 5000 gross tones to submit fuel consumption data,
along with cargo and transport work information, for each type of fuel used aboard the
vessel (E4tech, 2018). This data collection is aimed to provide the basis for future GHG
reduction measures as well as to track the progress and relative success of adopted
measures.

2.1.3 Non-GHG Emissions and Emissions Control Areas (ECAs)
MARPOL Annex VI introduced global limits on the emission of SOx, NOx and particulate
matter and established the creation of Emissions control Areas (ECA). ECAs are
jurisdictions where more stringent limits on the emission of SOx (currently all ECAs) and
NOx (all ECAs from January 2019 onwards) apply than is the case outside ECAs. There
are currently four ECAs under MARPOL Annex VI: the Baltic Sea ECA, the North Sea
ECA, the North American ECA and the United States Caribbean ECA (IMO, 2018e), as
shown in Figure 1 below:

Figure 1. Map of Emissions Control Areas (ECAs) (Zhen et al., 2018)

The global limit on fuel sulphur content is currently 3,5% on a mass basis and is set to be
reduced to 0,5% from January 2020 onwards (IMO, 2018e). The sulphur limit inside
ECAs at present is set to 0,1%, down from its previous level of 1% since 2015 (E4tech,
2018). The stricter sulphur limit inside ECAs renders regular Heavy Fuel Oil unusable
without further post-combustion treatment (E4tech, 2018). The current global limit of
3,5% does allow the use of most HFOs. This has led to ships carrying another more
expensive, low-sulphur fuel for use when inside ECAs such as Marine Gas Oil (MGO),

 11
Marine Diesel Oil (MDO) or Low-Sulphur (LSHFO) or Ultra Low-Sulphur HFO (ULSHFO)
(E4tech, 2018).
The regulation on NOx emissions follows a similar structure to SOx emissions, with a
global limit and a lower limit inside ECAs. Currently only the North American and
Caribbean ECAs have a separate NOx limit, but this is set to extent to the Baltic and
North Sea ECAs from January 2019 onwards thereby harmonizing NOx regulation across
ECAs. There are currently three tiers of NOx limits that are tied to the rated engine
speed, as illustrated in Figure 2 below:

Figure 2. Tiers of NOx emission limits (E4tech, 2018)

Tier I applies to engines in ships built between 2000 and 2010. Tier II came into force in
January 2011 and applies to marine diesel engines on ships built in or after 2011 (Hsieh
& Felby, 2017). Both the tier I and tier II limits are global limits. Tier III came into effect in
January 2016 and applies to marine diesel engines of more than 130 kW on ships built in
or after 2016 when operating inside of an ECA (Hsieh & Felby, 2017).
The strengthening of the global SOx limit in 2020 will also require post-combustion
treatment of HFO type fuels outside of ECAs and can be expected to affect significant
fuel, fuel market and technology changes in order to ensure compliance (Hsieh & Felby,
2017). It remains to be seen whether and to what extent this will precipitate increased
consumption of low-sulphur fuels, adoption of post-combustion treatment technology
such as SOx scrubbers or a switch to alternative fuels such LNG or biofuels (Hsieh &
Felby, 2017). The regulation is expected to lead to a decrease in HFO consumption, as
the only HFO consumers will be those that have SOx scrubbers installed on board (Hsieh
& Felby, 2017). This is expected to lead to a decrease in demand for HFO and resulting
lower HFO prices, in turn affecting refinery operations which will have to invest in
desulphization and hydrotreating facilities (Hsieh & Felby, 2017). SOx scrubbers reduce
fuel economy, while the increased processing at refineries is associated with increased
energy and hydrogen consumption (Hsieh & Felby, 2017). Thus, the regulation to reduce
SOx emissions is likely to lead to an increase in CO2 emissions from the system
perspective (Hsieh & Felby, 2017; E4tech, 2018).
At the time of writing, no reports could be found of developments to introduce further
SOx or NOx regulation beyond those currently adopted. This includes further tightening
of current SOx or NOx limits, development for the tier III NOx limits to apply globally, or
the introduction of new ECAs.
 12
2.2 EU
The EU is the principal supranational organisation with jurisdiction to develop and issue
policy, regulation and other legislation in Europe and has significant potential influence
on the successful deployment of biofuels in the EU international shipping sector (E4tech,
2018). The EU is in favour of a global approach to reducing emissions from international
shipping and has therefore refrained from issuing policy in this domain (EC, 2018a). The
EU supports the IMO’s efforts regarding maritime GHG emissions, including MARPOL
Annex VI and the IMO’s reduction target (E4tech, 2018). The EU has taken initial steps to
integrating maritime emissions in its GHG reduction policy through the issuance of a
strategy document in 2013 (EC, 2013b) and a requirement for ships 5000 GT and above
entering EU ports to monitor and report detailed information on fuel consumption,
transport work and GHG emissions, starting from January 2018 (EC, 2018a). Despite a
general lack of targeted measures, there are a number of EU policies that indirectly
affect shipping GHG emissions in the EU. These will be set out in the remainder of this
chapter.

2.2.1 Renewable Energy Directive (Directive 2009/28/EC) (RED I)
The Renewable Energy Directive (RED) was adopted in 2009 and is the overarching
policy framework for the promotion of renewable energy in the EU (EC, 2009). It requires
20% of the EU’s final energy consumption to be derived from renewable sources by
2020 and an amount of renewable in transport equal to 10% of each Member State’s
energy use in road and rail by 2020 (EC, 2009). The target for final energy consumption
differs per Member State based on that country’s circumstances (EC, 2009).
It is left up to each Member State to determine the specific policy instruments and
general approach to meet their targets and Member States are required to submit a
National Renewable Energy Action Plan that specifies their approach (EC, 2009). In
addition, Member States are required issue a national renewable energy progress report
every two years (EC, 2009). In 2015, Directive 2015/1513, otherwise known as the iLUC
directive (E4tech, 2018), amended the RED on a number of points.
Biofuels and bioliquids are considered instrumental in meeting the 10% renewable
energy in transport target (EC, 2009). The RED sets out sustainability criteria for biofuels
and bioliquids produced and consumed in the EU and those not in compliance with the
criteria may not receive government support or count towards renewable energy targets
(EC, 2016a). Compliance is possible through national systems or so-called voluntary
schemes recognized by the European Commission (EC, 2009). The main sustainability
criteria include a minimum GHG saving of 50% relative to fossil fuels on a life-cycle basis
(60% for new facilities) and a requirement that the raw materials for the production of
biofuels or bioliquids may not be sourced from (EC, 2016a):
 • Land with high biodiversity
 • Land with high carbon stock
 • Land that was peat land before January 2008
In addition, the RED also includes a number of reporting requirements for fuel providers,
Member States and the EC on, for example, the effectiveness of the directive in limiting
indirect land-use change (iLUC) GHG emission and the estimated value of ILUC
emissions (PWC, 2017).
The RED also includes a cap of 7% on biofuels produced from certain feedstocks known
as ‘conventional’ or crop-based biofuels (E4tech, 2018). Feedstocks which are not
subject to this cap are listed in Annex IX-A and IX-B of the Directive 2015/1513, also
known as the iLUC directive (E4tech, 2018). Member States are required to set a target
of no less than 0,5% for energy from biofuels produced from Annex IXa feedstocks by
 13
2020. The target is indicative and Member States are allowed to set a lower target if
certain criteria are met. These criteria are broad enough, however, that there is no real
pressure on Member States to refrain from setting a lower target or no target should
they wish to do so (E4tech, 2018). However, the Netherlands have transposed the target
into national law above the suggested 0,5% at 0,6% for 2018, 0,8% in 2019 and 1,0% in
2020 (E4tech, 2018). This includes double counting such that the physical amount of
energy equals 0,5%.
In order to comply with the 10% target, the actual energy supplied to the transport
sector may be multiplied by a certain factor for certain sources of renewable energy.
These are known as multipliers and are 2 times for biofuels produced from feedstocks
listed in Annex IX-A and IX-B and 5 times for electricity from renewable sources
consumed by road vehicles (E4tech).

2.2.2 Fuel Quality Directive (Directive 98/70/EC)
The Fuel Quality Directive (FQD) was adopted in 1998 and subsequently amended in
2009 by Directive 2009/30/EC and again in 2015 by Directive 2015/1513 (PWC, 2017). It
applies to petrol, diesel and biofuels used in road transport as well as gasoil used in non-
road mobile machinery. It sets common fuel specification standards for the EU primarily
for the control of substances linked to air pollutant emissions, such as sulphur (EC,
2018b). Along with the Renewable Energy Directive it also regulates the sustainability of
biofuels (EC, 2018b).
The 2009 amendment introduced a requirement for suppliers to reduce the GHG
intensity of fuel supplied to the EU market for use in road transport by 6% by 2020 (EC,
2018b). Emission reductions are relative to 2010 levels and are calculated on a life-cycle
basis including the emissions from the extraction, processing and distribution of fuels
(EC, 2018b). It is expected that these emission reductions will be primarily achieved
through the use of biofuels (E4tech, 2018). In order for biofuels to count towards the
GHG reduction target they must comply with the same sustainability and reporting
criteria the Renewable Energy (E4tech, 2018). Fuels supplied to the marine and aviation
sector are not covered by the FQD (PWC, 2017).

2.2.3 EU Sulphur Directive ((EU) 2016/802)
The EU Sulphur Directive was last updated in 2016 and follows developments at the
international level under MARPOL Annex VI (EMSA, 2018). It regulates the sulphur
content of gas oils and heavy fuel oils used for marine and land-based applications
(E4tech, 2018). It establishes a Sulphur Emission Control Area (SECA) that coincides with
the North Sea and Baltic Sea ECAs defined in MARPOL Annex VI, allowing those ECAs
to be enforced under EU law (E4tech, 2018).
The sulphur content of fuels is restricted to 0,1% (by mass) for fuels used inside the
SECA and 3,5% for fuels used in EU waters outside the SECA. For passenger ships, the
sulphur content is limited to 1,5% outside the SECA due to their proximity to shore
(E4tech, 2018). The directive also sets a 0,1% limit for fuels used by ships berthing at EU
ports and it prohibits the sale of marine gas oils with a sulphur content above 0,1%
(E4tech, 2018).
The directive applies to all shipping sectors, but it is of note that the inland shipping
sector is already subject to much stricter limit under the FQD of 0,001% (E4tech, 2018).

2.2.4 Renewable Energy Directive for the period 2021-2030 (RED II)
On 14 June 2018 negotiators from the three EU institutions reached an informal
agreement on the Renewable Energy Directive II (EU Council, 2018). At the time of
writing negotiations are ongoing and the information presented here is based on what is
published up to June 21, 2018.
 14
The RED II forms the continuation of the RED I and sets EU renewable energy policy for
the period 2021-2030. It establishes, among others, an overall renewable energy target
of 32% by 2030. For each Member State, it sets a target for renewable energy in
transport of at least 14%. This target may be lowered based on a Member State’s cap on
crop-based biofuels. The cap may be at most 7% of energy consumed in the road and
rail sectors and may not exceed a Member State’s contribution of crop-based biofuels in
2020 plus 1%. Member States may implement a cap of 2% regardless of their crop-
based contribution. It sets a cap of 1,7% on feedstocks from Annex IX-B, such as used
cooking oil and animal fats, that may be lifted with the consent of the European
Commission. In addition, it includes a sub target of 3,5% by 2030 for biofuels produced
from feedstocks listed in Annex IX-A.
As under the RED I, targets may be wholly or partially achieved by applying a multiplier
to an amount of energy supplied under certain conditions. This means that the actual
energy supplied is likely to be substantially lower than the targets indicate. The
multipliers in effect under RED II are as follows:
 • 2x for biofuels produced from feedstocks listed in Annex IX-A and IX-B
 • 1,2x for biofuels supplied to the marine and aviation sector that may be applied in
 conjunction with the above mentioned 2x multiplier
 • 4x for electricity from renewable sources used in road transport
 • 1,5x for electricity from renewable sources used in rail transport
Biofuels that are believed to pose a high risk of iLUC emissions, will be capped at a
Member State’s level of production in 2019 unless they can be certified as ‘low iLUC risk
biofuels’. This cap is to be gradually reduced from 2023 onwards to 0% by 2030. The
European Commission is to adopt concrete criteria and a list of feedstocks for these high
iLUC biofuels by December 2020.

2.3 Netherlands
At the national level, the Dutch government has the potential to issue policy and
regulations that can affect all types of shipping that take place within the Netherlands
(E4tech, 2018). However, due to the international nature of shipping, particularly the
deep-sea and short-sea shipping sectors, enacting legislation that is stronger than for
other countries may induce adverse economic effects (E4tech, 2018). The Dutch
government therefore recognises the need to seek to implement policy on the EU and
international level (E4tech, 2018). This is illustrated in the 2016 ‘Energy Agenda’, which
stresses the need for international action to combat GHG emissions “in order to
maintain the Dutch international competitive position in ocean shipping” (Gov’t NL,
2016).
EU policies are implemented at the national level, meaning that the requirements of the
EU Sulphur Directive and the Fuel Quality Directive are also part of Dutch law (E4tech,
2018). The Renewable Energy Directive leaves its specific implementation up to Member
States and this is discussed later on in this chapter.
Dutch policy in relation to energy and transport policy is focussed on reducing GHG
emissions (E4tech, 2018), with the Ministry of Economic Affairs and Climate and the
Ministry of Infrastructure and Water management being the main bodies overseeing its
development and implementation (E4tech, 2018). The most important policy documents
governing Dutch energy policy are (E4tech, 2018):
 • The 2013 Energy Agreement
 • The 2016 Energy Report
 • The 2016 Energy Agenda

 15
The 2013 Energy Agreement was negotiated by the government and a large number of
stakeholders and societal organisations in 2013 (SER, 2013). It consists of a high-level
roadmap detailing Dutch energy ambitions and targets for the period 2013-2023
(SER,2013). It also includes agreement on a 60% reduction target relative to 1990 levels
for CO2 emissions in transport by 2050 (SER, 2013). It focuses heavily on the power
sector (E4tech, 2018) and establishes financial incentives for the promotion of energy
savings and renewable electricity (SER, 2013). It sets a target of 14% and 16% renewable
energy in final use by 2020 and 2023, respectively (SER, 2013).
The 2016 Energy report focuses on the period 2023-2050 and highlights transport as
one of four sectors targeted for GHG reduction (Min. EA, 2016b). It mentions biofuels as
the best alternative to fossil fuels for heavier and longer distance transport by road, sea
and air (Min. EA, 2016b). However, it states that the supply of biomass for bioenergy
production could be limited due other possible economic uses, such as food production
(Min. EA, 2016b). It puts forth the Netherlands as a proponent of stricter international
limits on emissions from shipping and aviation and stricter EU limits on emissions from
road transport (Min. EA, 2016b).
The 2016 Energy Agenda outlines GHG reduction strategy up to 2050 and highlights
international agreements as the preferred method of achieving emission reductions in
international long-distance transport (Min. EA, 2016a). It expresses a commitment to
LNG, biofuels, fleet renovation and improved journey planning as means of achieving
CO2 reduction targets but doesn’t offer specific policies or provide details on what
these options would contribute (Min. EA, 2016a).

2.3.1 Implementation of the Renewable Energy Directive
The RED was transposed into Dutch law in 2011 through amendments to Environmental
Management Act (Wet Milieubeheer), the Decree on Renewable Energy in Transport
(Besluit Hernieuwbare Energie in Vervoer) and the Regulation on Renewable Energy in
Transport (Regeling Hernieuwbare Energy in Vervoer) (CMS, 2011). This has resulted in a
Renewable Energy Obligation (HEV) on parties delivering fuel to the Dutch market (NEa,
2018a). Parties delivering less 500.000 litres of diesel or gasoline a year are absolved
from the obligation (NEa, 2018a).
The Dutch targets for renewable energy in transport are stricter than the RED proposes
at 8,5% in 2018, 12,5% in 2019 and 16,4% in 2020 (NEa, 2018a). Fuel suppliers are
required to report the total amount of fuel and the amount of renewable energy they
have supplied to the Dutch market to the Netherlands Emissions Authority (NEa) by
registering the amounts in the Registry Energy for Transport (REV) (Register Energie voor
Vervoer) (Gov’t NL, 2016; NEa, 2018b). Obligations are managed through the use of
Renewable Fuel Units (HBE’s), where one HBE equals 1 GJ of renewable fuel (NEa,
2018b). The multipliers (see chapter 2.1) are incorporated into the HBE system by
awarding an amount of HBE’s corresponding to the multiplier (e.g. 1,2 HBE’s for 1 GJ of
conventional biofuel supplied to the marine sector proposed in the RED II) (E4tech,
2018). There are three types of HBE’: HBE-C’s for conventional biofuels, HBE-G’s for
biofuels from Annex IXa feedstocks and HBE-O’s for biofuels from Annex IXb feedstocks
(NEa, 2018a). There is a trading system for HBE’s, meaning that parties can acquire
HBE’s by supplying renewable fuel themselves or by buying HBE’s from other parties
that have delivered renewable fuel in excess of their required amount (E4tech, 2018).
However, HBE’s cannot be traded outside of the Netherlands (E4tech, 2018). Each year
the NEa verifies whether fuel suppliers have fulfilled their obligation by verifying that
they have correct amount of HBE’s in their REV account (NEa, 2018b). Parties that have
more than their required amount of HBE’s at the end of the year may transfer a certain
percentage to the following year. Parties that have not met their obligation are to
receive a fine (Gov’t NL, 2018a). HBE’s are granted for renewable fuel delivered to any
 16
sector, meaning that renewable fuel bunkered in the Netherlands counts towards the
obligation regardless of whether it is consumed in the deep-sea, short-sea or inland
shipping sector (EU Council, 2018). However, these sectors are not included in the
denominator used to calculate a Member State’s renewable energy in transport
obligation, which only includes energy used in road and rail transport (EU Council, 2018).

2.3.2 Shipping emission policies
There are a number of policies that affect shipping emissions, both as part of the 2017
Rutte III coalition agreement and adopted prior to its conclusion. Under the coalition
agreement the 2016 Energy Agreement is to be replaced by a new’ climate and energy
agreement’ with a target of 49% GHG emission reduction relative to 1990 levels and it
highlights biofuels as one of the opportunities (Gov’t NL, 2017). According to (E4tech,
2018): “The new coalition agreement means that the Netherlands will produce stricter
renewable energy in transport targets than what will be included in RED II, which could
be a benefit to shipping decarbonisation.”
In 2016, the Ministry of Infrastructure and Environment signed the COBALD (Continuous
On-Board Analysis and Diagnosis) Green deal for the measuring of energy consumption
and emissions from ships in inland shipping (Port of Rotterdam, 2016). It is similar to the
IMO’s SEEMP and is intended to help older ships make investment decisions for
efficiency improvement, as well as to ensure compliance with IMO EEDI emission
reduction requirements (E4tech, 2018).
The ‘Work programme Maritime strategy and Seaports 2018-2021’ was signed off by the
coalition in 2018 and sets an ambition for zero emissions from inland shipping by 2050
(Gov’t NL, 2018b). This is aimed to be part of a new ‘Green Deal’ for ports and shipping
to be concluded by 2018. It outlines specific actions for both inland and ocean shipping
sectors along with a plan for creating an inventory of measures to help meet the IMO’s
targets (Gov’t NL, 2018b). The Maritime Strategy is required to be enshrined into law.
Regulations for port operations and port emissions for both sea and inland ports are set
by local and national bodies as well as through the transposition of EU directives
(E4tech, 2018). There are close to 300 inland ports in the Netherlands that work to
advance common interests through the Dutch Association for Inland ports (Nederlandse
Vereniging voor Binnenhavens) (E4tech, 2018). Emissions from all activities in ports,
including all ship activities and industrial are covered in the Harbour Industrial Complex
footprint. The ports of Rotterdam and Amsterdam are developing policies for reducing
shipping emissions through their port by laws (E4tech, 2018). Finally, the Environmental
Shipping Index (ESI) and the ‘Green Award’ are policy instruments that are in effect for
the promotion of the sustainable operation and management of ships (E4tech, 2018).

2.3.3 Summary
The Netherlands has implemented policies that look to promote GHG emission
reductions, increase renewable energy contributions and affect inland shipping
emissions. Many of these policies also affect the adoption of biofuels. There are no
direct regulations targeting the international sectors of shipping: deep-sea and short-sea
shipping.
In general, the political climate shows willingness to support ambitious GHG reduction
policy for all sectors, including shipping. For ocean shipping it is preferred for action to
be taken on the international level, either through the EU or the IMO, out of concern of
inducing adverse economic effects on the Netherlands’ expansive international shipping
sector. However, the Netherlands plays an active role in advocating for shipping
emission reduction policies internationally and once agreement is reached, these
policies are then swiftly implemented on the national level. Examples of this include

 17
enforcement of the EEDI and SEEMP and transposition of IMO and EU sulphur
regulations. Several policy initiatives in effect or are underway for reducing inland
shipping emissions, both on the local and the national level. These include COBALD, the
Green Deal agreement, the Maritime Strategy and the ‘Green Award’. Biofuel policy is
principally resultant from renewable energy in transport obligations under the RED/RED
II, although the Netherlands takes concerns about possible sustainability risks seriously
and at 5% has implemented a stricter cap on crop-based biofuels than required under
the REDII. However, the merits of these concerns are fervently debated at this time.

 18
3 Marine biofuel production pathways
Biofuel production pathways can be categorised in various different ways, including by
type of feedstock used, level of technological maturity or by type of conversion process
used. Here pathways are presented by type of conversion process used. The
predominant processes for the conversion of feedstocks to biofuels are: chemical
conversion, thermo-chemical conversion and biochemical conversion. With regard to
biochemical pathways, only the production of biomethane was considered for this study
as other biochemical pathways are currently at too early a stage of development to be
competitive with more developed chemical and thermochemical pathways.
Thermochemical pathways are subdivided into pathways that first produce a bio-crude
which is subsequently upgraded, and pathways that break down the biomass into its
basic components, which are then synthesized into hydrocarbon fuels. In the remainder
of this chapter the various pathways for the production of sustainable marine biofuel are
discussed.

3.1 Chemical production pathways
3.1.1 Straight Vegetable Oils (SVO)
Straight Vegetable Oils (SVOs), also known as Pure Vegetable Oil (PVO) or Pure Plant Oil
(PPO), are oil extracts from plants that can be used as a substitute for HFO in some types
of diesel engines (Hsieh & Felby, 2017). They do not undergo any intermediate
processing steps and are used directly as a fuel (Hsieh & Felby, 2017). They can be used
in low speed engines that are common in ships of all sizes used in deep-sea shipping but
require engine modifications for use in four-stroke engines commonly used in short-sea
and inland shipping (E4tech, 2018). Their high viscosity and high flash adversely affect
engine lifetimes due to the build-up of carbon deposits inside the engine and damage
to the engine lubricant. They are therefore not considered practical fuels for large-scale
or long-term use (Hsieh & Felby, 2017).

3.1.2 Fatty Acid Methyl Esters (FAME)
FAME is also known as biodiesel and is produced from vegetable oils, animal fats or
used cooking oils (UCO) through a process called transesterification. Triglycerides from
oils and fats are reacted with methanol in the presence of a catalyst to form fatty acid
methyl esters as well as glycerol and water which are later removed as waste products
(ETIP Bioenergy, 2018b). FAME is a more suitable fuel for use in diesel engines than
SVO due to both its lower boiling point and lower viscosity (E4tech, 2018). EN590
specifications allow blends of up to 7% FAME with diesel for use in short-sea and inland
shipping E4tech, 2018). However, its high could point means that at temperatures below
32° solidified waxes form in the fuel that can clog up engine filters and reduce fuel flow
properties (Hsieh & Felby, 2017). FAME is biodegradable and its higher oxygen content
leads to lower oxidation stability (Hsieh & Felby, 2017). This renders it prone to degrade
after a period of about two months (E4tech, 2018) to form acids, peroxides and various
insoluble compounds (Hsieh & Felby, 2017). The acid degradation products of FAME are
suspected of causing damage to fuel pumps, injectors and piston rings, and have led to
stricter acid specifications for marine fuels (Hsieh & Felby, 2017). Long-term storage
should therefore be avoided and close monitoring is required if the fuel is kept in fuel
tanks for more than a number of weeks (E4tech, 2018). For these reasons the Dutch
inland shipping sector has reached an agreement to no longer supply FAME in the
Dutch inland shipping sector.

 19
3.1.3 Hydrogenated Vegetable Oils (HVO)
Hydrotreatment of oils and animal fats is an alternative process to esterification to
produce a diesel substitute from biomass (ETIP Bioenergy, 2018c). This product is known
as Hydrotreated Vegetable Oil (HVO), renewable diesel, Hydrotreated Renewable Diesel
(HRD) or Hydroprocessed Esters and Fatty Acids (HEFA) (ETIP Bioenergy, 2018c). It is
free from ester compounds and does not suffer from the degradation issues that FAME
does (Hsieh & Felby, 2017). HVO production is at commercial scale (E4tech, 2018) and
makes use of existing hydrotreatment technology currently in use at petroleum refineries
(Hsieh & Felby, 2017). It therefore has improved production costs relative to pathways
that rely on less mature technologies (Hsieh & Felby, 2017). HVO is compatible with
engines that run on MDO, MGO or HFO and conforms to ISO 8271 diesel specifications
without the need for blending with petroleum diesel (E4tech, 2018). It is similar in
characteristics to MGO (E4tech, 2018). As a result, it can be used in all existing
infrastructure without requiring additional equipment modifications or blending with
other fuels. However, there is limited availability of waste oils as feedstock and a lower
price differential with road and aviation fuel may induce strong competition from these
sector (E4tech, 2018). Thus, limited fuel availability in addition to the large volumes
required for international shipping may limit its potential as GHG reduction method in
the shipping sector.

3.2 Thermochemical conversion via bio-crude upgrading
3.2.1 Hydrothermal Liquefaction (HTL)
The hydrothermal liquefaction process uses high pressure (5-25 Mpa) and moderate
temperature (250-500 °C), along with catalysts, to convert biomass into a crude-like bio-
oil (Hsieh & Felby, 2017). The product has a high energy density (LHV of 34-37 MJ/kg)
and moderate oxygen content (5-20 wt-%). The advantage of HTL over pyrolysis is that it
can process wet biomass and results in a product with a high energy density (Hsieh &
Felby, 2017). The process is reported to be able to use a wide range of feedstocks
(Steeper Energy, 2018) including woody biomass, aquatic biomass, urban sewage and
animal manures, as well as waste streams from industrial processes such as sugar
refining, oil seed milling or food processing. Water present in the biomass is sub- or
supercritical at these temperatures and pressures and acts as a solvent, reactant and
catalyst in the liquefaction process (Hsieh & Felby, 2017). Oxygen is removed from the
biomass through dehydration (loss of H2O) or decarboxylation (loss of CO2) (Hsieh &
Felby, 2017). The end product is a fuel with a high H/C ratio and low viscosity that is
suitable for use directly in heavy engines (Hsieh & Felby, 2017) or can be upgraded
further to produce fuels like gasoline, diesel or jet fuel (Hsieh & Felby, 2017). Production
is currently at pilot-scale with a plant operated by Steeper Energy in Denmark having
had 4750 hours of operation since its inception in 2013 (Steeper Energy, 2017).
Pyrolysis treatment involves subjecting biomass to high temperature (~500 °C) and high
pressure for a few seconds in the presence of an inert atmosphere to convert dry
biomass to pyrolysis-oil (Hsieh & Felby, 2017). This process, known as Fast Pyrolysis, also
produces syngas and biochar as co-products and requires the biomass to be milled and
dry before entering the pyroreactor (Hsieh & Felby, 2017). Pyrolysis-oil has a lower
energy density (LHV of 17-24 MJ/kg) than bio-oil produced through HTL, as well as a
higher oxygen content (30-50 wt-%) (Geraedts, 2018; Lammens, 2018a). Crude pyrolysis-
oil could in principle be used directly as a shipping fuel but would require significant
adaptations to the engine and the fuel feeding/injection system (Hsieh & Felby, 2017).
This, along with its high viscosity, low energy density and the fact that it does not auto-
ignite in diesel engines, makes it quite a challenging option to replace existing fuels
(E4tech, 2018). However, its characteristics and compatibility can be markedly improved

 20
by upgrading the pyrolysis-oil to reduce its oxygen content (E4tech, 2018). This can be
done through either hydrotreatment in a stand-alone unit (producing Hydrogenated
Pyrolysis Oil (HPO)) or through co-processing in a petroleum refinery (Hsieh & Felby,
2017. Fast pyrolysis technology for the production of bio-oil for co-firing purposes in
existing heat and power applications has been commercialised by a few companies and
is currently at TRL 8 (E4tech, 2018). However, the technology for upgrading is less
developed at TRL 6 for refinery co-processing and TRL 5 for the standalone route
(Lammens, 2018b).
Techno-economic assessment
A techno-economic assessment for sustainable marine biofuel production via standalone
pyrolysis oil upgrading was conducted for this research based on interviews with market
players and relevant literature. The results are summarised in the Table 1 below.
Table 1. Summary of techno-economic assessment of standalone pyrolysis oil upgrading

 Technical Economic

 Pyrolysis Value Unit Pyrolysis Costs (€/GJ biofuel)

 Capacity (input) 381 000 dry t/y Capital costs pyr. plant 2,94

 Yield bio-oil production 42% Feedstock costs 11,31

 Electricity consumption 184 940 GJ/y Electricity costs 0,84

 Bio-oil production 160 020 dry t/y Other O&M 0,58

 3 886 425 GJ/y Total pyrolysis 15,67

 Hydrotreatment Hydrotreatment

 Yield hydrotreatment 64,8% Capital costs hydroproc. 0,60

 Electricity consumption 4 145 GJ/y Hydrogen costs 4,40

 Hydrogen consumption 1 211 528 GJ/y Catalyst replacement 1,13

 Biofuel production 103 711 dry t/y Electricity + other O&M 0,14

 4 364 159 GJ/y Total hydrotreatment 6,26

 Total 21,93

3.2.2 Refinery co-processing
As an alternative to standalone hydrotreatment, bio-oil, as well as other semi-processed
biogenic feedstocks such as triglycerides or lignin, can be co-processed in existing
petroleum refineries (ARB, 2017; Stefanidis et al., 2017; ETIP Bioenergy, 2018f). Co-
processing in small amount (up to 10% by weight) has been shown to not induce
significant corrosion effects or substantially affect product yields (ARB, 2017). In contrast
to the typical blending of finished biofuels with petroleum-derived fuels, co-processing
involves the simultaneous conversion of intermediate petroleum distillates and semi-
processed biogenic products to finished fuels during the cracking or hydrogenation
stage of the traditional refining process (ETIP Bioenergy, 2018f). The process results in a
product virtually identical in chemical composition to fossil fuels, albeit with a portion of
the carbon atoms replaced by bio-carbon (Lammens, 2018b). Four refinery processes are
considered candidates for bio-oil co-processing: thermal cracking, catalytic cracking,
hydrotreating and hydrocracking (ARB, 2017; ETIP Bioenergy, 2018f). By far the most
researched and most mature of these routes is the co-processing of pyrolysis oil during
catalytic cracking in existing Fluid Catalytic Cracking (FCC) units (ARB, 2017). Co-
processing has the advantage of saving on capital costs for the establishment of

 21
standalone facilities. In addition, when co-processing in FCC units auxiliary inputs of
hydrogen or energy are typically not required due to synergistic hydrogen donation
reactions occurring as a result of the presence of the petroleum feed (ARB, 2017). These
facilitate the conversion of oxygenates to liquid hydrocarbons at the expense of a
product slightly higher in aromatics (ARB, 2017). Considering that hydrogen constitutes
a large cost component of the hydrotreatment of pyrolysis oil and is associated with
significant GHG emissions, refinery co-processing has been proposed as a promising
approach to both reduce costs and improved GHG performance (Stefanidis et al., 2017).
Co-processing is still in the development stage and commercial application is expected
in the early twenty-twenties (ARB, 2017; Lammens, 2018b).
Techno-economic assessment
A techno-economic assessment for sustainable marine biofuel production via pyrolysis
oil co-processing in an FCC unit was conducted for this research based on interviews
with market players and relevant literature. The data for pyrolysis oil upgrading via FCC
co-processing is based on interviews and correspondence with Tijs Lammens (2018a),
Lammens (2018b) and SGAB (2017). The results are summarised in the Table 2below.
Table 2. Summary of techno-economic assessment of pyrolysis oil upgrading via FCC co-
processing

 Technical Economic

 Pyrolysis Value Unit Pyrolysis Costs (€/GJ biofuel)

 Capacity (input) 381 000 dry t/y Capital costs pyr. plant 2,94

 Yield bio-oil production 42% Feedstock costs 11,31

 Electricity consumption 184 940 GJ/y Electricity costs 0,84

 Bio-oil production 160 020 dry t/y Other O&M 0,58

 3 886 425 GJ/y Total pyrolysis 15,67

 FCC co-processing FCC co-processing

 Electricity consumption 0 GJ/y Capital costs refinery 0,28

 Hydrogen consumption 0 GJ/y Refinery O&M 1,39

 Biofuel production 3 886 425 GJ/y Total co-processing 1,67

 Total 17,34

3.3 Thermochemical conversion via biomass gasification
Gasification involves the conversion of lignocellulosic biomass at high temperature (900
°C) and pressure and in the presence of some oxygen and steam into its basic
components (CO, H2 and some CO2) (Hsieh & Felby, 2017). This gas mixture is known
as syngas and can be used directly to produce heat and electricity or as fuel for gas
turbine engines (Hsieh & Felby, 2017). Alternatively, the syngas can be cleaned and used
as an intermediate product for the production of various synthetic hydrocarbon fuels.
These include long-chain hydrocarbons such as synthetic diesel or kerosene through the
Fischer-Tropsch process (Hsieh & Felby, 2017), (bio)methane via the Sabatier process
(Hsieh & Felby, 2017), (bio)methanol via catalysis (E4tech, 2018) or (bio)dimethylether
(DME) via a reaction similar to methanol catalysis. However, it is important to note that
methane, methanol and DME can be produced through a number of routes and that
direct conversion from syngas is not necessarily the most common (Hsieh & Felby, 2017).
For example, methanol is most commonly produced from methane (of fossil origin) and

 22
You can also read