An overview of wind-energy-production prediction bias, losses, and uncertainties
←
→
Page content transcription
If your browser does not render page correctly, please read the page content below

Wind Energ. Sci., 6, 311–365, 2021
https://doi.org/10.5194/wes-6-311-2021
© Author(s) 2021. This work is distributed under
the Creative Commons Attribution 4.0 License.

                       An overview of wind-energy-production
                       prediction bias, losses, and uncertainties
                                            Joseph C. Y. Lee and M. Jason Fields
            National Wind Technology Center, National Renewable Energy Laboratory, Golden, CO 80401, USA
                                  Correspondence: M. Jason Fields (jason.fields@nrel.gov)

                                      Received: 2 June 2020 – Discussion started: 10 July 2020
                          Revised: 11 January 2021 – Accepted: 19 January 2021 – Published: 5 March 2021

       Abstract. The financing of a wind farm directly relates to the preconstruction energy yield assessments which
       estimate the annual energy production for the farm. The accuracy and the precision of the preconstruction energy
       estimates can dictate the profitability of the wind project. Historically, the wind industry tended to overpredict
       the annual energy production of wind farms. Experts have been dedicated to eliminating such prediction errors
       in the past decade, and recently the reported average energy prediction bias is declining. Herein, we present a
       literature review of the energy yield assessment errors across the global wind energy industry. We identify a long-
       term trend of reduction in the overprediction bias, whereas the uncertainty associated with the prediction error
       is prominent. We also summarize the recent advancements of the wind resource assessment process that justify
       the bias reduction, including improvements in modeling and measurement techniques. Additionally, because
       the energy losses and uncertainties substantially influence the prediction error, we document and examine the
       estimated and observed loss and uncertainty values from the literature, according to the proposed framework in
       the International Electrotechnical Commission 61400-15 wind resource assessment standard. From our findings,
       we highlight opportunities for the industry to move forward, such as the validation and reduction of prediction
       uncertainty and the prevention of energy losses caused by wake effect and environmental events. Overall, this
       study provides a summary of how the wind energy industry has been quantifying and reducing prediction errors,
       energy losses, and production uncertainties. Finally, for this work to be as reproducible as possible, we include
       all of the data used in the analysis in appendices to the article.

1   Introduction                                                   an average of 3.5 % to 4.5 % P50 overprediction bias based
                                                                   on a subset of wind farms in the United States and accounting
Determining the range of annual energy production (AEP),           for curtailment (Lunacek et al., 2018).
or the energy yield assessment (EYA), has been a key part of          Such P50 overestimation results in marked financial impli-
the wind resource assessment (WRA) process. The predicted          cations. Healer (2018) stated that if a wind project produces
median AEP is also known as the P50 , i.e., the AEP expected       a certain percentage lower than the P50 on a 2-year rolling
to be exceeded 50 % of the time. P50 values are often defined      basis, the energy buyer, also known as the offtaker, may have
with timescales such as 1, 10, and 20 years. In this study, un-    the option to terminate the contract. For a 20-year contract,
less stated otherwise, we primarily discuss the 20-year P50 ,      if a wind farm has a 1 % chance of such underproduction
which is the typical expected lifespan of utility-scale wind       over a 2-year period, the probability of such an event tak-
turbines. For years, leaders in the field have been discussing     ing place within the 18 2-year rolling periods is 16.5 %, as
the difference between predicted P50 and actual AEP, where         100 % − (100 % − 1 %)18 = 16.5 % (Healer, 2018), assum-
the industry often overestimates the energy production of a        ing each 2-year rolling period is independent. Therefore,
wind farm (Hale, 2017; Hendrickson, 2009, 2019; Johnson            projects with substantial energy-production uncertainty ex-
et al., 2008). A recent study conducted by the researchers at      perience the financial risk from modern energy contracting.
the National Renewable Energy Laboratory (NREL) found

Published by Copernicus Publications on behalf of the European Academy of Wind Energy e.V.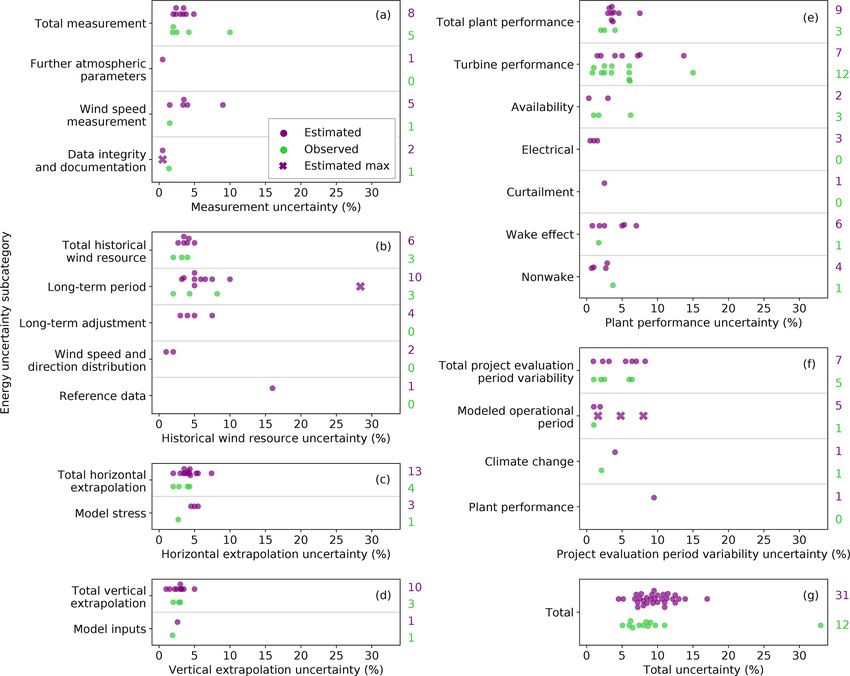
312                                        J. C. Y. Lee and M. J. Fields: An overview of wind-energy-production prediction bias

Figure 1. Mind map of energy-production loss, according to the IEC 61400-15 proposed framework. The blue and black rounded rectangles
represent the categorial and subcategorical losses, respectively. Details of each loss category and subcategory are discussed in Table A1.

   Random errors cause observations or model predictions to                 – an AEP prediction error of 1 GWh, e.g., because of
deviate from the truth and lead to uncertainty (Clifton et al.,               the P50 prediction bias, translates to about EUR 50 000
2016), and uncertainty is quantified via probability (Wilks,                  to 70 000 lost (Papadopoulos, 2019);
2011). In WRA, the P values surrounding P50 such as P90
and P95 characterize the uncertainty of the predicted AEP                   – reducing energy uncertainty by 1 % can result in
distribution. Such energy-estimate uncertainty depends on                     USD 0.5 to 2 million of economic benefits, depending
the cumulative certainty of the entire WRA process, from                      on the situation and the financial model (Brower et al.,
wind speed measurements to wind flow modeling (Clifton et                     2015; Halberg, 2017);
al., 2016). When a sample of errors is Gaussian distributed,                – a change of 1 % in wind speed uncertainty can lead to a
the standard deviation around the mean is typically used to                   3 % to 5 % change in net present value of a wind farm
represent the uncertainty of errors. Traditionally, the wind                  (Kline, 2019).
energy industry uses standard deviation, or σ , to represent
uncertainty.                                                             Experts in the industry have presented many studies on
   The WRA process governs the accuracy and precision of                 P50 prediction error, energy loss, and uncertainty for years,
the P50 , and a key component in WRA constitutes the esti-               and the purpose of this literature review is to assemble previ-
mation of energy-production losses and uncertainties. Wind               ous findings and deliver a meaningful narrative. This article
energy experts have been using different nomenclature in                 is unique and impactful because it is the first comprehensive
WRA, and inconsistent definitions and methodologies exist.               survey and analysis of the key parameters in the WRA pro-
To consolidate and ameliorate the assessment process, the                cess across the industry. The three main research questions
International Electrotechnical Commission (IEC) 61400-15                 of this study include the following:
working group has proposed a framework to classify vari-
ous types of energy-production losses and uncertainties (Fil-               – Is the industry-wide P50 prediction bias changing over
ippelli et al., 2018, adapted in Appendix A). We illustrate                   time, and what are the reasons for the changes?
the categorical and subcategorical losses and uncertainties
                                                                            – What are the ranges of different categories of energy-
in Figs. 1 and 2. Note that the proposed framework is not
                                                                              production losses and uncertainties?
an exclusive or exhaustive list of losses and uncertainties
because some institution-specific practices may not fit into                – Given our understanding on losses and uncertainties,
the proposed standard. Moreover, the proposed framework                       what are the opportunities for improvements in the in-
presented herein does not represent the final IEC standards,                  dustry?
which are pending to be published.
   The wind energy industry has been experiencing financial              From past research, in addition to the energy-production
impacts caused by the challenges and difficulties in predict-            uncertainties, we review how the industry has been quan-
ing energy-production losses and uncertainties over the life-            tifying various wind speed uncertainties, particularly from
time of a modern wind project, which can continue to operate             wind measurements, extrapolation methods, and modeling.
beyond 20 years:                                                         We also compile and present the wind speed results herein.

Wind Energ. Sci., 6, 311–365, 2021                                                             https://doi.org/10.5194/wes-6-311-2021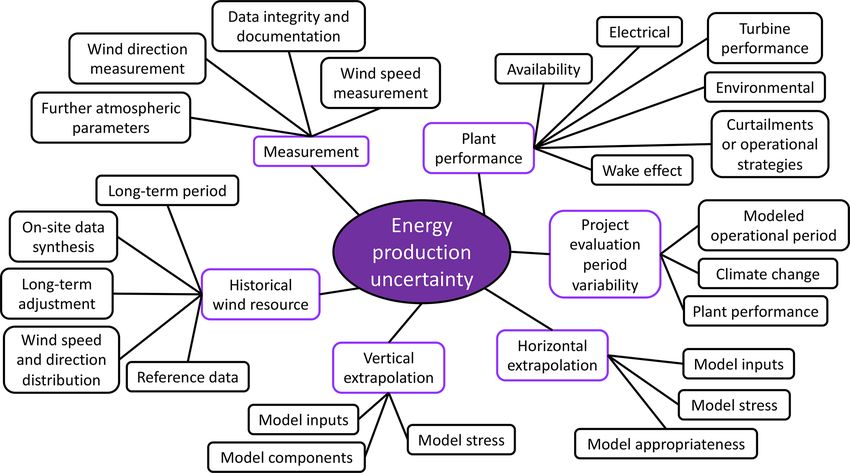
J. C. Y. Lee and M. J. Fields: An overview of wind-energy-production prediction bias                                                   313

Figure 2. Mind map of energy-production uncertainty, according to the IEC 61400-15 proposed framework. The purple and black rounded
rectangles represent the categorial and subcategorical uncertainties, respectively. Details of each uncertainty category and subcategory are
discussed in Table A2.

   We present this article with the following sections: Sect. 2            In most cases, we label the data source with the published
documents the data and the methodology of data filtering;               year of the study, unless the author highlights a change of
Sect. 3 focuses on P50 prediction bias, including its trend             method at a specific time. For example, if an organization
and various reasons of bias improvement; Sects. 4 and 5, re-            publishes a study in 2012 and reports their improvements
spectively, illustrate the energy-production loss and uncer-            on P50 prediction bias by comparing their “current” method
tainty, according to the IEC-proposed framework; Sect. 6 de-            with their “previous set of methodology before 2012”, the
scribes the numerical ranges of various wind speed uncer-               two P50 biases are recorded as 2012 and 2011, respec-
tainties; Sect. 7 discusses the implications and future out-            tively. Moreover, for the same study that documents mul-
look based on our findings; Sect. 8 provides conclusions;               tiple P50 prediction errors in the same year, we select the
Appendix A outlines the energy loss and uncertainty frame-              one closest to zero, because those numbers reflect the state
works proposed by the IEC 61400-15 working group; Ap-                   of the art of P50 validation of that year (Fig. 3). Accord-
pendix B compiles the data used in this analysis.                       ingly, we use the paired P50 errors to indicate the effects from
                                                                        method adjustments (Fig. 4). To track the bias impact of tech-
2   Data and methodology                                                nique changes from different organizations, we combine the
                                                                        closely related, ongoing series of studies from a single orga-
We conduct our literature review over a broad spectrum of               nization, usually by the same authors from the same institu-
global sources. The literature includes the presentations at            tions (each line in Fig. 4).
academic, industry, and professional conferences, particu-                 We also derive the trend of P50 prediction errors using
larly the Wind Resource and Project Energy Assessment                   polynomial regression and investigate the reasons behind
workshops hosted by the American Wind Energy Associa-                   such trend. We use the second-degree polynomial regression
tion (AWEA) and WindEurope, as they are the key annual                  (i.e., quadratic regression) to analyze the trend of the P50 pre-
gatherings for wind resource experts. Additionally, we ex-              diction errors over time, and polynomials of higher degrees
amine data from industry technical reports and white pa-                only marginally improve the fitting. We choose the polyno-
pers; publicly available user manuals of wind energy numeri-            mial regression over the simple linear regression because the
cal models; technical reports from government agencies, na-             P50 prediction errors are reducing towards zero with a dimin-
tional laboratories, and research and academic institutions;            ishing rate, and we use quadratic polynomial over higher-
and peer-reviewed journal articles. Many of the literature              order polynomials to avoid overfitting. Additionally, in the
sources originate in North America and Europe. Meanwhile,               regressions presented in this article (Figs. 3, 8, and C1), we
many of the regional corporations we cited in this article              present an estimated 95 % confidence interval, generated via
have become global businesses after mergers and acquisi-                bootstrapping with replacement using the same sample size
tions; hence, their presentations and publications can also             of the data, which is performed through the regplot function
represent international practices.                                      in the seaborn Python library (Waskom et al., 2020). The con-
                                                                        fidence interval describes the bounds of the regression coef-

https://doi.org/10.5194/wes-6-311-2021                                                            Wind Energ. Sci., 6, 311–365, 2021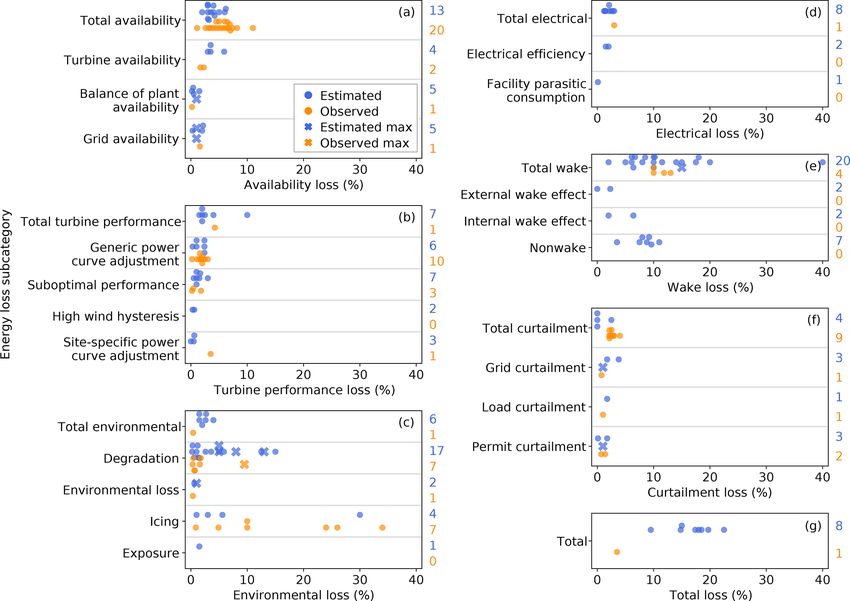
314                                          J. C. Y. Lee and M. J. Fields: An overview of wind-energy-production prediction bias

Figure 3. The trend of P50 prediction bias: (a) scatterplot of 63 independent P50 prediction error values, where R 2 is the coefficient of
determination and n is the sample size. Negative bias means the predicted AEP is higher than the measured AEP, and vice versa for positive
bias. The solid black line represents the quadratic regression, the dark grey cone displays the 95 % confidence interval of the regression line,
the light grey cone depicts the 95 % prediction interval, and the horizontal dashed black line marks the zero P50 prediction error. (b) As in
panel (a) but only for 56 studies that use more than 10 wind farms in the analyses. The vertical violet bars represent the estimated uncertainty
bounds (presented as 1 standard deviation from the mean) of the mean P50 prediction errors in 15 of the 56 samples. Table B1 summarizes
the bias data illustrated herein. For clarity, the regression uses the year 2002 as the baseline; hence, the resultant regression constant, i.e., the
derived intercept, is comprehensible.

                                                                             confidence interval illustrates the uncertainty of the regres-
                                                                             sion function, whereas the prediction interval represents the
                                                                             uncertainty of the estimated values of the predictand (Wilks,
                                                                             2011). In addition, we evaluate the regression analysis with
                                                                             the coefficient of determination (R 2 ), which represents the
                                                                             proportion of the variance of the predictand explained by the
                                                                             regression.
                                                                                For loss and uncertainty, we have limited data samples
                                                                             for certain categories because these data are only sparsely
                                                                             available. When a source does not provide an average value,
                                                                             we perform a simple arithmetic mean when both the upper
                                                                             and lower bounds are listed. For instance, when the average
                                                                             wake loss is between 5 % and 15 %, we project the average of
                                                                             10 % in Fig. 6, and we present all the original values in Ap-
                                                                             pendix B. If only the upper bound is found, then we project
Figure 4. Illustration of P50 bias changes over time after method            the data point as a maximum: the crosses in Fig. 6 are used as
modifications in 17 studies. The dot and the cross, respectively, rep-       an example. We also use linear regression to explore trends
resent the starting point and the finish point of the P50 prediction         in loss and uncertainty estimates.
error because of method adjustments. The solid line indicates the               We categorize the data to the best of our knowledge to
P50 bias reduces after the method change, and the dotted line dis-           synthesize a holistic analysis. On one hand, if the type of
plays the opposite. The different colors are solely used to differen-        loss and uncertainty from a source uses marginally differ-
tiate the lines and represent no meaning. The paired data are pre-           ent terminology from the IEC-proposed framework, we first
sented in Table B2.                                                          attempt to classify it within the IEC framework, we gather
                                                                             other values in the same category or subcategory from the
ficients with 95 % confidence. Furthermore, we present the                   same data source, and we select the minimum and the max-
95 % prediction interval in Fig. 3, which depicts the range of               imum. As an illustration, if the total electrical losses from
the predicted values, i.e., the P50 prediction bias, with 95 %               the substation and the transmission line are, respectively, 1 %
confidence, given the existing data and regression model. The                and 2 %, we then label the total electrical loss with the range
prediction interval is calculated using standard deviation, as-              of 1 % to 2 %. On the other hand, when the type of loss and
suming an underlying Gaussian distribution. In short, the                    uncertainty illustrated in the literature largely differ from the

Wind Energ. Sci., 6, 311–365, 2021                                                                 https://doi.org/10.5194/wes-6-311-2021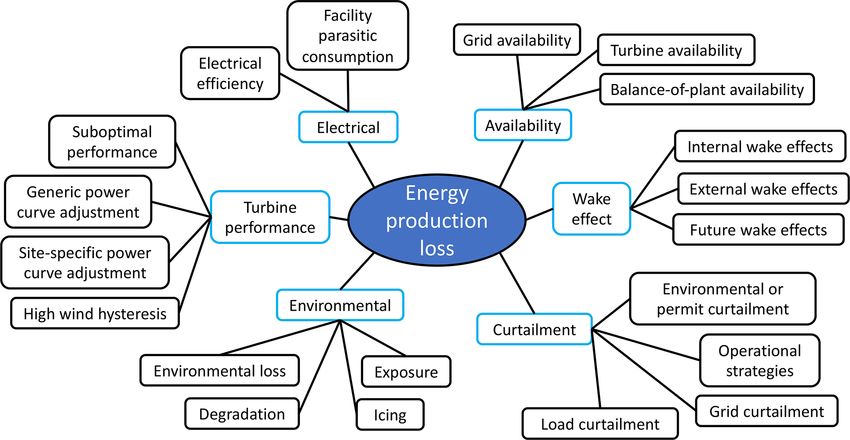
J. C. Y. Lee and M. J. Fields: An overview of wind-energy-production prediction bias                                          315

IEC framework, we label them separately (Figs. 7 and 11).          of the variance is caused by the inherent uncertainty between
Because a few studies contrast wake loss and nonwake loss,         validation studies that does not change over time. The aver-
where nonwake loss represents every other type of energy           age bias magnitude also does not correlate with the size of
loss, we also include nonwake loss in this study (Figs. 6          the study, neither in wind farm sample size nor wind farm
and 10). When a type of uncertainty is recorded as simply          year length (not shown). Note that in some early studies, the
“extrapolation” (seen in McAloon, 2010 and Walter, 2010),          reported biases measured in wind farm differ from those us-
we label the value as both horizontal and vertical extrapola-      ing wind farm year from the same source; we select the error
tion uncertainties with a note of “extrapolation” in Tables B6     closest to zero for each independent reference because the
and B8. We also divide the reported losses and uncertainties       bias units are the same (Sect. 2).
into two groups, the “estimated” and the “observed”, where            The uncertainty of the average P50 prediction error quanti-
the former are based on simulations and modeling studies,          fied by the studies remains large, in which the mean standard
and the latter are quantified via field measurements.              deviation is 6.6 % of the 15 data sources’ reported estimated
   Unless specifically stated otherwise in Appendix B, we          P50 uncertainty (violet bars in Fig. 3b). The industry started
present a loss value as the percentage of production loss per      to disclose the standard deviations of their P50 validation
year, and we document an uncertainty number as the sin-            studies in 2009, and it is becoming more common. With only
gle standard deviation in energy percentage in the long term,      15 data points, we cannot identify a temporal trend of the
usually for 10 or 20 years. The wind speed uncertainty is          uncertainty in P50 prediction bias. Even though the industry-
stated as a percentage of wind speed in m s−1 , and the un-        wide mean P50 prediction bias is converging towards zero,
certainty of an energy loss is expressed as percent of a loss      the industry appears to overestimate or underpredict the AEP
percentage.                                                        for many individual wind projects.
   This article evaluates a compilation of averages, where
each data point represents an independent number. The meta-        3.2    Reasons for bias changes
data for each study in the literature vary, in which the re-
sultant P50 prediction errors, losses, and uncertainties come      To correct for the historical P50 prediction errors, some or-
from diverse collections of wind farms with different com-         ganizations publicize the research and the adjustments they
mercial operation dates in various geographical regions and        have been conducting for their WRA processes. We summa-
terrains. Therefore, readers should not compare a specific         rize the major modifications of the WRA procedure in Ta-
data point with another. In this study, we aim to discuss the      ble 1. Most studies demonstrate mean P50 bias improvement
WRA process from a broad perspective. Other caveats of             over time (Fig. 4), and the magnitude of such bias reduction
this analysis include the potentially inaccurate classification    varies. In two studies, the authors examine the impact of ac-
of the data into the proposed IEC framework; the prime fo-         counting for windiness, which is the quantification of long-
cus on P50 rather than P90 , which also has a strong financial     term wind speed variability, in their WRA methodologies.
implication; and the tendency in the literature to selectively     They acknowledge the difficulty in quantifying interannual
report extreme losses and uncertainties caused by extraordi-       wind speed variability accurately, and their P50 prediction
nary events, such as availability loss and icing loss, which po-   errors worsen after embedding this uncertainty in their WRA
tentially misrepresents the reality. Our data sources are also     process (vertical dashed lines in Fig. 4).
only limited to publicly available data or those accessible at
NREL. We perform a rigorous literature review from over            4     Energy-production loss
150 independent sources, and the results presented in this ar-
ticle adequately display the current state of the wind energy      The prediction and observation of production losses are
industry.                                                          tightly related to the P50 prediction accuracy; hence, we con-
                                                                   trast the estimated and measured losses in various categories
                                                                   and benchmark their magnitude (Figs. 5–7). The total energy
3     P50 prediction bias
                                                                   loss is calculated from the difference between the gross en-
3.1    Bias trend
                                                                   ergy estimate and the product of gross energy prediction and
                                                                   various categorical production efficiencies, where each effi-
We identify an improving trend of the mean P50 prediction          ciency is 1 minus a categorical energy loss (Brower, 2012).
bias, where the overprediction of energy production is gradu-      Of the total categorical losses, we record the largest number
ally decreasing over time (Fig. 3), and the narrow 95 % con-       of data points from availability loss, and wake loss displays
fidence interval of the regression fit justifies the long-term     the largest variability among studies (Fig. 5). For availability
trend. Such an improving trend is not strictly statistically       loss, the total observed loss varies more than the total es-
significant (Fig. 3a), even after removing the studies based       timated loss and displays a larger range (Fig. 6a). The tur-
on small wind farm sample sizes (Fig. 3b). However, the            bine availability loss appears to be larger than the balance of
R 2 of 0.578 in Fig. 3b implies that over half of the variance     plant and grid availability losses; however, more data points
in bias can be described by the regression, and less than half     are needed to validate those estimates (Fig. 6a). Except for

https://doi.org/10.5194/wes-6-311-2021                                                     Wind Energ. Sci., 6, 311–365, 2021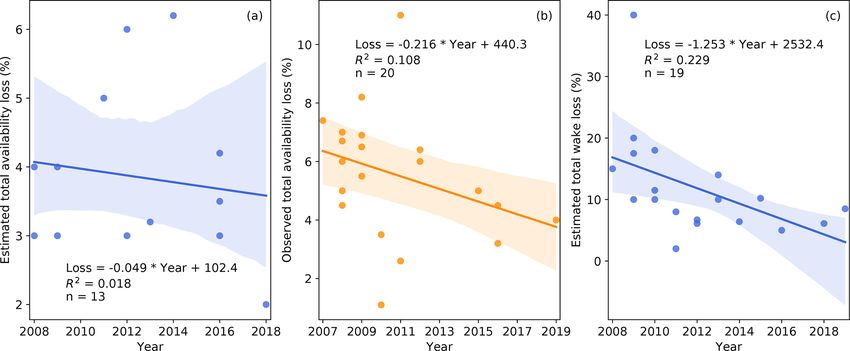
316                                      J. C. Y. Lee and M. J. Fields: An overview of wind-energy-production prediction bias

Table 1. Categories of method adjustments to improve the wind resource assessment process and the respective data sources.

                   Method change                                              Source
                   Account for additional factors in wind resource            AWS Truepower (2009), Johnson (2012)
                   assessment and operation, e.g.,
                   – windiness or long-term correction of wind
                   data,
                   – suboptimal operation,
                   – external wake effect, and
                   – degradation of long-term meteorological
                   masts.
                   Consider meteorological effects on power production,       AWS Truepower (2009), Brower et al.
                   e.g.,                                                      (2012), Elkinton (2013), Johnson (2012),
                   – wind shear,                                              Ostridge (2017)
                   – turbulence,
                   – air inflow angle, and
                   – atmospheric stability.
                   Improve modeling techniques, e.g.,                         Elkinton (2013), Johnson (2012),
                   – turbine performance,                                     Ostridge (2017), Papadopoulos (2019)
                   – wind flow,
                   – wake,
                   – flow over complex terrain,
                   – effects of changes in surface roughness, and
                   – wind farm roughness.
                   Improve in measurement and reduce in measurement           AWS Truepower (2009), Johnson (2012),
                   bias, e.g., adjust for dry friction whip of anemometers.   Ostridge (2017), Papadopoulos (2019)
                   Correct for previous methodology shortcomings, e.g.,       Ostridge (2017), Papadopoulos (2019)
                   – loss assumptions, and
                   – shear extrapolation.

one outlier, the turbine performance losses, in both predic-
tions and observations, are about or under 5 % (Fig. 6b).
Large ranges of environment losses exist, particularly for ic-
ing and degradation losses, which can drastically decrease
AEP (Fig. 6c). Note that some of the icing losses indicated
in the literature represent the fractional energy-generation
loss from production stoppages over atypically long periods
in wintertime, rather than a typical energy loss percentage
for a calendar year. Electrical loss has been assured as a
routine energy reduction with high certainty and relatively
low magnitude (Fig. 6d). Of all the categories, wind tur-
bine wake results in a substantial portion of energy loss, and
its estimations demonstrate large variations (Fig. 6e). The             Figure 5. Ranges of total energy-production losses in different cat-
magnitude of estimated wake loss is larger than that of the             egories, according to the proposed framework of the IEC 61400-15
predicted nonwake loss, which consists of other categorical             standard. Each blue dot and orange dot, respectively, represents the
losses (Fig. 6e). The observed total curtailment loss exhibits          mean estimated loss and mean observed loss documented in each
lower variability, yet with larger magnitude than its estima-           independent reference. The losses are expressed as percentage of
tion (Fig. 6f). From the eight studies that report total loss, the      AEP. The column of numbers on the right denotes the sample size in
predictions range from 9.5 % to 22.5 % (Fig. 6g). We do not             each category, where the estimated ones are in blue and the observed
                                                                        ones are in orange. For clarity, the horizontal grey lines separate
encounter any operational strategies loss under curtailment
                                                                        data from each category. Table B3 catalogs the categorical losses
loss in the literature, and thus the subcategories in Fig. 6 do         plotted herein.
not cover every subcategory in Table A1.

Wind Energ. Sci., 6, 311–365, 2021                                                           https://doi.org/10.5194/wes-6-311-2021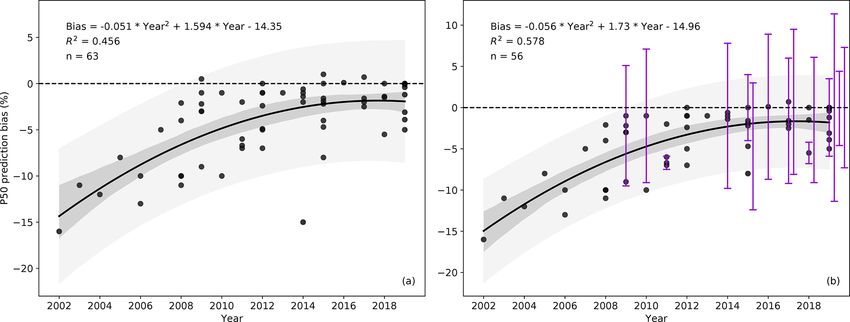
J. C. Y. Lee and M. J. Fields: An overview of wind-energy-production prediction bias                                                      317

Figure 6. Ranges of energy-production losses in different categories and subcategories, according to the proposed framework of the
IEC 61400-15 standard, except for nonwake in panel (e), which is an extra subcategory summarizing other nonwake categories. Each blue
dot and orange dot, respectively, represents the mean estimated loss and mean observed loss documented in each independent study. The blue
and orange crosses, respectively, indicate the maximum of estimated loss and the maximum of observed loss reported, where the minima
are not reported, and thus the averages cannot be calculated. The losses are expressed as percentage of AEP. The column of numbers on the
right denotes the estimated and observed sample sizes in blue and orange, respectively, in each subcategory, and such sample size represents
all the instances in that subcategory that recorded either the mean or the maximum loss values. For clarity, the grey horizontal lines separate
data from each subcategory. Table B3 catalogs the categorical and subcategorical losses plotted herein.

   Losses that inhibit wind farm operations can cause con-
siderable monetary impact. For example, blade degradation
can result in a 6.8 % of AEP loss for a single turbine in the
IEC Class II wind regime, where the maximum annual av-
erage wind speed is 8.5 m s−1 ; this translates to USD 43 000
per year (Wilcox et al., 2017). Generally, the typical turbine
failure rate is about 6 %, where 1 % reduction in turbine fail-
                                                                          Figure 7. As in Fig. 6 but for the loss categories outside of the
ure rate can lead to around USD 2 billion of global savings               proposed IEC framework, as listed in Table B4.
in operation and maintenance (Faubel, 2019). In practice, the
savings may exclude the cost of preventative measures for
turbine failure, such as hydraulic oil changes and turbine in-            al., 2018). Wind farm blockage is not a new topic (mentioned
spections.                                                                in Johnson et al., 2008) and has been heavily discussed in
   We categorize two types of energy-production losses ad-                recent years (Bleeg et al., 2018; Lee, 2019; Papadopoulos,
ditional to the proposed IEC framework, namely the first few              2019; Robinson, 2019; Spalding, 2019). Compared to some
years of operation and blockage effect (Fig. 7). For the for-             of the losses in Fig. 6, the loss magnitude of first few years
mer loss, a newly constructed wind farm typically does not                of operation and blockage is relatively small, where it con-
produce to its full capacity for the first few months or even for         tributes to less than 5 % of AEP reduction per year (Fig. 7).
the first 2 years. The loss from the first few years of operation            For trend analysis, we linearly regress every subcategori-
captures this time-specific and availability-related production           cal energy loss (Fig. 6 and Table B3) on time, and we only
loss. Regarding the later loss, the blockage effect describes             find two loss subcategories demonstrate notable and statis-
the wind speed slowdown upwind of a wind farm (Bleeg et                   tically confident trends (Fig. 8). The measured curtailment

https://doi.org/10.5194/wes-6-311-2021                                                              Wind Energ. Sci., 6, 311–365, 2021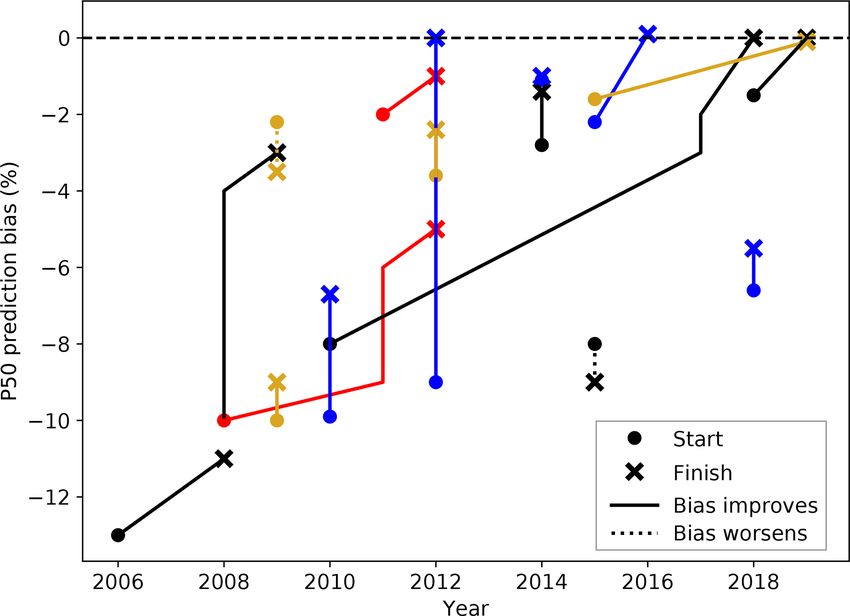
318                                         J. C. Y. Lee and M. J. Fields: An overview of wind-energy-production prediction bias

                                                                         Figure 9. Uncertainty of energy-production losses, where the mag-
                                                                         nitude corresponds to the AEP loss percentages listed in Fig. 6 and
                                                                         Table B3. Each dark blue dot, turquoise dot, and turquoise cross
                                                                         represents the estimated uncertainty, the observed uncertainty, and
                                                                         the maximum observed uncertainty of losses, respectively. The un-
Figure 8. Trend in observed energy-production loss: (a) total cur-       certainties are expressed as percentages of uncertainty in terms of
tailment loss and (b) generic power curve adjustment loss. The an-       the energy-production loss percentage. The column of numbers on
notations correspond to those in Fig. 3, where the orange solid line     the right denotes the estimated and observed sample sizes in dark
represents simple linear regression, the light orange cone illustrates   blue and turquoise, respectively, in each row, and such sample size
the 95 % confidence interval, R 2 is the coefficient of determination,   represents all the instances in that row that reported either the mean
and n is sample size.                                                    or the maximum values. For clarity, the grey horizontal lines sepa-
                                                                         rate data from each uncertainty. Table B5 records the uncertainties
                                                                         displayed herein.
loss and the observed generic power curve adjustment loss
steadily decrease over time, and the reductions have reason-
able R 2 (Fig. 8). No other reported losses with a reasonable
                                                                         each subcategorical uncertainty corresponds to the respec-
number of data samples display remarkable trends (Fig. C1).
                                                                         tive AEP loss (Fig. 6 and Table A1). The range of the pre-
   Past research further documents the uncertainties of AEP
                                                                         dicted energy uncertainty caused by wake effect is about 6 %
losses. Except for an outlier of measuring 80 % uncertainty
                                                                         (Fig. 10e). The estimated uncertainty of turbine performance
in wake loss, the magnitude of the uncertainty of wake loss is
                                                                         loss and total project evaluation period match with those ob-
analogous to that of nonwake loss (Fig. 9). The industry also
                                                                         served (Fig. 10e and f). Overall, the average estimated total
tends to reveal the uncertainty of wake loss than nonwake
                                                                         uncertainty varies by about 10 %, whereas the observed total
loss according to the larger number of data sources (Fig. 9).
                                                                         uncertainty appears to record a narrower bound, after exclud-
One data source reported that depending on the location, the
                                                                         ing an outlier (Fig. 10g).
operational variation from month to month can alter AEP
                                                                            In the literature, we cannot identify all the uncertainty
losses for more than 10 % on average (Fig. 9). Note that the
                                                                         types listed in the proposed IEC framework; hence, the fol-
results in Fig. 9 represent the uncertainty of the respective
                                                                         lowing AEP uncertainty subcategories in Table A2 are omit-
production loss percentages in Fig. 6 and Table B3, rather
                                                                         ted in Fig. 10: wind direction measurement in measurement;
than the AEP uncertainty.
                                                                         on-site data synthesis in historical wind resource; model in-
                                                                         puts and model appropriateness in horizontal extrapolation;
5   Energy-production uncertainty                                        model components and model stress in vertical extrapolation;
                                                                         and environmental loss in plant performance.
The individual energy-production uncertainties directly in-                 Similar to energy losses, other types of AEP uncertainties
fluence the uncertainty of P50 prediction. Total uncertainty             not in the proposed IEC framework emerge. The magnitude
is the root sum square of the categorical uncertainties; the             of the uncertainties in Fig. 11 is comparable to the uncertain-
assumption of correlation between categories can reduce                  ties in Fig. 10. The power curve measurement uncertainty in
the overall uncertainty, and this is a typically consultant-             Fig. 11, specifically mentioned in the data sources, could be
and method-specific assumption (Brower, 2012). Except for                interpreted as the uncertainty from the turbine performance
a few outliers, the magnitude of the individual energy-                  loss.
production uncertainties across categories and subcategories                The energy-production uncertainty from air density and
is about or below 10 % (Fig. 10). The energy uncertainties               vertical extrapolation depends on the geography of the site.
from wind measurements range below 5 %, after omitting                   For instance, the elevation differences between sea level and
two extreme data points (Fig. 10a). The estimated long-term              the site altitude, as well as the elevation differences between
period uncertainty varies the most in historical wind resource           the mast height and turbine hub height, affect the AEP un-
(Fig. 10b), which indicates the representativeness of histori-           certainty (Nielsen et al., 2010). For simple terrain, the ver-
cal reference data (Table A2). Horizontal extrapolation gen-             tical extrapolation uncertainty can be estimated to increase
erally yields higher energy-production uncertainty than ver-             linearly with elevation (Nielsen et al., 2010). A common in-
tical extrapolation (Fig. 10c and d). For plant performance,             dustry practice is to assign 1 % of energy uncertainty for each

Wind Energ. Sci., 6, 311–365, 2021                                                             https://doi.org/10.5194/wes-6-311-2021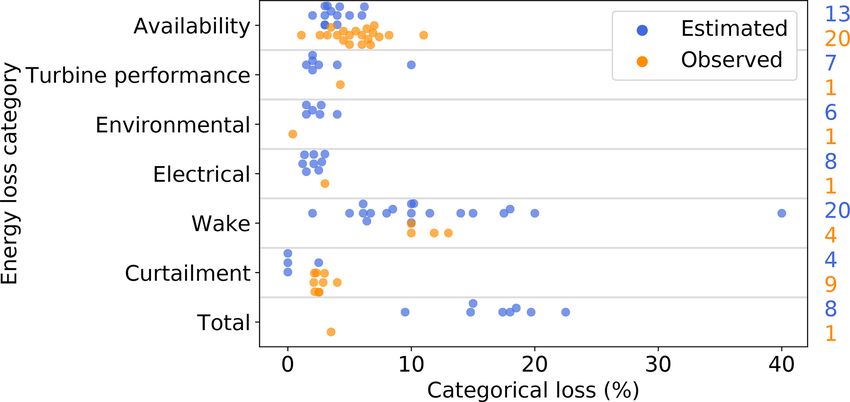
J. C. Y. Lee and M. J. Fields: An overview of wind-energy-production prediction bias                                                   319

Figure 10. Ranges of energy-production uncertainties in different categories and subcategories, according to the proposed framework of the
IEC 61400-15 standard. The annotations correspond to those in Fig. 6, where each purple dot, green dot, and purple cross represents the
mean estimated uncertainty, the mean observed uncertainty, and the maximum of estimated uncertainty from each independent reference,
respectively. The uncertainties are expressed as percentages in AEP. The column of numbers on the right denotes the estimated and observed
sample sizes in purple and green, respectively, in each subcategory, and such sample size represents all the instances in that subcategory
that reported either the mean or the maximum uncertainty values. For clarity, the grey horizontal lines separate data from each subcategory.
Table B6 numerates the production uncertainties.

                                                                        estimation model, the uncertainty of wind speed plays an im-
                                                                        portant role in the WRA process. We present various groups
                                                                        of wind speed uncertainties in the literature herein (Fig. 12).
                                                                        The bulk of the wind speed uncertainties are roughly 10 %
                                                                        or less of the wind speed. Many studies report estimated un-
                                                                        certainty from wind speed measurement; however, its mag-
                                                                        nitude and discrepancy among the sources are not as large
Figure 11. As in Fig. 10 but for the uncertainty categories outside     as those from wind speed modeling or interannual variabil-
of the proposed IEC framework, as listed in Table B7.                   ity (Fig. 12). Notice that some of the wind speed categories
                                                                        coincide with the IEC-proposed framework of energy uncer-
                                                                        tainty, and others do not. The absence of standardized classi-
10 m of vertical extrapolation, which could overestimate the            fication of wind speed uncertainties increases the ambiguity
uncertainty, except for forested locations (Langreder, 2017).           in the findings from the literature and poses challenges to the
                                                                        interpretation of the results in Fig. 12. We also lack sufficient
6   Wind speed uncertainty                                              samples of measured wind speed uncertainties to validate the
                                                                        estimates.
Energy production of a wind turbine is a function of wind                  Wind speed uncertainty greatly impacts AEP uncertainty,
speed to its third power. Considering wind speed, either mea-           and the methods of translating wind speed uncertainty into
sured, derived, or simulated, is a critical input to an energy          AEP uncertainty also differ between organizations. For ex-

https://doi.org/10.5194/wes-6-311-2021                                                            Wind Energ. Sci., 6, 311–365, 2021
320 J. C. Y. Lee and M. J. Fields: An overview of wind-energy-production prediction bias
7 Opportunities for improvements
Although the industry is reducing the mean P50 overpredic-
tion bias, the remarkable uncertainties inherent in the WRA
process overshadow such achievement. Different organiza-
tions have been improving their techniques over time to elim-
inate the P50 bias (Table 1), and as a whole we celebrate the
technological advancements; nevertheless, challenges still
exist for validation and reduction of the AEP losses and un-
certainties. Even though the average P50 prediction bias is re-
ducing and approaches zero, the associated mean P50 uncer-
tainty remains at over 6 %, even for the studies reported af-
ter 2016 (Fig. 3b). For a validation study that involves a col-
lection of wind farms, such an uncertainty bound implies that
sizable P50 predication errors for particular wind projects
can emerge. In other words, statistically, the AEP prediction
is becoming more accurate and yet is imprecise. Moreover,
from an industry-wide perspective that aggregates different
analyses, the variability on the mean P50 bias estimates is no-
table, which obscures the overall bias-reducing trend (R 2 be-
low 0.5 in Fig. 3). Specifically, the magnitude of the 95 %
Figure 12. Ranges of wind speed uncertainties in different cate- prediction interval at over 10 % average P50 estimation error
gories. The annotations correspond to those in Fig. 10, where each (Fig. 3b) suggests a considerable range of possible mean bi-
dark purple dot, dark green dot, and dark purple cross represents the ases in future validation studies. Additionally, the uncertain-
mean estimated wind speed uncertainty, the mean observed wind ties are still substantial in specific AEP losses (Fig. 9), AEP
speed uncertainty, and the maximum of estimated wind speed uncer- itself (Figs. 10 and 11), and wind speed (Fig. 12). Therefore,
tainty from each independent study, respectively. The uncertainties
the quantification, validation, and reduction of uncertainties
are expressed as percentages of wind speed. The column of num-
bers on the right denotes the estimated and observed sample sizes
require the attention of the industry collectively.
in dark purple and dark green, respectively, in each category, and To reduce the overall AEP uncertainty, the industry should
such sample size represents all the instances in that category that continue to assess the energy impacts of plant performance
reported either the mean or the maximum uncertainty values. For losses, especially those from wake effect and environmental
clarity, the grey horizontal lines separate data from each category. events. On one hand, wake effect, as part of a grand chal-
Table B8 documents the wind speed uncertainties displayed. lenge in wind energy meteorology (Veers et al., 2019), has
been estimated as one of the largest energy losses (Fig. 6e).
The AEP loss caused by wake effect also varies, estimated
ample, 1 % increase of wind speed uncertainty can lead to between 15 % and 40 % (Fig. 9), and the unpredictability of
either a 1.6 % (AWS Truepower, 2014) or 1.8 % increase in wakes contributes to the AEP uncertainty on plant perfor-
energy-production uncertainty (Holtslag, 2013; Johnson et mance (Fig. 10e) and the wind speed uncertainty (Fig. 12).
al., 2008; White, 2008a, b). Local wind regimes can also af- Although the industry has been simulating and measuring
fect this ratio. For low wind locations, AEP uncertainty can energy loss caused by wake effect, its site-specific impact on
be 3 times the wind speed uncertainty, while such a ratio AEP for the whole wind farm as well as its time-varying pro-
drops to 1.5 at high wind sites (Nielsen et al., 2010). duction impact on downwind turbines remains largely uncer-
Decreasing wind speed uncertainty benefits the wind en- tain. From a macro point of view, compared to internal wake
ergy industry. Reduction in wind speed measurement of effect, external wake effect from neighboring wind farms is
0.28 % could reduce project-production uncertainty by about a bigger known unknown because of the lack of data and
0.15 % (Medley and Smith, 2019). Using a computational research. On the other hand, environmental losses display
fluid dynamics model to simulate airflow around meteorolog- broad range of values, particularly from icing events and tur-
ical masts can reduce wind speed measurement uncertainty bine degradation (Fig. 6c). In general, the icing problem halts
from 2.68 % to 2.23 %, which translates to GBP 1.2 mil- energy production in the short run, and blade degradation un-
lion of equity savings for a 1 GW offshore wind farm in the dermines turbine performance in the long run. Diagnosing
United Kingdom (Crease, 2019). and mitigating such substantial environmental losses would
reduce both loss and uncertainty on AEP. Overall, the predic-
tion and prevention of environmental events are critical, and
the production downtime during high electricity demand can
lead to consequential financial losses.
Wind Energ. Sci., 6, 311–365, 2021 https://doi.org/10.5194/wes-6-311-2021J. C. Y. Lee and M. J. Fields: An overview of wind-energy-production prediction bias 321
Additionally, the industry recognizes the role of remote- Although the mean P50 bias demonstrates a decreasing
sensing instruments in reducing the uncertainty of energy trend over time because of continuous methodology adjust-
production and wind speed from extrapolation, such as pro- ments, the notable uncertainty of the mean prediction error
filing lidars, scanning lidars, and airborne drones (Faghani et reveals the imprecise prediction of annual energy produc-
al., 2008; Holtslag, 2013; Peyre, 2019; Rogers, 2010). The tion. The dominant effect of prediction uncertainty over the
latter can also be used to inspect turbine blades (Shihavuddin bias magnitude calls for further improvements on the pre-
et al., 2019) to reduce unexpected blade degradation loss over diction methodologies. To reduce the mean bias, industry
time. Industry-wide collaborations such as the International experts have made method adjustments in recent years that
Energy Agency Wind Task 32 and the Consortium For Ad- minimize the energy-production prediction bias, such as the
vancement of Remote Sensing, have been promoting remote- applications of remote-sensing devices and the modeling ad-
sensing implementation in WRA. vancements of meteorological phenomena.
Leaders in the field have been introducing contemporary We present the wind-energy-production losses and uncer-
perspectives and innovative techniques to improve the WRA tainties in this literature review according to the proposed
process, including time-varying and correlating losses and framework by the IEC 61400-15 working group. Wake effect
uncertainties. Instead of treating energy loss and uncertainty and environmental events undermine wind plant performance
as a static property, innovators have studied time-varying and constitute the largest loss in energy production, and val-
AEP losses and uncertainties (Brower et al., 2012), espe- idating the wake and environmental loss predictions requires
cially when wind plants produce less energy with greater more field measurements and detailed research. Moreover,
uncertainty in later operational years (Istchenko, 2015). Fur- the variability of observed total availability loss is larger than
thermore, different types of energy-production losses or un- its estimates. Meanwhile, the decreasing trends of measured
certainties interact and correlate with each other, and depen- curtailment loss and observed generic power curve adjust-
dent data sources can emerge in the WRA process. The re- ment loss indicate the continuing industry effort to optimize
sultant compound effect from two correlating sources of un- wind energy production. Additionally, different categorical
certainty can change the total uncertainty derived using a lin- energy uncertainties and wind speed uncertainties demon-
ear (Brower, 2011) or root-sum-square approach (Istchenko, strate similar magnitude, with a majority of the data below
2015). For example, an icing event can block site access and 10 %. More observations are the solution to better understand
decrease turbine availability and even lead to longer-term and further lower these uncertainties.
maintenance problems (Istchenko, 2015). In our findings, we highlight the potential future progress,
More observations and publicly available data are neces- including the importance of accurately predicting and vali-
sary to validate the estimates listed in this article. In this ar- dating energy-production uncertainty, the impact of wake ef-
ticle, the ratios between the measured and predicted values fect, and innovative approaches in the wind resource assess-
are 1 to 1.9, 2.3, and 7.3, for energy loss, energy uncertainty, ment process. This work also includes a summary of the data
and wind speed uncertainty, respectively. The small num- collected and used in this analysis. As the industry evolves
ber of references on measured uncertainties indicate that we with improved data sharing, method transparency, and rig-
need more evidence to further evaluate our uncertainty esti- orous research, we will increasingly be able to maximize
mates. Besides, challenges exist in interpreting and harmo- energy production and reduce its uncertainty for all project
nizing results from disparate reporting of energy-production stakeholders.
losses and uncertainties. Documentation aligned with ubiqui-
tous reference frameworks will greatly strengthen the accu-
racy and repeatability of future literature reviews. Therefore,
data and method transparency and standardization will con-
tinually improve insight into the WRA process, increase the
AEP estimation accuracy, and drive future innovation.
8 Conclusions
In this study, we compile and present the ranges and the
trends of predicted P50 (i.e., median annual energy produc-
tion) errors, as well as the estimated and observed energy
losses, energy uncertainties, and wind speed uncertainties
embedded in the wind resource assessment process. We con-
duct this literature review using over 150 credible sources
from conference presentations to peer-reviewed journal arti-
cles.
https://doi.org/10.5194/wes-6-311-2021 Wind Energ. Sci., 6, 311–365, 2021322 J. C. Y. Lee and M. J. Fields: An overview of wind-energy-production prediction bias
Appendix A
Table A1. Consensus energy-production loss framework for wind resource assessment proposed by the International Electrotechnical Com-
mission (IEC) 61400-15 working group (Filippelli et al., 2018). Note that this table does not represent the final standards.
Loss category Loss subcategory Notes
Internal wake effects Wake effects internal to the wind plant
External wake effects Wake effects generated externally to the wind plant
Wake effect
Wake effects that will impact future energy projections based on
Future wake effects either confirmed or predicted new project development or
decommissioning
Turbine availability Including warranted availability, non-contractual availability,
restart after grid outage, site access, downtime (or speed) to energy
ratio, first-year or plant start-up availability
Balance-of-plant Availability of substation and collection system, other non-turbine
Availability
availability availability, warranted availability, site access, first-year or plant
start-up availability
Grid being outside the grid connection agreement operational
Grid availability parameters, actual grid downtime, delays in restart after grid
outages
Electrical losses between low- or medium-voltage side of the
Electrical efficiency
transformer of wind turbine and the energy measurement point
Electrical
Facility parasitic Turbine extreme weather packages, other turbine and/or plant
consumption parasitic electrical losses (while operating or not operating)
Performance deviations from the optimal wind plant performance
Suboptimal performance
caused by software, instrumentation, and control setting issue
Generic power curve Expected deviation between advertised power curve and actual
Turbine performance adjustment power performance in standard conditions (“inner range”)
Site-specific power curve Accommodating for inclined flow, turbulence intensity, density,
adjustment shear, and other site- or project-specific adjustments (“outer range”)
Energy lost in hysteresis loop between high-wind-speed cut out and
High wind hysteresis
recut in
Icing Performance degradation and shutdown caused by icing
Blade fouling, efficiency losses, and other environmentally driven
Degradation
Environmental performance degradation
High- or low-temperature shutdown or derate, lightning, hail, and
Environmental loss
other environmental shutdowns
Exposure Tree growth or logging, other building development
Load curtailment Speed and/or direction curtailments to mitigate loads
Power purchase agreement or offtaker curtailments, grid
Grid curtailment
Curtailments (or limitations
operational strategies) Environmental or permit Birds, bats, marine mammals, flicker, noise (when not captured in
curtailment the power curve)
Any periodic uprating, downrating, optimization, or shutdown not
Operational strategies
captured in the power curve or availability carve-outs
Wind Energ. Sci., 6, 311–365, 2021 https://doi.org/10.5194/wes-6-311-2021J. C. Y. Lee and M. J. Fields: An overview of wind-energy-production prediction bias 323
Table A2. Consensus energy-production uncertainty framework for wind resource assessment proposed by the IEC 61400-15 working group
(Filippelli et al., 2018). Note that this table does not represent the final standards.
Uncertainty Uncertainty Notes
category subcategory
What is the statistical representativeness of the chosen historical and/or site
Long-term period data period? In other words, the interannual variability (coefficient of
variation) of the historical reference data period in years
How accurate or reliable is the chosen reference data source? In other
Reference data words, historical data consistency (e.g., are there possible underlying trends
in the data?)
Historical wind What is the uncertainty associated with the prediction process? Statistical
resource or empirical uncertainty in establishing a correlation or carrying out a
Long-term adjustment
prediction, which may be conditioned upon the correlation method and span
or the quantity of concurrent data period
Wind speed and direction Mean wind speed aside, how representative is the measured or predicted
distribution distribution and wind rose or energy rose shape of the long term?
Uncertainty associated with gap-filling missing data periods. Usually done
On-site data synthesis using directional correlations or the measure–correlate–predict process, and
hence long-term and reference data categories may apply
Modeled operational The statistical uncertainty associated with how closely the wind resource
period over the modeled operational period (i.e., 1 or 10 years) may match the long-term
Project site average
evaluation When an impact of climate change can be assessed, then this may be
Climate change
period considered as an uncertainty
variability The statistical uncertainty associated with how closely the plant
Plant performance performance over the modeled operational period (i.e., 1 or 10 years) may
match the long-term site average
Wind speed Including effects for wind speed sensor characteristics (cup or sonic), wind
measurement speed sensor mounting or deployment (cup or sonic), wind speed sensor
data handling and processing characteristics (e.g., tower shadow, icing, and
degradation), system motion, consistency and exposure, data acquisition,
and data handling. Additionally, the reduction in uncertainty caused by
sensor combination is considered
Measurement
Data integrity and
Documentation, verification, and traceability of the data
documentation
Wind direction Sensor type or quality, operational characteristics, mounting effects,
measurement alignment, acquisition, long-term representativeness
Further atmospheric Air temperature, pressure, relative humidity, and other atmospheric
parameters parameters
Terrain surface characterization, wind data measurement heights, wind
Model inputs
Vertical statistics or shear, measurement uncertainty
extrapolation Model components Representativeness per height or terrain, profile fit
Large extrapolation distance, complex terrain (measurement height relative
Model stress
to terrain complexity)
https://doi.org/10.5194/wes-6-311-2021 Wind Energ. Sci., 6, 311–365, 2021324 J. C. Y. Lee and M. J. Fields: An overview of wind-energy-production prediction bias
Table A2. Continued.
Uncertainty Uncertainty Notes
category subcategory
Fidelity and appropriateness, given sensitivity of model to terrain data,
Model inputs
roughness, forestry information, atmospheric conditions
Representativeness of initiation points relative to turbine locations in terms
Model stress of complicating factors (e.g., forestry, stability, steep slopes, distance,
Horizontal elevation, veer); the intensity of and sensitivity to complicating factors
extrapolation Physical scientific plausibility of model to capture complicating factors;
validation of implementation of model: published validation of specific
Model appropriateness implementation and relevance to complicating factors present on site; on-
site model verification: site to site (untuned, blind); consider the quality of
any shear verification
Wake effect
Availability
Plant Electrical
performance Turbine performance Refer to Table A1
Environmental
Curtailments or
operational strategies
Wind Energ. Sci., 6, 311–365, 2021 https://doi.org/10.5194/wes-6-311-2021J. C. Y. Lee and M. J. Fields: An overview of wind-energy-production prediction bias 325 Appendix B For the P50 prediction error, Figs. 3 and 4 use the data from Table B1 and Table B2, respectively. For the various cate- gories and subcategories of losses, Figs. 5, 6, 8, and C1 por- tray the values in Table B3. Figure 7 illustrates the losses outside of the IEC-proposed framework listed in Table B4. Figure 9 summarizes the uncertainty of production loss per- centages in Table B5. Figures 10 and 11 represent the AEP uncertainty data included in Tables B6 and B7, respectively. Figure 12 displays the wind speed uncertainty data in Ta- ble B8. https://doi.org/10.5194/wes-6-311-2021 Wind Energ. Sci., 6, 311–365, 2021
326                                      J. C. Y. Lee and M. J. Fields: An overview of wind-energy-production prediction bias

Table B1. List of P50 biases in the literature, which is necessary to generate Fig. 3. The “Wind farm” column denotes the number of wind
farms reported in the reference, and the “Wind farm year” column indicates the total number of operation years among the wind farms in
that study. The “Bias (%)” column represents the average P50 bias, where a negative number indicates an overestimation of actual energy
production. All the values in the “Uncertainty (%)” column illustrate 1 standard deviation from the mean.

       Year    Wind     Wind     Bias    Uncertainty   Notes                                  Source
               farm     farm     (%)     (%)
                         year
       2002       12            −16                                                           Mönnich et al. (2016)
       2003       10            −11                                                           Mönnich et al. (2016)
       2004       19            −12                                                           Mönnich et al. (2016)
       2005       37             −8                                                           Mönnich et al. (2016)
       2006                     −13                                                           Johnson et al. (2008)
       2006       21            −10                                                           Mönnich et al. (2016)
       2007       23             −5                                                           Mönnich et al. (2016)
       2008       59      243   −11                                                           Johnson et al. (2008), Jones (2008)
       2008       41      113    −4                                                           Johnson et al. (2008)
       2008       56      112   −10                                                           White (2009)
       2008       36       62   −2.1                                                          Johnson (2012)
       2008                     −10                    Industry average                       White (2009)
       2008       17            −10                                                           Mönnich et al. (2016)
       2009               255    −1                                                           Horn (2009)
       2009                      −9                                                           Hendrickson (2009)
       2009                43    −3                                                           Hendrickson (2009)
       2009        1             0.5     6.4           Comparison of four analysts            Derrick (2009)
       2009       11       45   −2.2     7.3                                                  White (2009)
       2009       18             −3                                                           Mönnich et al. (2016)
       2010                      −1      8.1           From 1806 wind turbines                Nielsen et al. (2010)
       2010       11            −10                                                           Mönnich et al. (2016)
       2011        1                     2.4           Comparison of 15 analysts              Hendrickson (2011)
       2011       89             −6                    Industry average from 2000 to 2011     Drunsic (2012)
       2011                      −2                                                           Drunsic (2012)
       2011       18             −7                                                           Mönnich et al. (2016)
       2011                     −6.7     0.8                                                  Lunacek et al. (2018)
       2012                      −5                    Industry average from 2005 to 2011     Drunsic (2012)
       2012                      −1                                                           Drunsic (2012)
       2012                      −1                                                           Brower et al. (2012)
       2012      125      382      0                                                          Johnson (2012)
       2012                     −2.4                                                          Bernadett et al. (2012)
       2012       11             −7                                                           Mönnich et al. (2016)
       2012        6            −4.9                                                          Pullinger et al. (2019)
       2013       14             −1                                                           Mönnich et al. (2016)
       2014       24      106    −1      8.8                                                  Brower (2014)
       2014       31      101   −1.4                                                          Istchenko (2014)
       2014                     −0.6                                                          Geer (2014)
       2014        9            −15                                                           Redouane (2014)
       2014        4             −2                                                           Mönnich et al. (2016)
       2015                     −1.9                                                          Istchenko (2015)
       2015       10               0     4                                                    Sieg (2015)
       2015        1             −4      3             Comparison of 20 analysts              Mortensen et al. (2015a, b)
       2015        1               1                                                          Mönnich et al. (2016)
       2015       25       91    −8                                                           Cox (2015)
       2015       30      127   −2.2                                                          Stoelinga and Hendrickson (2015)
       2015       18       58   −1.6                                                          Hendrickson (2019)
       2015       23            −4.7     7.7                                                  Hatlee (2015)
       2016       30      127    0.1     8.8                                                  Baughman (2016)
       2017               140    −2                    Projects from 2011 to 2016             Elkinton (2017), Hale (2017)
       2017       61            −1.6     7.6           Most projects from 2008 to 2012        Brower (2017), Hale (2017)
       2017                     −2.5                                                          Hale (2017)
       2017       30      127    0.7     8.8                                                  Perry (2017)

Wind Energ. Sci., 6, 311–365, 2021                                                          https://doi.org/10.5194/wes-6-311-2021
You can also read