Product Energy Efficiency Trends (PEET) Methodologies - JANUARY 2021 Product Energy Efficiency Trends - A project of the Energy Efficient End-use ...
←
→
Page content transcription
If your browser does not render page correctly, please read the page content below
Product Energy
Efficiency Trends (PEET)
Methodologies
JANUARY 2021

Product Energy Efficiency Trends -
A project of the Energy Efficient End-use Equipment TCP
The Technology Collaboration Programme on Energy Efficient End-Use Equipment (4E TCP),
has been supporting governments to co-ordinate effective energy efficiency policies since
2008.

Fourteen countries and one region have joined together under the 4E TCP platform to
exchange technical and policy information focused on increasing the production and trade in
efficient end-use equipment. However, the 4E TCP is more than a forum for sharing
information: it pools resources and expertise on a wide a range of projects designed to meet
the policy needs of participating governments. Members of 4E find this an efficient use of
scarce funds, which results in outcomes that are far more comprehensive and authoritative
than can be achieved by individual jurisdictions.

The 4E TCP is established under the auspices of the International Energy Agency (IEA) as a
functionally and legally autonomous body.

Current Members of 4E TCP are: Australia, Austria, Canada, China, Denmark, European
Commission France, Japan, Korea, Netherlands, New Zealand, Switzerland, Sweden, UK and
USA.

Further information on the 4E TCP is available from: www.iea-4e.org

4E Product Energy Efficiency Trends (PEET) Methodology
January 2021
Acknowledgements
The 4E TCP thanks Paul Waide, Waide Strategic Efficiency Limited, Anson Wu (Hansheng Ltd)
and Jonathan Wood (Tenvic) for their considerable input into this document.

Disclaimer
The Technology Collaboration Programme on Energy Efficient End-Use Equipment (4E TCP)
has made its best endeavours to ensure the accuracy and reliability of the data used herein,
however makes no warranties as to the accuracy of data herein nor accepts any liability for
any action taken or decision made based on the contents of this report.

Views, findings and publications of the 4E TCP do not necessarily represent the views or
policies of the IEA Secretariat or its individual member countries.
4E PEET METHODOLOGY REPORT JANUARY 2021

CONTENTS
GLOSSARY .................................................................................................................................... IV
1.    INTRODUCTION TO PEET .......................................................................................................... 1
2.    INTRODUCTION TO PEET METHODOLOGY REPORT ......................................................................... 2
3.    TREATMENT OF DATA: ALL PRODUCTS........................................................................................... 4
      3.1      Data source and type ............................................................................................................ 4
      3.2      Reference model groups....................................................................................................... 4
      3.3      Normalisation ....................................................................................................................... 4
      3.4      Averaging .............................................................................................................................. 5
4.    AIR CONDITIONERS ................................................................................................................... 6
5.    COMPUTERS ......................................................................................................................... 11
6.    DISTRIBUTION TRANSFORMERS ................................................................................................. 18
7.    DOMESTIC REFRIGERATORS & FREEZERS..................................................................................... 22
8.    ELECTRIC MOTORS ................................................................................................................. 25
9.    LIGHTING (LEDS) .................................................................................................................. 29
10. STANDBY POWER................................................................................................................... 33
11. TELEVISIONS ......................................................................................................................... 34
12. WASHING MACHINES.............................................................................................................. 39
13. WATER HEATERS ................................................................................................................... 43
APPENDIX A: REFERENCE MODELS UNDER THE PEET PROJECT ................................................................ 47
APPENDIX B: FINDINGS FROM ADDITIONAL WORK: ESTABLISH RATIO OF IMPACT OF DIFFERENCES IN
            VOLTAGE/FREQUENCY FOR COMPUTERS .......................................................................... 51

List of Figures
Figure 1: Transformer efficiency as a function of loading, with no-load and load losses, for two
          different efficiency tiers...................................................................................................... 20
Figure 2: Estimated global market share for low voltage motors as a function of their indicative
          IE efficiency class under IEC 60034-30-1:2014 ................................................................... 26
Figure 3: LEDs with a GSL (E27) fixture with an integrated driver ..................................................... 29

                                                                                                                                                       ii
4E PEET METHODOLOGY REPORT JANUARY 2021
List of Tables
Table 1: Summary of PEET methodology per product category......................................................... 2
Table 2: Estimated global air conditioner market, 2018 .................................................................... 7
Table 3: Updated linear regression conversion formulae (Y=mX+C) for the US and EU SEERs as
a function of Japan’s APF ...................................................................................................... 9
Table 4a: Linear regression conversion formulae (Y=mX+C) coefficients used in the PEET for the
US and EU SEERs as a function of Japan’s APF, and as a function of each other .................. 9
Table 4b: Non-linear regression conversion coefficients used in the PEET for the China APF and
Korea CSPF as a function of Japan’s APF............................................................................... 9
Table 5: Summary product categorisation matrix for notebook and desktop computers and
workstations ....................................................................................................................... 12
Table 6: ENERGY STAR v5 Desktop Categories ................................................................................. 13
Table 7: Computer Test Procedures and Approaches amongst 4E Members .................................. 15
Table 8: Conversion factors for normalisation of TEC values measured at 115v/60Hz and
230v/50Hz........................................................................................................................... 16
Table 9: Conversion factors for normalisation of ENERGY STAR v5.0 Short Idle to ENERGY STAR
v7.1 Long Idle ...................................................................................................................... 16
Table 10: Summary M&B product categorisation for domestic refrigerators.................................... 22
Table 11: Linear regression equations for LED lamp efficacy as a function of various parameters ... 30
Table 12: Linear regression equations for LED lamp efficacy normalised for luminous flux as a
function of various parameters .......................................................................................... 31
Table 13: Summary of TV data sources .............................................................................................. 37
Table 14: Selected TV model power consumption relative to EU declared power ............................ 38
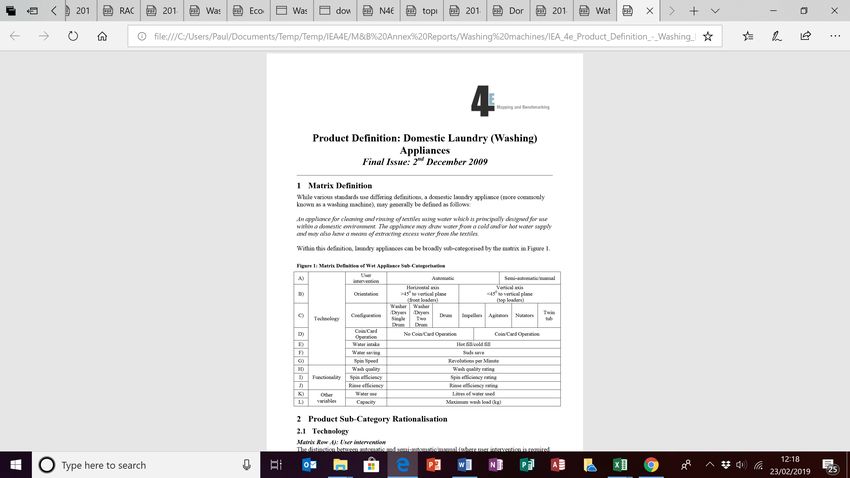
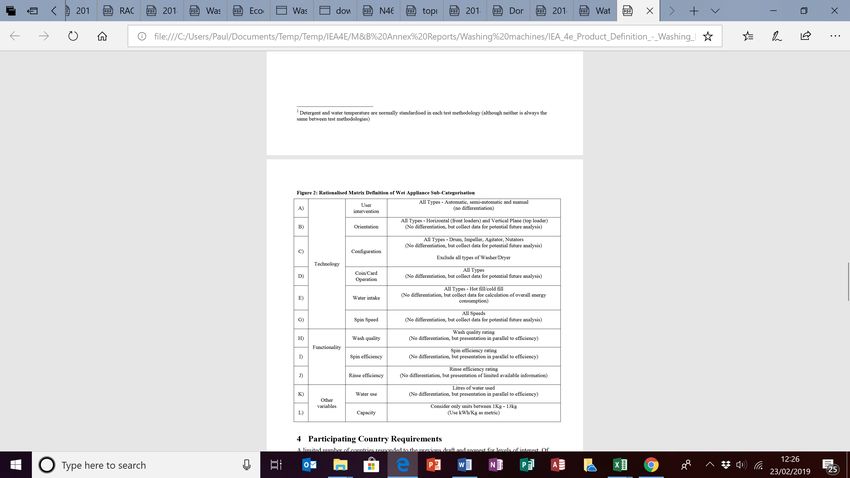
Table 15: Matrix definition of washing machine sub-categorisation ................................................. 39
Table 16: Matrix of washing machine sub-categorisation within the scope of the M&B analysis ..... 40
Table A1: Reference models categories used in the PEET .................................................................. 47
Table A2: Desktop computer reference model categories used in the PEET ..................................... 48
Table B.1 Normalisation – Increase in TEC (kWh/year) when products tested at 230V/50Hz
compared to 115V/60Hz (Based on products in US ENERGY STAR Database 2017) .......... 51
Table B.2 Normalisation – Increase in TEC (kWh/year) when products tested at 230V/50Hz
compared to 115V/60Hz (Based on products in US ENERGY STAR Database 2019) .......... 52
Table B.3 Normalisation – Percentage Increase in Power Demands when products tested at
230V/50Hz compared to 115V/60Hz (Based on products in US ENERGY STAR
Database 2017 and 2019) ................................................................................................... 53
Table B.4 Normalisation – Mean Power Demands (W) when products tested at 230V/50Hz
compared to 115V/60Hz (Based on products in US ENERGY STAR Database 2017 and
2019) ................................................................................................................................... 53
iii4E PEET METHODOLOGY REPORT JANUARY 2021
Glossary
General
AC Alternating current
IEC International electrotechnical committee
M&B Mapping and benchmarking annex of IEA 4E
MEPS Mininum energy performamce standards
PEET Product energy efficiency trends
SEAD Super-efficient Equipment and Appliance Deployment
Air conditioners
APF Annual performance factor
CSPF Cooling seasonal performance factor
EER Energy efficiency ratio
SEER Seasonal energy efficiency ratio
Computers
CPU Central processor unit
GPU Graphics processor unit
MP Megapixels
RAM Random access memory
TEC Typical energy consumption
Electric Motors
NEMA North American Electrical Manufacturers Association
Lighting
CCT Correlated colour temperature
CIE International Commission on Illumination
CRI Colour rendering index
GLS General lighting service
LED Light emitting diode
PF Power factor
Televisions
4K Screen resolution of 3840 x 2160 pixels
8K Screen resolution of 7680 x 4320 pixels
ABC Auto brightness control. Changes the luminance of a screen in response to the room illuminance
AEC Annual energy consumption
EPG Electronic program guide
High-definition multimedia interface. A proprietary audio/video interface and currently the most
HDMI
commonly used for televisions
High dynamic range refers to a screen with higher contrast ratio and able to display a greater range
HDR
of colours
Home theatre displays. A category of television with larger screen size and no tuner. It is distinct
HTD
from display signage and computer monitors.
IEC International Electrotechnical Commission. International standards and conformity assessment body
A measurement of light brightness that hits a surface. Used to measure room brightness or
illuminance
simulating different room brightness for television testing
A measurement of light brightness emitted, specifically luminous intensity per unit area. Used for
luminance
measuring screen brightness
Water heaters
COP Coefficient of performance
HPWH Heat pump water heater
SCOP Seasonal coefficient of performance
TUEC Total unit energy consumption
iv4E PEET METHODOLOGY REPORT JANUARY 2021
1. Introduction to PEET
In recognition of the important contribution that product energy efficiency plays in improving access
to clean, affordable and secure energy services, all 4E Member countries implement policy measures
targeted at numerous categories of appliances and equipment. The most popular and effective policies
include Minimum Energy Performance Standards (MEPS) and energy labelling initiatives that, when
regulated, apply to all specified products within an economy.
The Technology Collaboration Programme on Energy Efficient End-Use Equipment (4E TCP)
initiated the Product Energy Efficiency Trends (PEET) to assist governments with their policy
development processes designed to encourage innovation and improve access to energy efficient
products.
This ambitious project aims to monitor the energy efficiency of a core set of products in 4E Member
countries or regions, and to provide information on their progress year on year. Although government
policies have been shown to be extremely effective1, the uptake of new efficient technologies varies
by region. PEET will therefore help governments and others to understand how product energy
efficiency performance varies over time and between regions.
Undertaking comparisons over time and between regions is a complex process, requiring many factors
to be taken into account. This report details how these technical issues are dealt with in the PEET
analysis.
It should be noted that, because PEET reports trends are based on the aggregation of large numbers
of models, and for other reasons discussed in this report, conclusions cannot be drawn regarding
individual models.
Nevertheless, the results of the PEET analyses should be usefull to assist government to assess their
policy settings and highlight opportunities to scale up levels of ambition for energy efficient products.
As such, they can act as a trigger for more thorough investigations at a national and products level.
1
See: ‘4E Achievements of Appliance and Equipment Standards and Labelling Programs – a global assessment, 2016.’
https://www.iea-4e.org/document/387/achievements-of-appliance-energy-efficiency-standards-and-labelling-programs-a-
global-assessment-in-2016
Page 14E PEET METHODOLOGY REPORT JANUARY 2021
2. Introduction to PEET Methodology Report
This document presents the methodologies used for 4E’s Product Energy Efficiency Trends (PEET)
project. The document considers methodologies for each of the following product categories:
International Regional test methods Regional test method
test method + user profile
Domestic Refrigerators &
Computers Air Conditioners
Freezers
Lighting (LEDs) Washing Machines Water Heaters
Electric Motors Distribution Transformers
Televisions
The purpose of these methodologies is to allow comparability of equipment energy efficiency data so
that trends in performance can be developed across the 4E economies and also over time. To this end
the methodologies mostly focus on:
a) Identification of pertinent regional, economy-specific and temporal differences in product scope
and definitions, test methods and performance metrics; and
b) Setting out methodologies that can be applied to normalise performance metrics across products
(both geographically and temporally).
In each case the starting point of the analysis is the methodologies used in previous work done for
these products under the IEA 4E Mapping and Benchmarking Annex (M&B Annex), referred to in
discussions of each product category below.
For each product category, consideration of the most appropriate methodology takes into account the
following:
• The likely relevance of the product in terms of energy savings.
• The scope set out in the product definition.
• The energy performance metrics.
• The characteristics and similarity of test procedures used in each 4E Member economy and
hence the degree of comparability of the energy performance metrics.
• The feasibility and means of normalising the energy performance metrics across different test
procedures and energy performance metrics to permit efficiency comparisons across
economies.
• The feasibility and means of normalising energy performance metrics across different vintages
of test procedures and energy performance metrics to permit efficiency trends analysis.
Following an assessment of these considerations, the decisions made on how each product category
will be treated within the PEET analysis are summarised in Table 1.
Page 24E PEET METHODOLOGY REPORT JANUARY 2021
Table 1: Summary of PEET methodology per product category
Product type Inclusion in PEET? Approach to comparability and normalisation Method of comparison
Scope
Metric(s)
in the PEET
economies?
across 4E
Normalisation
scope?
types in
across product
Normalisation
method
Normalisation
compatibility
Backwards
compatibility
Future
Air Yes Split packaged and EER, Yes No - treat main types As derived and verified in Feasible when Yes Average performance of models
conditioners unitary packaged CSPF/SEE independently CLASP/SEAD benchmarking CSPF/ in designated capacity ranges
R/APF study from 2011 - requires data on SEER/APF
whether units are fixed or variable data is
speed. Method amended to available
include LBNL 2020 work and an
updated method explained in this
report
Computers Yes Desktops and Yes Yes (test methods) - treat Derivation of a parametric Mostly yes Yes Average performance of models
Intregated Desktops main types independently normalisation model informed by in designated feature and
eith possibility of comparative analysis of the data size/capacity ranges
adding workstations No (frequency/ voltage) – for the same products when rated
in the future products treated as single under different test methods
product type
Distribution Yes Liquid 3-phase with Efficiency Yes No - treat main types Same methods as used in Yes Yes Average performance of models
transformers possibility of adding at 50% independently (note, this will previous M&B work with a minor in designated capacity ranges
single-phase, pole- load, only apply if other types are adjustment
mounted, and dry- treated in the future)
type in the future
Domestic Yes Refrigerator-freezers kWh/year Yes No - treat main types (direct Derivation of theoretical Yes Yes, in Average performance of models
Refrigerators and as a cool and frost free) adjustment factors to take account principle in designated adjusted volume
& Freezers function of independently of the differences in the test but may and feature ranges
adjusted procedure treatment of the main require
volume physical phenomena additional
adjustme
nt
Electric Yes Low voltage AC Efficiency, Yes Yes, but report results by Based on relative comparability of Yes Yes Average performance of models
motors induction, 2/4/6/8 IE class sub-class IE3 and NEMA premium when in designated capacity ranges
pole, 0.1 to 1000kW comparing IEC to IEEE ratings
2 Page4E PEET METHODOLOGY REPORT JANUARY 2021
Product type Approach to comparability and normalisation Method of comparison
Inclusion in PEET?
Scope
Metric(s)
in the PEET
economies?
across 4E
Normalisation
types in scope?
across product
Normalisation
method
Normalisation
compatibility
Backwards
compatibility
Future
Lighting Yes Mains voltage Efficacy Yes Average performance of Evidence and analysis presented in Yes, but with Yes Average efficacy of models in
(domestic driver models in designated light this report shows that normalisation some designated luminous flux (light
LEDs) integrated output ranges is not needed adjustment output) ranges
non-directional needed for
LED lamps years pre
harmonised
standards
Standby Not as a NA NA NA NA NA NA NA NA
separate
category
but within
other
product
categories
Televisions Yes As previous Watts per Yes Yes, but report results by sub- None applied as reported data is Yes, but only Yes Average performance of
M&B study but unit screen class largely equivalent at the first order for years when models in designated size and
with some area - harmonised feature ranges
clarifications presented standards are
per screen used
area size
range
Washing Yes Fully As used I Only if Only if using aligned test Normalisation across test methods is Yes Yes Average performance of
machines automatic each using methods not viable and is not recommended models in designated washing
domestic economy aligne for this category load ranges
washing d test
machines metho
ds
Water heaters Yes Electric TUEC and Yes Yes, but report results by sub- Same methods as used in previous Yes Expecte Average performance of
storage water TUEC as class M&B work d to be models in designated storage
heaters function of yes capacity or hot water load
including heat capacity ranges
pump types
3 Page4E PEET METHODOLOGY REPORT JANUARY 2021
3. Treatment of data: all products
3.1 Data source and type
PEET data is provided by 4E Member governments as indicative of the performance of products on
their market and the sources are described in the annual PEET analysis report. Typically, data is drawn
from that provided by manufacturers that register their product performance under national or
regional energy efficiency regulations. This information is used to determine the appropriate energy
label for products, where applicable, and is subject to national verification activities.
Such product performance data is derived in most cases from laboratory measurements according to
a test standard which is referred to or included in the energy efficiency regulations.
While the source data that PEET uses exists at an individual product level, PEET is concerned with
overall trends and therefore PEET reporting only ever deals with aggregated results covering market
or economy-wide averages.
3.2 Reference model groups
To aid comparison of product energy performance across 4E economies and over time, PEET selects a
set of 3 to 4 representative products (reference models) per product category. These are defined in
terms of a narrow window of capacities (e.g. rated power for motors, or adjusted volume for
refrigerator-freezers) per reference model selection. The PEET analysis examines all models which fall
within these windows for each 4E market.
The selection of reference model categories aims to:
• Cover a range of capacities across the spectrum of product capacities which are subject to
policy measures.
• Cover the most important part of the market in terms of sales, energy consumption and
energy savings potentials.
• Ensure that products within the selected capacity ranges can be found in as many of the 4E
markets as possible.
• Have as narrow a capacity bandwidth as possible (to aid equitable energy performance
comparison) but still have a significant market share in as many economies as possible.
Additional information, including the list of PEET Reference Models is contained in Appendix A at the
end of this document.
3.3 Normalisation
To compare the energy performance of equivalent products from countries or regions that are based
on different measurements standards, or when measurement standards for a country or region change
over time, the data must be normalised. This is a correction based on a combination of theoretical and
empirical information.
Typically, different measurement standards may have different test conditions, e.g. ambient
temperature, humidity, water inlet temperature. The normalisation process aims to “translate” one
(set of) condition(s) into another one (set) by estimating the effect of the difference on the relevant
parameter(s) - energy consumption, performance, efficiency.
For example, if ‘measurement standard A’ tests a refrigerator at an ambient temperature of 20oC and
‘measurement standard B’ tests the same product at 25oC, we can translate the results from A to B
when we know that for each degree higher ambient temperature the recorded energy consumption
increases by 2% (this is a hypothetical example).
While the normalisation process seeks to ‘correct’ for differences in measurement standards, it does
not correct for technical differences in products that provide broadly equivalent services. For example,
Page 44E PEET METHODOLOGY REPORT JANUARY 2021
air conditioners with either a fixed speed or variable speed compressor provide a cooling service, but
they do so using different technology. Similarly, some refrigerators utilise vacuum panels while other
do not. PEET treats these different technologies as comparable.
Although it can be argued that these deliver a different service and therefore should not be compared,
for the purpose of the PEET analysis it makes sense to ignore these technical characteristics of
products. This is because PEET aims to highlight any significant differences in product performance
between countries and regions, which might present opportunities for government policy
intervention. Such major differences stimulate further investigation of the underlying causes, and
whether policies need to change or be introduced to be more effective.
Normalisation can be complex, particularly where there are several interdependent parameters
involved. However, in most cases the results are sufficiently accurate to indicate broad trends for
products, as reported in the PEET analysis, where the margins of error are reduced by using the average
of multiple models within the reference models groupings. Normalisation is not required where
common international measurement standards are widely used. Comparison of product performance
across regions would be made significantly easier by the widescale adoption of robust international
measurement standards.
3.4 Averaging
For each economy and product type addressed in the PEET analysis report, average values of the
capacity, efficiency metric and MEPS levels are reported for each of these reference model groups.
These values concern the average values that are applicable in a given economy and year.
The average is computed as a simple average of the values that apply to the set of models that fall
within the scope of each reference model group. If model sales data is available then sales-weighted
average values are reported, but more commonly there is no information on the relative sales of
specific models, so in these cases each model within the reference group is assumed to sell equally
well.
In the case of MEPS, the MEPS level that would apply to each model that falls within the scope of the
reference model groupings is calculated and the values are then averaged for each reference model
group. This practice ensures that, even if there are a set of sub-groups that have different MEPS
formulae within a given product reference model group, their MEPS values may be compared.
Page 54E PEET METHODOLOGY REPORT JANUARY 2021
4. Air conditioners
4.1 Energy savings relevance
Air conditioners are widely used in many 4E economies, are relatively energy intensive and have
significant energy savings potentials through the use of efficient equipment. Furthermore, they are
subject to market failures that tend to prevent the market from optimising the energy efficiency of the
product over its lifetime in the absence of remedial energy efficiency policies, such as MEPS and energy
labelling.
The use of air conditioners is growing rapidly around the world, especially in Asia. Therefore, air
conditioners are a highly relevant product category to be included in the PEET analysis. Nonetheless,
they are a product category for which there are significant differences in local market preferences for
product types, test procedures and efficiency metrics; and this complicates the ability to compare
efficiency across economies that do not use harmonised test methods and efficiency metrics.
4.2 Scope and definition
The PEET scope is residential air-conditioners, with an upper cooling capacity limit of 14 kW.
In addition:
• Only electrically driven vapour compression cycle units are considered.
• Only air-cooled air conditioners are considered.
• Only units that cool air directly are considered. This excludes units that chill water for the
cooling medium.
• Unitary (e.g. window/wall) packaged units and split-packaged (e.g. mini-splits) are included.
• Ducted central air conditioners, single and double-duct air conditioners are excluded.
• Only the cooling mode of reverse cycle units is assessed in the PEET analysis.
Single and double-duct air conditioners are excluded as they are only sold in modest numbers
internationally, have specific (non-negligible) comparability issues and low energy consumption (due
to low hours of use and small numbers).
The large bulk of the product that remain in scope are split-packaged room air conditioners which
dominate all the international market (see Table 2) except North America (and to a much lesser extent
Australia), where central ducted air conditioners (i.e. with ducting integrated into the building fabric)
are most common. Despite the importance within North America of ducted air conditioners, these are
excluded from the current PEET analysis because they are a very different product category to non-
ducted packaged air conditioners (such as split units). In particular, the PEET study team are unaware
of any prior benchmarking work to compare ducted and non-ducted units performance and given the
difference in their respective test methods plus the need to factor in the influence of the building
integrated ducting system for a comparison to be meaningful it seems premature to attempt such a
comparison without much more foundational work being conducted 2.
2
For comparisons to be made between the efficiency of ducted AC systems and those of non-ducted packaged AC systems
used in residential applications then the losses in the ducting used for the indoor side of ducted AC systems would need to
be accounted for. While being able to include ducted systems with adjustment for duct losses in the analysis would be useful,
because this equipment represents the majority of the market in the US and Canada and an important part of the Australian
market, no prior work has been done to our knowledge that would allow comparisons to be made on an equitable basis and
much fresh work would be needed to derive a normalisation methodology and determine its robustness. For this reason,
ducted systems are not included in the present PEET analysis.
Page 64E PEET METHODOLOGY REPORT JANUARY 2021
Table 2: Estimated global air conditioner market, 20183
Type Global sales in 2018 (millions)
Window type 12.6
Single-split 79.3
Multi-split 4.2
Commercial air conditioners 14.9
Total 110
Although the focus of the present PEET analysis is on the cooling mode performance, most air
conditioners sold can deliver both heating and cooling; and the heating mode performance is also
important. Technically, the provision of reversible functionality makes negligible difference to the
performance in the cooling mode and, furthermore, performance in the cooling mode and the heating
mode is strongly correlated, i.e. products with relatively good cooling mode efficiency also tend to
have relatively good heating mode efficiency.
In general, heating mode performance is not analysed in PEET, although it is taken into account when
it is part of an overall seasonal energy performance metric such as an Annual Performance Factor
(APF). Its exclusion is for pragmatic reasons, namely that no prior benchmarking work has been done
that considers the heating mode in isolation while some has been done that considers conversions
between cooling mode only performance metrics and annual performance factors.
4.3 Energy performance metrics
The energy efficiency ratio (EER) is the cooling efficiency expressed as the cooling power delivered per
unit of input power when the product is tested at full load (i.e. full rated capacity).
The EER is a readily comparable metric and is always reported, but is also a rather limited metric
because air conditioners are mostly operated at part load. In consequence, a variety of economy
specific part-load metrics are now used in most 4E energy efficiency regulations such as energy labels,
MEPS and Top Runner requirements. These are mostly expressed in the form of seasonal energy
efficiency ratios (SEERs)4 where the efficiency is tested at various loading conditions e.g. 25% of full
load, 50% of full load, 75% of full load and 100% of full load. Then an aggregate metric (the SEER, CSPF
or APF) is derived by applying weightings to these part-load efficiency ratings based on the typical
usage pattern in the economy in question. The biggest efficiency gains in air conditioners in recent
years have come from improving their part-load performance rather than the full load performance
(EER) and thus the PEET analysis examines trends and comparability in both the EER performance and
the part-load performance (where data is available) such as the SEERs (or equivalent weighted part-
load metrics) used in most 4E economies.
4.4 Characteristics and similarity of test procedures used in each 4E
member economy
There is a considerable degree of harmonisation in how air conditioners are tested and rated at full
capacity to produce the EER values. There is a similarly high degree of harmonisation in the way that
performance is tested at any given specified part-load condition [see IEA 4E 2020]. The main
differences are to do with rounding between Celsius and Fahrenheit temperature conditions and some
modest variations in tolerances. The situation becomes more complex when aggregate SEER type
scores are derived. This is because the specific part-load test points used are not necessarily the same
from one economy to another and also because the weightings given to the part load conditions vary
3 The Japan Refrigeration and Air Conditioning Industry Association, World Air Conditioner Demand by Region, June 2019
4 Or Cooling Seasonal Performance Factors (CSPFs) or Annual Performance Factors (APFs) but the same principle applies.
Page 74E PEET METHODOLOGY REPORT JANUARY 2021
from one economy to another. Furthermore, some economies include other loads such as standby and
starter loads, while others just focus solely on the cooling mode efficiency.
4.5 Normalisation
The first step is to convert all data into metric units, thus EER’s and seasonally weighted part-load
performance metrics are expressed in units of W/W.
Normalisation of the minor differences in test temperature conditions (due to the Fahrenheit to Celsius
rounding differences) and the more significant differences in permitted tolerances. These effects are
known to alter the nominal EER by ~ 7%.
The normalisation methodologies used for PEET for both the EER and the SEER (or equivalent metrics)
is based on that used in the extensive CLASP Benchmarking study published in 2011 [CLASP 2011] for
cooling mode comparisons and recent work by Lawrence Berkeley National Laboratories [LBNL 2020].
Both of these studies derive detailed normalisation methodologies to allow conversion between the
various SEER or equivalent metrics in use among the 4E economies. The original CLASP study is the
more extensive of the two as it is based on fitting normalisation relationship to a larger set of models
for which detailed full and part-load test data is available. The accuracy of the relationships it
established were also subsequently verified through comparing the predicted results to detailed test
data from a small set of models that were not used to derive the initial benchmarking relationships
and were found to be good.
The problem with these older relationships is that since that work was done some of the test
procedures used in 4E economies have been revised in a manner that would affect the relationships.
An analysis done for this study5, and confirmed through dialogue with the authors of the LBNL paper,
established that the EU and US/Canadian test procedures and seasonal efficiency metrics have
ostensibly remained unchanged since the time of the CLASP study; however, the Japanese and Korean
test procedures and efficiency metrics have undergone some important changes6 that make the
original CLASP relationships no longer valid when converting to, or from, those metrics. Analysis of the
LBNL results (see Table B1 of [LBNL 2020]) shows that the relationships to convert efficiency rankings
from one economy’s metric to another’s have a good degree of reliability when converting between
the current Japanese, Chinese and Korean metrics, but are much poorer when converting between
these and the US/Canadian and EU metrics. As the 2011 CLASP metrics are still applicable and reliable
when converting between the US/Canadian and EU metrics, it seems appropriate to use them for that
purpose and use the 2020 LBNL ones for conversions between the Japanese/Korean/Chinese metrics;
however, this still leaves open the issue of how best to convert between the set of US/Canadian/EU
metrics and the Japanese/Korean/Chinese metrics.
To update the conversion relationships for the revised Japanese test procedure and metrics, the
following procedure is used. The principal changes in the Japanese efficiency metric from 20117 to now
are an increase from 33°C to 35°C in the ambient test temperature at full load and amended weightings
(no. of hours) spent at each part-load test point. The CLASP study data and methodology already
derives a relationship of the cooling efficiency performance as a function of the ambient temperature
and so this was applied to convert the full load test data results to reflect the values to be expected at
35°C in place of 33°C. It is then a simple matter to update the weightings applied to each part-load
condition to derive the expected 2013 efficiency metric values. Once this was done for each model in
the original CLASP study dataset8, new conversion relationships were derived between the current (i.e.
post 2013) Japanese efficiency metric (APF) and the US/Canadian and EU metrics. The relationships
shown in Table 3 were found to have R2 values9 of between 0.9977 and 0.9982 which are both excellent
5
And also informed by a recent review of AC test procedures (IEA4E 2020).
6
In 2013 for Japan and 2018 for Korea.
7
The actual changes were made in the test procedure which defines the efficiency metric in 2013.
8 Mostly inverter AC units with a range of cooling/heating capacities and efficiency levels some of which would be considered
to be high efficiency models even in today’s markets.
9
A measure of how good a correlation fit is, where 1 implies a perfect fit and 0 indicates there is no correlation at all.
Page 84E PEET METHODOLOGY REPORT JANUARY 2021
fits. The PEET analysis uses the various conversion relationships described above to convert between
all of the current 4E part-load efficiency metrics with a high degree of confidence in the robustness of
the conversion.
Table 3: Updated linear regression conversion formulae (Y=mX+C) for the US and EU SEERs as a function of
Japan’s APF
Y X M C R2
US SEER Japan APF 0.8293 0.6961 0.9977
EU SEER Japan APF 0.765 0.4957 0.9982
The normalisation formulae applied converts EER or SEER (or equivalent part-load) metrics between
the methods used in China, Europe, Japan, Korea and the USA/Canada and thus cover the methods
used in the majority of 4E economies. In the case of Australia, the metric used in the 2018/19 data and
earlier is a full load EER rating that is essentially comparable with other full load EER ratings. Also, it
should be noted that since 2014 the USA and Canada replaced a simple EER rating with a CEER which
adds in the effect of standby power losses for window-wall units. It does not affect the analysis of split
systems.
For unitary (window-wall) units, analysis has shown that the standby levels are rather low: for a typical
unit (based on analysis of Canadian data) it is 0.83W (0.15% of the on-mode cooling power) which will
lead to a 0.15% difference between the CEER and EER. This effect can be taken into account when
comparing older EER data from prior to 2014 with post 2014 data or with EER data from economies
that do not include standby losses.
The final set of conversion formulae used in the PEET are set out in Table 4a and 4b, where the
coefficients in Table 4a are for a linear function and those in Table 4b are for a sigmoid function of the
form:
Table 4a: Linear regression conversion formulae (Y=mX+C) coefficients used in the PEET for the US and EU
SEERs as a function of Japan’s APF, and as a function of each other
Y X m C R2
US SEER Japan APF 0.8293 0.6961 0.9977
EU SEER Japan APF 0.765 0.4957 0.9982
US SEER EU SEER 0.919 -0.216 0.992
EU SEER US SEER 1.08 0.286 0.992
Table 4b: Non-linear regression conversion coefficients used in the PEET for the China APF and Korea CSPF as
a function of Japan’s APF
Y X a b C D R2
Japan APF China APF 1.763 5.614 3.953 8.002 0.987
Japan APF Korea CSPF -555,719 0.533 5.07E-09 13.961 0.990
Page 94E PEET METHODOLOGY REPORT JANUARY 2021
Backwards and future comparability
The previous Mapping and Benchmarking analysis focused on time series of EERs value and this metric
will still be used for PEET and so EER trends can be compared. In the case of the historic SEER (or
equivalent part-load performance metric) comparisons it is only possible to derive these when there
is historic SEER or equivalent part-load performance data.
4.6 References
The most recent 4E Mapping and Benchmarking study was conducted in 2011 and covered the
following economies: Australia, Canada, Korea, USA (EU10, China).
Links to the reports are here:
Benchmarking report: https://mappingandbenchmarking.iea-4e.org/shared_files/130/download
Summary policy brief: https://mappingandbenchmarking.iea-4e.org/shared_files/284/download
Product definition: https://mappingandbenchmarking.iea-4e.org/shared_files/41/download
CLASP 2011, COOLING BENCHMARKING STUDY Part 2: Benchmarking Component Report
https://storage.googleapis.com/clasp-siteattachments/RAC-benchmarking_2-Benchmarking-
component.pdf
IEA 4E (2020) Domestic Air Conditioner Test Standards and Harmonization
https://www.iea-4e.org/document/442/domestic-air-conditioner-test-standards-and-harmonization
LBNL 2020, Lost in translation: Overcoming divergent seasonal performance metrics to strengthen air
conditioner energy-efficiency policies
https://www.sciencedirect.com/science/article/pii/S0973082619313560#t0005
Page 104E PEET METHODOLOGY REPORT JANUARY 2021
5. Computers
5.1 Energy savings relevance
It is estimated that a total of 162.3 million notebook computers and 94.4 million desktop computers
were sold globally in 2018.10 Workstation computers11, with global sales in 2018 of an estimated 5.4
million12, are one of the only types of personal computer that have increased sales over the last few
years.
There is a large variance in overall energy consumption within notebooks, mostly stemming from
differences in computing performances. The level of energy efficiency in notebook computers can also
vary depending on usage. For example, notebooks may provide higher computation performances,
when operated on a mains connection compared to when operated on a battery connection. This large
variance suggests that energy savings opportunities are still available within the notebook computer
product category.
Notebook computer manufacturers are few in number with the majority being global players, so there
is a relatively small chance that product efficiencies will vary significantly across different markets.
Notebook computers are also largely optimised for energy efficiency due to users’ preferences for
extended operation on battery power. So, whilst there is still some variance in notebook energy
efficiency for a given level of performance, this variance is smaller than in other types of personal
computer.
The variance in energy use between desktop computers can be significant and higher in desktop
computers than for the notebook computers. In addition, because desktop computers are often open
box products i.e. individual components can be easily sourced and assembled into a desktop, there are
a larger number of manufacturers placing products on the market. With larger numbers of
manufacturers comes a greater likelihood of regional differences in product energy efficiency levels.
Workstation computers are designed to provide high levels of computational performance and energy
efficiency is not always a major consideration.
5.2 Scope and definition
As remarked above, there is likely to be more variance in the energy efficiency levels of desktop and
workstation computers than is the case for notebook computers. This variance would likely be seen
between products providing the same, or similar, levels of functionality, and potentially between
products on different markets. As a result, the PEET analysis is focussed on desktop computers only,
although it could address workstation computers in the future.
To analyse desktop (and potentially workstation computers), the definitions, energy performance data
and technical characteristics found within the latest available US ENERGY STAR program specification
for computers is used, i.e. v7.1 13 14. The main data requirements are listed in Table 5.
10
https://www.statista.com/statistics/272595/global-shipments-forecast-for-tablets-laptops-and-desktop-pcs/
11 Workstation computers are high-performance, single-user computers typically used for graphics, CAD, software
development, financial and scientific applications among other compute intensive tasks. Workstations are marketed as
workstation rather than “desktop computers” and do not support altering frequency or voltage beyond the CPU and GPU
manufacturers’ operating specifications. In addition, Workstation computers include system hardware that supports error-
correcting code (ECC) that detects and corrects errors with dedicated circuitry on and across the CPU, interconnect, and
system memory. Workstations are further differentiated from even high specification desktop computers by offering
additional features such as support for one or more discrete graphic cards, support for more than one processor and/or are
certified by Independent Software Vendors (ISV) as workstations.
12 https://www.statista.com/statistics/268429/workstation-shipments-worldwide-since-the-3rd-quarter-2008/
13 https://www.energystar.gov/products/office_equipment/computers/partners
14
The ENERGY STAR v8.0 specification is set to become effective on the 15th July 2020 (although manufacturers have been
able to elect to certify to v8.0 early since 15th October 15 2019)
Page 114E PEET METHODOLOGY REPORT JANUARY 2021
Table 5: Summary product categorisation matrix for desktop computers
Basic
Information Required to
Information
Computer Determine ENERGY STAR Enhanced Information Required to
Required to
Type v7.1 Category/Product Determine Efficiency
Determine
Definition
Efficiency
Desktop and • Central Processing Unit • Power • System memory:
Integrated (CPU) data: demand (W) o Installed RAM (GB)
Desktop o Number of physical CPU data: • Storage drives:
cores o Short Idle o Number of internal storage drives
o CPU clock speed (GHz) o Long Idle o Type of internal storage drive
(Max TDP core o Sleep • Presence of Enhanced Performance
frequency) o Off Display (Integrated Desktop only):
• Graphics Processing o A contrast ratio of at least 60:1 at a
Capabilities horizontal viewing angle of at least
o Presence of discrete 85°, with or without a screen cover
graphics processing unit glass
(dGfx) o A native resolution greater than or
o Presence of dGfx equal to 2.3 megapixels (MP);
switching capabilities o A colour gamut of at least sRGB as
(Integrated Desktop only) defined by IEC 61966-2-1.
o Frame buffer bandwidth • Test set up conditions:
(FB_BW) measured in o Identification of whether dGfx is
gigabytes per second active under test
(GB/s). o Display luminance settings (cd/m2)
5.3 Energy performance metrics
Most major global regions used the ENERGY STAR specifications and test procedures and requirements
to measure and influence the energy performance of desktop and workstation computers. The ENERGY
STAR computer specifications are subject to regular review and updating. The ENERGY STAR v7.1
specification was the most recent at the time of assessing data received as part of this project. It
includes energy performance metrics for a range of computer types, including desktop computers and
workstations. These energy performance metrics are based on a Typical Energy Consumption (TEC)
approach, measured in KWh per year and derived from a pre-determined amount of time spent in
different computer power states i.e. an assumed duty cycle. The desktop computer power modes
covered in ENERGY STAR v7.1 are:
• Long-Idle mode.
• Short-Idle mode.
• Sleep mode.
• Off Mode.
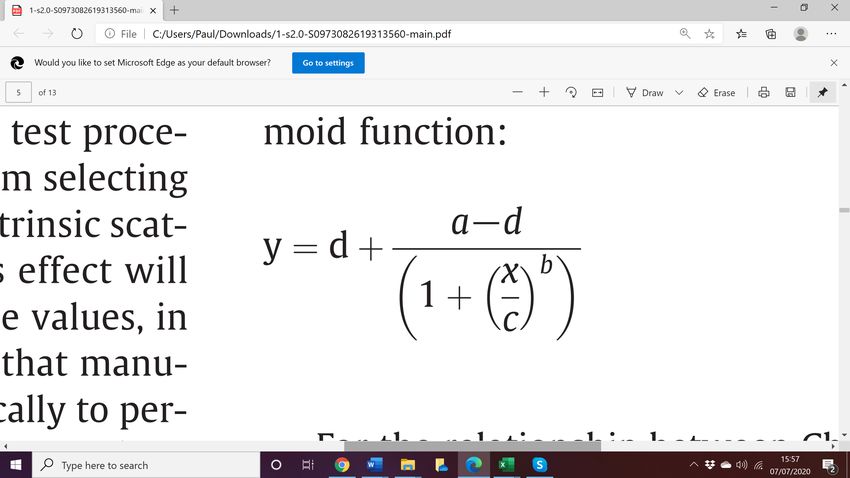
The ENERGY STAR v7.1 measured TEC values are calculated using the following formula:
%&'(
!"!# = )((( + ,-.// + ".// + -12334 + "12334 + -2.56_8923 + "2.56_8923 +
-1:.;4E PEET METHODOLOGY REPORT JANUARY 2021
The ENERGY STAR v7.1 specification includes additional use profiles for computers that support Full
Network Connectivity (i.e. enhanced functionalities) during low power modes.
The ENERGY STAR v7.1 derived TEC values provide an indication of how much energy a desktop
computer is likely to use over a year. To provide an indication of efficiency, the ENERGY STAR v7.1
specification groups computers of similar computational performances into six categories. The
categories are based on the performance score of the central processing unit (CPU) and the graphics
capability of the computer. The ENERGY STAR v7.1 specification then gives a base allowance for each
category of desktop computer which must be met in order to meet the ENERGY STAR energy efficiency
requirements.
The ENERGY STAR v7.1 specification also provides some additional allowances for key components
such as graphics cards, memory, storage devices and integrated displays.
Since ENERGY STAR specifications are updated periodically, at any one time different regions may be
implementing different versions of the ENERGY STAR specifications due to delays in implementing the
most recent version. Several significant mandatory policy measures dealing with the energy efficiency
of computers are still based on the ENERGY STAR v5.0 approach and test procedure.
The ENERGY STAR v5.0 specification also uses an annual TEC (kWh/year) and categorisation process to
describe desktop computer energy efficiency. There are several key differences between the ENERGY
STAR v7.1 and ENERGY STAR v5.0 specifications. Although, the ENERGY STAR v5.0 categorisation
process, as shown in Error! Reference source not found., is different, the product component i
nformation used to derive the ENERGY STAR v7.1 categories is included in ENERGY STAR v5.0 reported
data. It is therefore possible to use ENERGY STAR v5.0 data to identify a product’s category within
ENERGY STAR v7.1.
There is also a significant difference in the ENERGY STAR v5.0 and ENERGY STAR v7.1 approach on TEC.
Under the ENERGY STAR v5.0 specification there is only one idle mode, compared to the two (Long idle
and Short idle) under the ENERGY STAR v7.1 specification. For desktop computers, the ENERGY STAR
v5.0 idle mode equates to the ENERGY STAR v7.1 Short Idle mode. This means that ENERGY STAR v5.0
product data does not include a Long Idle power demand value. To compare the TEC values for ENERGY
STAR v5.0 to those derived under ENERGY STAR v7.1, the missing Long Idle values therefore need to
be estimated.
Table 6: ENERGY STAR v5 Desktop Categories
All desktop computers that do not meet the definition of Category B, Category C, or Category
Category A
D below will be considered under Category A for ENERGY STAR qualification.
To qualify under Category B, desktops must have:
Category B • Equal to 2 Physical Cores; and have:
• Greater than or equal to 2 gigabytes (GB) of System Memory.
To qualify under Category C, desktops must have:
• Greater than 2 Physical Cores.
In addition to the requirement above, models qualifying under Category C must be configured
Category C
with a minimum of 1 of the following 2 characteristics:
• Greater than or equal to 2 gigabytes (GB) of System Memory; and/or
• A Discrete GPU.
To qualify under Category D, desktops must have:
• Greater than or equal to 4 Physical Cores:
In addition to the requirement above, models qualifying under Category D must be configured
Category D
with a minimum of 1 of the following 2 characteristics:
• Greater than or equal to 4 gigabytes (GB) of System Memory; and/or
• A Discrete GPU with a Frame Buffer Width greater than 128-bit.
Page 134E PEET METHODOLOGY REPORT JANUARY 2021
5.4 Characteristics and similarities of test procedures used in each 4E
member economy
There is a high degree of harmonisation in the test procedures used to measure the energy efficiency
of notebook, desktop and workstation computers, as well as their associated IPS and EPS. There are
major differences in how the results of the tests are used to determine energy efficiency. The main
differences are mostly split between energy efficiency policies that are based on the ENERGY STAR
v5.0 approach and those based on the ENERGY STAR v7.1 approach. Error! Reference source not f
ound. identifies the test procedures and approaches used to determine energy efficiency of computers
within each 4E Member jurisdiction.
Page 144E PEET METHODOLOGY REPORT JANUARY 2021
Table 7: Computer Test Procedures and Approaches amongst 4E Members
Mandatory Major Voluntary Initiative Minor Voluntary Initiative
4E Member Computer Test Approach Test Procedure Approach Test Procedure Approach
Product Procedure
Australia Notebooks AS/NZS ENERGY
Desktops 5813.1:2012 STAR v5.0
derived
Workstations
EPS AS/NZS ENERGY
4665.1:2005 STAR v5.0
IPS AS/NZS derived
5814.1:201
Austria, Notebooks EN ENERGY IEC 62623, ENERGY
Denmark, EU, 62623:2013 STAR v5.0 Ed.1.0, 2012-10 STAR v7.1
France, Desktops EN derived
Sweden, 62623:2014
United Workstations Linpack and
Kingdom SPECviewperf
EPS EN ENERGY ** Uniform Test
50563:2011 STAR v5.0 Method
IPS * Generalized derived * Generalized
Test Protocol Test Protocol
Canada & Notebooks IEC 62623, ENERGY
USA Desktops Ed.1.0, 2012-10 STAR v7.1
Workstations Linpack and
SPECviewperf
EPS ** Uniform
Test Method
IPS * Generalized
Test Protocol
China Notebooks SAC GB 28380 ENERGY
: 2012 STAR v5.0
Desktops
derived
Workstations
EPS
IPS
Japan Notebooks IEC 62623, ENERGY
Desktops Ed.1.0, 2012-10 STAR v7.1
Workstations Linpack and
SPECviewperf
EPS ** Uniform
Test Method
IPS * Generalized
Test Protocol
Republic of Notebooks
Korea Desktops
Workstations
EPS
IPS
Switzerland Notebooks EN ENERGY IEC 62623, ENERGY
62623:2013 STAR v5.0 Ed.1.0, 2012-10 STAR v7.1
Desktops EN derived
62623:2014
Workstations Linpack and
SPECviewperf
EPS EN ENERGY ** Uniform
50563:2011 STAR v5.0 Test Method
IPS * Generalized derived * Generalized
Test Protocol Test Protocol
* Generalized Test Protocol for Calculating the Energy Efficiency of Internal Ac-Dc and Dc-Dc Power Supplies Revision 6.6 (April,2012).
** Uniform Test Method for Measuring the Energy Consumption of External Power Supplies, Appendix Z to 10 CFR Part 430.
Legend
No policy measures currently in place
Page 154E PEET METHODOLOGY REPORT JANUARY 2021
5.5 Normalisation
The normalisation of results to take account of test results obtained under different voltages and
frequencies is necessary in order to more accurately compare across markets. This normalisation was
done by identifying ratios of change across the different voltages. To avoid potential bias associated
with differing levels of computational performance within categories, ratios were developed using
products with exactly the same technical specification and tested at different voltages/frequencies.
See Appendix B for further details. The US ENERGY STAR v7.1 database was used to derive these
conversion factors as results were available for the same products tested at 115v/60Hz and 230v/50Hz.
The resulting conversion factors can be seen in Table 8.
Table 8: Conversion factors for normalisation of TEC values measured at 115v/60Hz and 230v/50Hz
Mean Percentage of test values
Product Type 115V/60Hz as % 230V/50Hz 230V/50Hz as % 115V/60Hz
Desktop 98.3% 102.7%
It was also necessary to conduct normalisation so that results obtained using the ENERGY STAR v5.0
approach (or derived from that approach) can be compared to results under an ENERGY STAR v7.1
approach. This required estimating power demands for idle modes that were not tested under an
ENERGY STAR v5.0 approach but that are tested under ENERGY STAR v7.1. The resulting conversion
factors are shown in Table 9.
Table 9: Conversion factors for normalisation of ENERGY STAR v5.0 Short Idle to ENERGY STAR v7.1 Long
Idle
Product Type Performance Level Long Idle as Percentage Short Idle (%)
All 93.5%
Low Performance 90.7%
Desktop
Medium Performance 96.3%
High Performance 96.1%
Model data was provided by the USA, Canada, Korea and Australia. The US database, which is a full
version of the US ENERGY STAR database, included details about which countries/regions each model
was available in. This US ENERGY STAR data was used to inform analysis of other countries as presented
here.
The Australian data was not suitable for the analysis as it did not contain any power demand or TEC
values. The Korean database included energy efficiency data based on the older ENERGY STAR v5.0
test procedure. This data was converted to estimated ENERGY STAR v7.1 TEC values. The conversion
involved identifying the difference in short and long idle power demands in the USA ENERGY STAR
database and assigning the average differences between these values to the Korean data. The average
differences are shown in Table 9 above. This allowed an estimation of the missing idle (i.e. short idle
for desktops and long idle for integrated desktop computers) power demands and calculation of an
estimated ENERGY STAR v7.1 TEC value. Furthermore, the Korean TEC values were converted to an
estimated TEC value when measured at 115v and 50Hz to allow for enhanced comparison with the
results in the US ENERGY STAR database. The Korean TEC values calculated using power measurements
taken at 220v 60Hz were converted to approximate 115v 60Hz values using the results from analysing
the differences between products tested at both 230v 50Hz and 115v 60Hz. The conversion factor used
Page 16You can also read