Implementation of Nationally Determined Contributions - 29/2018 Islamic Republic of Iran Country Report - Umweltbundesamt
←
→
Page content transcription
If your browser does not render page correctly, please read the page content below
CLIMATE CHANGE

 29/2018

Implementation of
Nationally Determined
Contributions
Islamic Republic of Iran Country Report
CLIMATE CHANGE 29/2018

Environmental Research of the
Federal Ministry for the
Environment, Nature Conservation
and Nuclear Safety

Project No. (FKZ) 3716 4111 80

Implementation of Nationally Determined
Contributions
Islamic Republic of Iran Country Report

by

María Yetano Roche, Cordelia Paetz, Carmen Dienst
Wuppertal Institute for Climate, Environment and Energy, Wuppertal

In cooperation with:

International data and graphs: Hanna Fekete, Lisa Luna
NewClimate Institute, Cologne

Country specific support and review: Yadollah Saboohi and Hesam Ghadaksak
Sharif Energy Research Institute (SERI), Sharif University of Technology, Tehran,
Islamic Republic of Iran

On behalf of the German Environment Agency
Imprint

Publisher:
Umweltbundesamt
Wörlitzer Platz 1
06844 Dessau-Roßlau
Tel: +49 340-2103-0
Fax: +49 340-2103-2285
info@umweltbundesamt.de
Internet: www.umweltbundesamt.de

  /umweltbundesamt.de
  /umweltbundesamt

Study performed by:
Wuppertal Institute for Climate, Environment and Energy
Döppersberg 19
42103 Wuppertal

Study completed in:
April 2018

Edited by:
Section I 2.1 Climate Protection
Juliane Berger

Publication as pdf:
http://www.umweltbundesamt.de/publikationen

ISSN 1862-4359

Dessau-Roßlau, November 2018

The responsibility for the content of this publication lies with the author(s).
Implementation of Nationally Determined Contributions: Islamic Republic of Iran

Introduction to the project
This country report is part of the “Implementation of Nationally Determined Contributions” (NDCs) project
(FKZ 3716 4111 80), which considers NDC implementation in 10 countries: Colombia, Ethiopia, Georgia,
Indonesia, Iran, Kenya, Marshall Islands, Morocco, Peru, and Viet Nam. This project places a special emphasis
on identifying potential barriers to NDC implementation and mitigation potentials which could go beyond
the current NDCs.
The country reports analyze the NDCs in terms of their robustness and coherence with other national or
sectoral plans and targets, and put them into the context of additional mitigation potentials and other
national circumstances. For countries where coal plays a critical role in consumption or national production,
the analysis covers further details on this sector, including the economic relevance and local impacts of coal
production or consumption. The content is based on available literature from research and public sector
information on policies and institutions.
To be able to analyze the content in more detail, the authors focus the research on a number of relevant
fields of action. The fields of action were selected based on historic and projected sectoral emissions
development, comprehensive literature on GHG mitigation potentials, identified barriers and emissions
reductions as well as feasibility, costs, and co-benefits.
The project was suggested and is financed by the Federal Ministry for the Environment, Nature Conservation
and Nuclear Safety, supervised by the German Environment Agency and carried out by independent think
tanks - NewClimate Institute and Wuppertal Institute. The country reports are a continuation of similar
previous efforts (project numbers 3713 41 102, 3711 41 120, 360 16 022, 364 01 003 and 363 01 128) and
aim to inform policy makers and the interested public about the implementation of NDCs in individual
countries. The choice of countries is based on developing countries with which Germany works closely on
climate change topics.
The country reports are scientific in nature, and all suggestions are derived by the authors from careful
analysis, having in mind the individual backgrounds of countries. They aim to increase knowledge about
implementation of mitigation potentials to meet the globally agreed goal of staying within a temperature
increase of 1.5°C or well below 2°C above preindustrial levels, without intending to prescribe specific policies.

                                                                                                               5
Implementation of Nationally Determined Contributions: Islamic Republic of Iran
Overview
Overview........................................................................................................................................................... 6
List of figures .................................................................................................................................................... 7
List of tables...................................................................................................................................................... 7
List of abbreviations ......................................................................................................................................... 8
1 Part I: Summary.......................................................................................................................................... 9
1.1 Country background ...................................................................................................................... 9
1.2 Emissions and energy use ............................................................................................................. 9
1.3 INDC and ongoing activities ........................................................................................................ 11
1.4 Further mitigation potentials and barriers.................................................................................. 13
2 Part II: Full country analysis ..................................................................................................................... 15
2.1 Country background .................................................................................................................... 15
2.2 Institutional set up ...................................................................................................................... 22
2.3 MRV of GHG emissions................................................................................................................ 24
2.4 Description and evaluation of the INDC ...................................................................................... 24
2.5 Climate change mitigation policies and strategies...................................................................... 26
2.5.1 National Communications & Strategies ................................................................................... 26
2.5.2 NAMAs, carbon finance and CDM ............................................................................................ 28
2.5.3 Climate change related policies ............................................................................................... 29
2.6 Additional mitigation potential ................................................................................................... 30
2.6.1 Demand-side efficiency through energy price reform ............................................................. 31
2.6.1.1 Barriers to implementation of the Energy Price Reform 32
2.6.2 Upstream oil and gas efficiency (with an emphasis on gas flaring) ......................................... 33
2.6.2.1 Barriers to implementation of upstream oil and gas efficiency 35
2.6.3 Investment in sustainable energy technologies (with an emphasis on renewable
energy) ............................................................................................................................. 35
2.6.3.1 Barriers to implementation of sustainable energy technologies 37
2.7 Overarching barriers to implementation of additional actions .................................................. 38
2.8 Conclusions.................................................................................................................................. 39
3 References................................................................................................................................................ 40
6Implementation of Nationally Determined Contributions: Islamic Republic of Iran
List of figures
Figure 1: Emissions profile of Iran ................................................................................. 10
Figure 2: Energy profile of Iran, 1990 to 2014 ............................................................... 11
Figure 3: Historic emissions, BAU projections and pledge according to Iran’s INDC
(energy sector only) ............................................................................ 12
Figure 4: Selection process for proposed fields of action in Iran .................................. 14
Figure 5: Map of the Islamic Republic of Iran ............................................................... 15
Figure 6: Emissions profile of Iran .................................................................................. 19
Figure 7: Iran emissions and energy use intensity, 1990 - 2014 ................................... 20
Figure 8: Energy profile of Iran, 1990 to 2014 ............................................................... 21
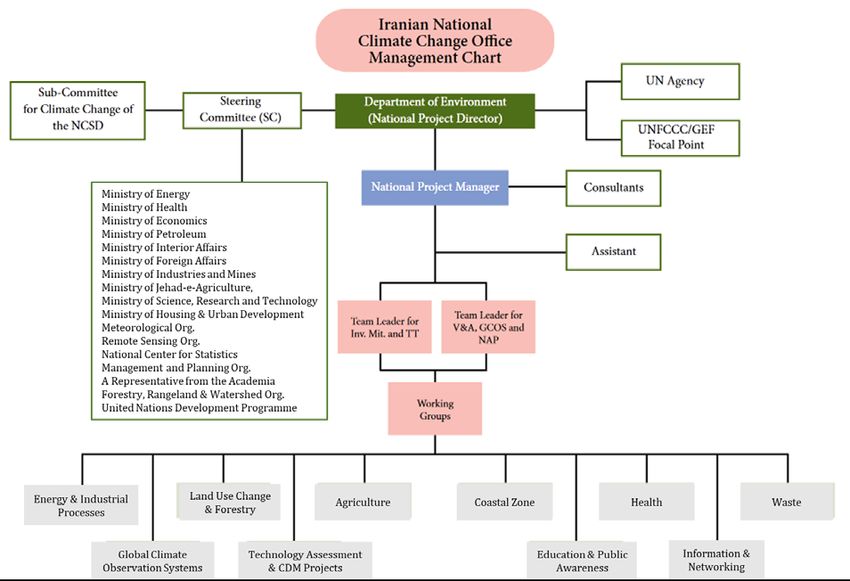
Figure 9: National Climate Change Office Management Chart ..................................... 23
Figure 10: Historic emissions, BAU projections and pledge according to Iran’s INDC
(energy sector only) ............................................................................ 26
Figure 11: Selection process for proposed fields of action in Iran ................................ 31
Figure 12: Actual vs. planned flared gas volume in Iran ................................................ 34
Figure 13: CO2 Emissions in alternative scenarios ......................................................... 37
List of tables
Table 1: Key socio-economic figures .............................................................................. 16
Table 2: Emissions data from PRIMAP (2014) ................................................................ 19
Table 3: Emissions data from UNFCCC (2014) .............................................................. 19
Table 4: Key emissions, energy and environmental data (2014) .................................. 20
Table 5: Total primary energy supply by fuel in 2014 .................................................... 21
Table 6: Mitigation measures in draft Third National Communication (NC3), Energy
sector (DoE and UNDP, 2014) ............................................................. 28
7Implementation of Nationally Determined Contributions: Islamic Republic of Iran
List of abbreviations
BAU Business as Usual
CDM Clean Development Mechanism
CNG Compressed Natural Gas
COP23 Conference of the Parties 23 in Bonn
DoE Department of Environment
EOR Enhanced Oil Recovery
G77 Group of 77 at the United Nations
GHG Greenhouse Gas
HDI Human Development Index
INDC Intended Nationally Determined Contributions
JCPOA Joint Comprehensive Plan of Action
LMDC Like Minded Group of Developing Countries
LPG Liquid Petroleum Gas
MENA Middle East and North Africa
MRV Measurement, Reporting and Verification
NAMA Nationally Appropriate Mitigation Actions
NAP National Adaptation Plan
NC2 Second National Communication
NC3 Third National Communication (Draft)
NCCO National Climate Change Office
OPEC Organization of the Petroleum Exporting Countries
UNFCCC United Nations Framework Convention on Climate Change
8Implementation of Nationally Determined Contributions: Islamic Republic of Iran
1 Part I: Summary
1.1 Country background
The Islamic Republic of Iran (hereafter referred to as Iran) is located in Western Asia and is the second
largest country in the Middle-East, with a population of 80.3 million in 2016. Climate change is a
significant threat to Iran, which is most obvious in the water scarcity the country faces with declining
rainfall, exhausted groundwater reserves and evaporating lakes and rivers (DoE, 2015; HBS, 2017).
Iran is an upper-middle income economy and the second largest economy in the Middle East and
North Africa (MENA) region (World Bank, 2017a). It became the fastest-growing economy of the
MENA region in 2016, after the implementation of the Joint Comprehensive Plan of Action (JCPOA),
otherwise known as the nuclear deal.
Iran has a key role in the global energy supply due to its abundant oil and natural gas reserves, and
is a founding member of OPEC. Hence, the most important economic sector is the energy sector, with
oil exports accounting for almost 33% of the government revenue and 15.8% of GDP (CBI, 2017). The
estimated GDP growth for 2016 was 6.4%, and future estimates of GDP growth range from 3.5 – 4% by
The International Monetary Fund (IMF) and World Bank to 8% in Iran’s sixth Five-Year Development
Plan.
Politically the Islamic Republic of Iran includes elements of Climate change strategy
a parliamentary democracy, in which the Constitution
Green growth strategy ()
affirms the independence of Executive, Legislative and
Judicial branches of power from each other. All three are Energy strategy aligned ()
under the direction of the Supreme Leader, Iran's head of with CC/GG strategy
state and highest political and religious authority of the Institutional coordination ()
country, ranking above the directly elected president. The on climate change
last presidential elections in Iran took place in May 2017. Renewable energy targets
Main responsibilities regarding climate change mitigation Level of NDC ambition n.a.
and adaptation lie with the Department of Environment (CAT rating)
(DoE), and therein in the National Climate Change Office.
The DoE is a governmental agency under the supervision
of the president. The bulk of Iran’s mitigation potential lies in its energy sector, including supply and
demand sub-sectors. As a result, several ministries and agencies play central roles in the country’s
climate-relevant policy architecture.
Iran has signed but not ratified the Paris Agreement. The Iranian Cabinet of Ministers approved the
Agreement in July 2016 and sent it to the parliament for consent to ratification (European Parliament,
2017; WRI, 2016). At the time of writing, Iran had not deposited its instrument of ratification with the
Secretary-General of the United Nations. In the international climate negotiations, Iran is a member of
the G77 and the Like-Minded Group of Developing Countries (LMDC).
1.2 Emissions and energy use
In 2014, Iran’s GHG emissions reached an all-time high, with data ranging between 734 MtCO2e (excl.
LULUCF) according to WRI and CAIT (2017) and 813 MtCO2e (excl. LULUCF) according to PRIMAP
data (Gütschow et al. 2016, see Table 2). Iran features as the 11th largest emitter of GHG in recent
rankings (WRI and CAIT, 2017), representing more than 1% of global emissions. In the last 25 years
(1990-2015), Iran’s GHG emissions have more than tripled (European Parliament, 2017).
Iran’s emissions are dominated by the energy sector which accounts for 87% of overall GHG
emissions. Among the sub-sectors, energy supply (power generation and refineries) is the top
emitter, representing close to one third of emissions, followed by the two main energy demand
9Implementation of Nationally Determined Contributions: Islamic Republic of Iran
sectors: transportation and buildings (residential and commercial). In terms of fuel type, emissions
from natural gas represent a little over half of emissions, whereas petroleum products are responsible
for most of the remainder (Ministry of Energy, 2014). Upstream emissions from gas flaring during oil
extraction are an important source of emissions (Soltanieh et al., 2016). The business as usual (BAU)
scenario of Iran's INDC foresees that energy-related GHG emissions will grow 4.7% each year until
2030, which would result in an increase of GHG emissions from approximately 700 MtCO2e in 2010 to
over 1,700 MtCO2e in 2030 (DoE and UNDP, 2014).
Energy system. Primary energy supply in Iran added up to 236 Mtoe in 2014. Iran is an energy rich
country, and a net exporter. The abundance of energy resources has often led to their mismanagement
and inefficient use (Moshiri and Lechtenböhmer, 2015). In the past decade, energy consumption has
grown by more than 50%, driven by the economic development, demographic growth, urbanization,
and a highly subsidised energy market. The rapid growth has even led to supply shortfalls during peak
times. Still, the annual electricity consumption per capita (~3,000kWh/capita) is less than half of
Germany’s (~7,000kWh/capita). Primary energy demand is met mostly by natural gas (61%) and oil
(37%), with marginal contributions of coal, hydroelectric, nuclear power, and woody biomass. Over
84% of Iran’s power generation is produced from natural gas (THC, 2017).
In order to curtail wasteful energy use and limit domestic demand growth, Iran has pursued an energy
subsidy reform in the last two decades. Reforming the domestic energy market has been central in the
agenda of the country’s 5-year development plans of the country since 1995 (2nd, 3rd, and 4th Five-Year
Development Laws). The Law on Energy Consumption Pattern was passed in 2010, and the second
phase of reform was implemented in 2014. The essence of recent reforms has been to gradually raise
the prices of domestic petroleum products, natural gas, and electricity, while promoting the
participation of the private sector, the creation of energy service companies, and implementation of
energy efficient technologies. Energy subsidy reform is crucial from a climate change perspective,
however it has been slowed down by a range of factors. Among other things, reforms had an
inflationary effect and contributed to Iran’s growing budget deficit, and the amount of projected
revenue from subsidy savings has not always been realised.
Figure 1: Emissions profile of Iran
Data sources: Gütschow et al. (2016); UNFCCC (2016)
10Implementation of Nationally Determined Contributions: Islamic Republic of Iran
Figure 2: Energy profile of Iran, 1990 to 2014
Data sources: IEA (2016a)
1.3 INDC and ongoing activities
Iran’s Intended Nationally Determined Contribution (INDC) was published in November 2015, shortly
before the Paris Conference of Parties (COP21). The INDC contains an unconditional reduction
pledge of 4% versus a business-as-usual (BAU) scenario in 2030, and a pledge of 12% reduction
versus BAU subject to international financial and technical support (DoE, 2015). It is important to
note that both the unconditional and conditional pledges are subject to the removal of current
sanctions and absence of sanctions in the future. The cost of implementation is expected to be around
70 billion USD, split into 17.5 billion USD for the unconditional reduction and 52.5 billion USD for the
additional 8%.
An analysis by the European Parliament (2017) considers that the pledges are relatively modest
compared to the projected increase in emissions. A series of bottom-up scenarios on Iran’s future
energy system (Moshiri and Lechtenböhmer, 2015) indicate that the cost-efficient potential emission
reductions by 2030 could be around 40% against BAU with energy efficiency measures, and up to 50%
if combined with renewable energy.
11Implementation of Nationally Determined Contributions: Islamic Republic of Iran
Figure 3: Historic emissions, BAU projections and pledge according to Iran’s INDC (energy sector
only)
Intended Nationally Determined Contribution
2500
Greenhouse gas emissions (MtCO2e)
2249
2000
1500
1411
1000
697
500
377.8
0
1990 1995 2000 2005 2010 2015 2020 2025 2030
BAU - 3NC&INDC (only IPCC sec.1 Energy) BAU (2NC, 2010)
Unconditional INDC target (-4%) Conditional INDC target (-12%)
MP All Policies (2NC, 2010) PRIMAP
Data sources: DoE (2015), DoE and UNDP (2014), Gütschow et al., (2016). NB: only energy sector included in NC3 and
INDC. BAU = Business as Usual. MP = Mitigation scenario in NC2.
Ongoing activities. The strategic guidelines for climate action can be found in Iran’s Second National
Communication (NC2) (DoE and UNDP, 2010) and in the draft of the Third National Communication
(NC3) (DoE and UNDP, 2014). The draft NC3 formulates the main mitigation actions required to
achieve the INDC’s unconditional and conditional pledges in the energy sector, but has not yet been
submitted to the UNFCCC. In May 2017, Iran published a National Strategic Plan on Climate Change
(UNDP Iran, 2017).
National energy and subsidy reform strategies have a strong bearing on the Iranian climate strategy.
Some of the landmark climate-related energy policies include the Law on Energy Consumption Pattern
Reform, the feed-in tariff for renewable energy and the energy price reform law, also known as the
Targeted Subsidies Plan or Subsidy Removal Plan. An overarching measure of the 5th Development
Plan (2011-2015) was the target to reduce energy intensity by 30%. The current Sixth Development
Plan (2017-2021) contains no such overarching target, though it targets the reduction in energy use by
5% in buildings, the increase in renewable energy installed capacity to at least 5% of the country’s
total capacity by 2020, and a reduction of gas flaring by a minimum of 90% by 2021.
Four overarching barriers to realising Iran’s mitigation potential can be distinguished: international
trade sanctions, institutional capacities, access to energy-efficient technologies, and availability of
capital. The effect of lifting of the sanctions on mitigation activities is seen as “double-edged sword”:
on the one hand, sanctions may impede the achievement of mitigation goals, by hindering foreign
investments into low carbon technologies and, indirectly, technology transfer and financial
international relations. On the other hand, strong economic growth – which could well be the result of
lifted sanctions - could lead to higher emissions. The latter argument is however not fully backed by
recent developments: average annual growth rate of emissions during the last sanctions period (2009-
2014) was over 3.7%, which is lower than the 4.7% rate during the 2005-2009 but was still
12Implementation of Nationally Determined Contributions: Islamic Republic of Iran
significantly high. Experts consulted suggest that part of the reason for the lower emissions growth
rate during the last sanctions period was the increased use of natural gas in the energy mix.
Following a series of bilateral exchanges that emerged after the implementation of the nuclear deal,
Germany is expected to participate in a number of cooperation projects (BMU, 2017a). Moreover, the
German Federal Environment Ministry aims to support Iran in its implementation of national climate
action targets. It is expected that this collaboration will be reinforced by the signing of the
Memorandum of Understanding between the European Union and Iran regarding cooperation on
climate change (Council of the European Union, 2017). This MoU, which sprang from the High-Level
Conference on Climate Action and Sustainable Energy held in April 2017 in Tehran, was approved by
the EU Council in October 2017, but is still pending signature. It foresees technical assistance with an
emphasis on climate resilience as well as adaptation. Moreover, in 2016, the European Commission
announced plans to launch a High Level Energy Dialogue on non-nuclear energy with Iran. Funded by
the German International Climate Initiative (IKI) and underway since the summer of 2017, the Green
Energy Centre is an example of a capacity-building project that aims to respond to the skills and
training needs of Iran’s emerging renewable energy sector (BMU, 2017b).
Although strategies, policies and laws on improving energy efficiency and promotion of renewable
energy resources have been formulated in Iran since 1995, there are a series of challenges that hinder
their implementation. These include the monopolistic and state-regulated nature of the energy market,
unfavourable macro-economic factors and the modest success in promoting private investments in
energy efficiency and renewable energies, whether from international or domestic investors.
1.4 Further mitigation potentials and barriers
Further to the 4 to 12% reduction pledge (against BAU) presented in the INDC, there is considerable
additional mitigation potential. Following a review of Iran’s mitigation pledges, existing literature and
expert interviews, three fields of action have been selected for this study based on their mitigation
potential, feasibility, costs and potentials and co-benefits: demand-side efficiency through energy-
price reform, upstream oil and gas efficiency (with an emphasis on gas flaring) and sustainable energy
mix (with an emphasis on renewable energies).
The main criteria for the selection of these three areas is depicted in Figure 4. Iran’s energy sector is
almost entirely dependent on oil and gas and accounts for 87% of the country’s overall GHG emissions.
For this reason, all three fields of action belong to this sector. Among the sub-sectors, energy supply
(power generation and refineries) is the top emitter, representing close to one third of emissions,
followed by direct emissions from two main energy demand sectors: transportation and buildings
(residential and commercial). Upstream emissions from gas flaring are a further major source of
emissions, contributing as much as 19% to the country’s overall emissions. The government’s on-going
efforts to reduce the energy intensity of the economy already address all three areas - energy demand,
power supply and upstream oil and gas sector- and the INDC highlights these as well. Moreover, as will
become apparent in later sections, there are currently low hanging fruits and important windows of
opportunity in these areas, in particular in the context of the renewed international trade relations.
The following is a brief summary of each area.
Demand-side efficiency through energy price reform: The removal of subsidies, enshrined under
the government’s “Targeted Subsidies Plan“ and the “Law on Energy Consumption Pattern Reform“ is
a prerequisite for achieving energy efficiency. The government has instituted a series of energy
efficiency measures to accompany the reform, but experts consulted suggest that the implementation
of these measures needs to be strengthened. Moshiri (2015) recommends that the reform
incorporates a specific timeline and measures to achieve energy efficiency. Moreover, targeted
incentives and support to industry and households should be enhanced. Key sectors of focus are
13Implementation of Nationally Determined Contributions: Islamic Republic of Iran
transport, domestic heating and appliances, and industrial equipment. It is also crucial to raise
consumer awareness about potential savings from energy efficiency and the availability of appliances.
Pilot audits in industry and the adoption of standards for buildings and industry are further avenues
for action.
Figure 4: Selection process for proposed fields of action in Iran
Source: Authors
Upstream oil and gas efficiency, with an emphasis on gas flaring: best-practice examples across
the world suggest that gas flaring and venting can be significantly reduced using a combination of
incentives and penalties (World Bank, 2004). Countries such as Norway, the United States or Canada,
require onshore and offshore oil producers to direct associated gas towards a market, power
generation, or reinjection. Other key elements include maintaining a robust pipeline infrastructure and
the incentivising of domestic gas markets (through fuel switching, promotion of CNG fleets, etc.).
Increasing the accuracy of MRV is a crucial first step for Iran, where flare efficiencies of oil sites are not
reported or even measured (current data are derived from visual observation or satellite
measurements) (Soltanieh et al., 2016).
Investment in sustainable energy technologies, with an emphasis on renewable energy:
Governmental stakeholders are increasingly acknowledging the potential for renewable energy in
Iran, and various elements of the policy framework are being put into place, including the feed-in
tariff. However, the INDC and other policy documents suggest there is also a strong commitment to
combined cycle gas investments for the short term. Moreover, strategic planning for renewables is
currently lacking. Iran’s transition to a renewables-based future could benefit from transfer of policy
innovations and best practice from other regions, in particular in the MENA region. The limits imposed
on multi-lateral collaboration have to date hindered any significant collaboration in this area, but the
sector has recently gathered significant momentum.
14Implementation of Nationally Determined Contributions: Islamic Republic of Iran
2 Part II: Full country analysis
2.1 Country background
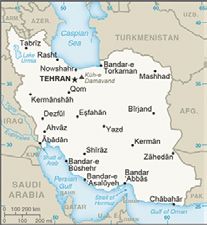
Iran, officially the Islamic Republic of Iran, is the second largest country in the Middle-East and covers
an area of 1.65 million km2. Iran is bordered to the north by Turkey, Armenia, Azerbaijan,
Turkmenistan and the Caspian Sea; to the east by Afghanistan and Pakistan; to the south by the
Persian Gulf and the Gulf of Oman, and to the west by Iraq.
Iran lies in the global sun belt. It therefore has not only vast underground fossil energy resources, but
also enormous potential for harvesting solar energy. Moreover there is considerable geothermal and
wind energy potential in different parts of the country (Supersberger et al., 2009).
Figure 5: Map of the Islamic Republic of Iran
Data sources: CIA (2017); MFA (2017)
Population. With a population of 80 million in 2016 (SCI, 2017; World Bank, 2017b), Iran has the
second largest population of the region after Egypt. The rate of population growth declined from 2.6%
p.a. in the beginning of the 1990s to 1.1% p.a. currently. Moreover, the average household size shrank
from 5.2 persons in 1991 to 3.3 persons in 2016 (SCI, 2017). About 74% of the population lived in
urbanised areas in 2014 (UN, 2017). By 2030, the population of Iran is forecast to reach 88.9 million
(UNDESA, 2017).
Economy. Iran is an upper-middle income economy and is the second largest economy in the Middle
East and North Africa (MENA) region after Saudi Arabia. Iran is a member of the G77, the largest
country grouping of developing countries. Its estimated Gross Domestic Product (GDP) in 2016 was
USD 412.2 billion (World Bank, 2017a). The Iranian economy relies mostly on oil and gas production,
agriculture and services. Iran has the world’s second largest proven natural gas reserves after Russia,
ranks fourth in proven crude oil reserves and is the second largest oil exporter in the Organization of
Petroleum Exporting Countries (OPEC) (EIA, 2017). Economic activity depends to a large extent on oil
revenues: in 2016, oil exports accounted for almost 50% of total export earnings, almost 33% of the
government revenue and 15.8% of GDP (CBI, 2017).
Iran’s crude oil and natural gas production growth declined over the last period of international
sanctions and its economy stagnated in 2015. It however bounced back sharply in 2016 with the
implementation of the JCPOA, at an estimated 6.4% GDP growth. Benefiting from the lifting of oil
sanctions on Iran and a recovery in exports, the inflation rate has decreased, from 39% in 2013 to 9%
in 2016 (FES, 2017). The Iranian government has laid out its economic policies and goals in the latest
Five-Year Development Plan for the 2017-2021 period as well as in the comprehensive Twenty-Year
Vision Document. On the economic front, the development plan envisages an annual economic growth
rate of 8% and reforms of state-owned enterprises. However, the World Bank and the International
Monetary Fund forecast annual GDP growth to continue at a rate of 3.5 to 4% in the near term (IMF,
2017; World Bank, 2017c). According to the latest economic outlook of the World Bank in October
15Implementation of Nationally Determined Contributions: Islamic Republic of Iran
2017, due to uncertainties over the full implementation of the JCPOA, growth prospects are modest
(World Bank, 2017d).
Table 1: Key socio-economic figures
Iran
Population [million], 2016 80.3 Urban population 73.9
[% of total], 2014
GDP [current billion USD], 393.4 Air pollution index (µg/m3) 43
2016
GDP per capita [current USD], 5,442.9 HDI, 2016 0.77
2014
Gini coefficient, 2013 38.3 Corruption index, 2016 29
Electrification rate, 2014 99.4% Vulnerability, 2016 0.39
Data sources: ND-GAIN (2017), Transparency International (2017), UN (2017), World Bank (2017b); Human
Development Index (HDI): 0 – 1, with 1 being highest; GINI Index 0 – 100, with 0 = equal income distribution;
Corruption perception index from Transparency International 0 - 100(0=highly corrupt to 100=clean); Vulnerability: 0 –
1, with 1 being highest, element of ND-GAIN index. Air pollution index: annual mean concentration of fine particulate
matterImplementation of Nationally Determined Contributions: Islamic Republic of Iran
of the global effort to combat climate change and that “the Iranian government is doing its best to
adhere to the climate principles” (DW, 2017). The most obvious effects of climate change in Iran are
water scarcity and the rise of average temperature by 1.8°C over pre-industrial levels, higher than the
global average increase (DW, 2017). The country faces declining rainfall, exhausted groundwater
reserves and evaporating lakes and rivers, which in combination with increased temperatures lead to
impacts on agriculture indirectly on migration (DW, 2017; HBS, 2017). According to the INDC,
agricultural production and the economy in general have faced damages amounting to 3.7 billion USD
(based on fixed prices) annually from 2015 to 2030 compared to 2010 (DoE, 2015).
Emissions. In the last 25 years (1990-2015), Iran’s GHGs emissions have more than tripled (European
Parliament, 2017). In 2014 they reached an all-time high, with data ranging between 734 MtCO2e
(excl. LULUCF) according to WRI and CAIT (2017) and 813 MtCO2e (excl. LULUCF) according to
PRIMAP data (Gütschow et al. 2016, see Table 2). Iran features as the 11th largest emitter of GHG in
recent rankings (WRI and CAIT, 2017), representing more than 1% of the world’s emissions. In 2014,
per capita GHGs emission per capita for Iran (10.4 MtCO2e), were comparable to those of Germany
(Table 4).
Iran’s emissions are dominated by the energy sector which accounts for 87% of overall GHG
emissions. Among the sub-sectors, energy supply (power generation and refineries) is the top
emitter, representing close to one third of emissions, followed by the two main energy demand
sectors: transportation and buildings (residential and commercial) (Figure 4). In terms of fuel type,
emissions from natural gas represent a little over half of emissions, whereas petroleum products are
responsible for most of the remainder (Ministry of Energy, 2014). Though difficult to quantify,
upstream emissions from gas flaring are an important component of energy-related emissions.
Although statistical data vary considerably due to lack of monitoring and differences in assumptions
on emissions factors, in recent years Iran has ranked as the third highest producer of emissions from
gas flaring (Soltanieh et al., 2016).
While emissions from LULUCF (land use, land-use change and forestry) have remained stable with a
minimal contribution to the total GHGs emissions, the share of non-energy related emissions from the
industry sector has grown steadily in the past two decades. There is however a considerable lack of
publicly available information on emissions shares and trends by sector.
The business as usual (BAU) scenario on which Iran's INDC is based foresees that the energy sector
will grow 4.7% each year until 2030, which would result in an increase of GHG emissions from
approximately 700 MtCO2e in 2010 to over 1,700 MtCO2e in 2030 (DoE and UNDP, 2014). Future
trends are described in more detail in section 2.4 below.
Energy system. Primary energy supply in Iran added up to 236 Mtoe in 2014. In the past decade,
energy consumption has grown by more than 50%, driven by the economic development,
demographic growth, urbanization and a highly subsidised energy market. Primary energy demand is
met mostly by natural gas (61%) and oil (37%), with marginal contributions of coal, hydroelectric,
nuclear power, and woody biomass.
Iran is an energy rich country, and a net energy exporter. The abundance of energy resources has often
led to their mismanagement and inefficient use (Moshiri and Lechtenböhmer, 2015). In order to curtail
wasteful energy use and limit domestic demand growth, Iran has pursued an energy subsidy reform in
the last two decades. Reforming the domestic energy market has been central in the agenda of the
country’s 5-year development plans of the country since 1995 (2nd, 3rd, and 4th Five-Year Development
Laws). The Law on Energy Consumption Pattern was passed in in 2010, and the second phase of
reform was implemented in 2014. The essence of recent reforms has been to gradually raise the prices
of domestic petroleum products, natural gas, and electricity, while promoting the participation of the
private sector, the creation of energy service companies, and the implementation of energy efficient
technologies. Energy subsidy reform is crucial from a climate change perspective, however it has been
17Implementation of Nationally Determined Contributions: Islamic Republic of Iran
slowed down by a range of factors. Among other things, reforms had an inflationary effect and
contributed to Iran’s growing budget deficit, and the amount of projected revenue from subsidy
savings has not always been realised. Subsidy reform is dealt with in further detail in section 2.6.1.
Over 84% of Iran’s power generation is produced from natural gas (THC, 2017). The extremely rapid
growth in electricity demand in the last decades has led to supply shortfalls during peak times. Still,
the annual electricity consumption per capita (~3000kWh/capita) is less than half of Germany’s
(~7000kWh/capita). The government plans to expand generation capacity to meet domestic demand
and increase its exports. Iran is a net exporter of electric power. It is worth mentioning that although
the electrification rate is in total above 99%, in 2014 still 1.5 million people in rural areas had no
access to modern energy (UNDESA, 2014).
International sanctions have stymied investments across Iran's energy sector, especially affecting
upstream oil and natural gas projects (EIA, 2017). Over 90% of Iran’s gas production is for domestic
consumption (Bloomberg, 2017).
Bilateral cooperation with Germany. For a long time there were no significant cooperation ties
between Germany and Iran, including with regards to energy or climate-related investments funded
by Germany. The nuclear agreement reanimated bilateral relations, and the German cooperation
agency (GIZ) and other organisations have since supported meetings between Iranian and German
experts to exchange knowledge and expertise on climate and energy policies, water resource
management, urban development and environmental protection (GIZ, 2017).
In February 2017, high-level talks were held between Germany’s State Secretary for the Environment
and Iran’s vice-president on Germany’s support to Iran to implement its national climate protection
targets (BMU, 2017a). At this occasion a Letter of Intent was signed with the aim of strengthening
collaboration on low-carbon economies (BMU, 2017a). Moreover, the German Federal Environment
Ministry aims to support Iran in its implementation of national climate action targets. It is expected
that this collaboration will be reinforced by the signing of the Memorandum of
Understanding between the European Union and Iran regarding cooperation on climate change
(Council of the European Union, 2017). This MoU, which sprang from the High-Level Conference on
Climate Action and Sustainable Energy held in April 2017 in Tehran, was approved by the EU Council
in October 2017, but is still pending signature. It foresees technical assistance with an emphasis on
climate resilience as well as adaptation. ,In 2016, the European Commission announced plans to
launch a High Level Energy Dialogue on non-nuclear energy with Iran, though details are still to
emerge.
A number of specific research collaborations are already underway. An example is the bilateral
workshop on “Sustainable Transformation of the Energy System in Iran” supported by Friedrich-
Ebert-Foundation, allowing an exchange between researchers (WI, 2017). In 2017 a joint project
between German and Iranian researchers set out to foster skills and capacities on renewable energy
technologies, and promote an envisaged Green Energy Center. The project is led by TU Berlin and
supported by the International Climate Initiative (IKI) with around 1.5 million EUR (BMU, 2017b).
18Implementation of Nationally Determined Contributions: Islamic Republic of Iran
Figure 6: Emissions profile of Iran
Data sources: Gütschow et al. (2016); UNFCCC (2016)
Table 2: Emissions data from PRIMAP (2014)
Sector MtCO2e Share in 2014
Total (excluding LULUCF) 813 100%
Total energy 704 87%
Industry 52 6%
Solvents 0 0%
Agriculture 37 5%
Waste 17 2%
Other 3 0%
Data sources: PRIMAP database (Gütschow et al., 2016)
Table 3: Emissions data from UNFCCC (2014)
Sector MtCO2e Year
Total (excl. LULUCF) 484 2000
LULUCF 9 2000
Data sources: UNFCCC (2016)
19Implementation of Nationally Determined Contributions: Islamic Republic of Iran
Figure 7: Iran emissions and energy use intensity, 1990 - 2014
Data sources: Gütschow et al. (2016); IEA (2016b); ND-GAIN (2017); World Bank (2017e)
Table 4: Key emissions, energy and environmental data (2014)
Indicator Iran % change World Germany Year
since 1990
GHG/cap [tCO2e/cap] 10.4 +89% 6.42 10.8 2014
(5.51)
GHG/GDP [tCO2e/mln 2017 USD] 1,911 -17,5% 592.6 225 2014
(2315.5)
Energy/GDP [ktoe/mln 2017 0.559 +0.5% 0.174 0.08 2014
USD] (0.555)
Global share of emissions [%] 1.0% +37.8% 100% 1.8% 2012
(0.74)
Air pollution index (PM2.5) 42 -13% (48.3) 38 14 2014
Vulnerability index [0 – 1] 0.36 -12.2% n.a. 0.23 2014
(0.41 in
1995)
Data sources: Gütschow et al. (2016); IEA (2016b); ND-GAIN (2017); World Bank (2017e)
20Implementation of Nationally Determined Contributions: Islamic Republic of Iran
Figure 8: Energy profile of Iran, 1990 to 2014
Data sources: IEA (2016a)
Table 5: Total primary energy supply by fuel in 2014
Fuel Primary energy Share in 2014
(ktoe)
Biomass and waste 517 0,22%
Solar, wind and other RE 30.8 0,01%
Geothermal 0 0%
Hydro 1,192 0,50%
Nuclear 1,165.4 0,49%
Gas 145,861 61,4%
Oil 87,929 37,0%
Coal 887 0,37%
Data sources: IEA (2016a)
21Implementation of Nationally Determined Contributions: Islamic Republic of Iran
2.2 Institutional set up
The main responsibilities regarding climate change mitigation and adaptation lie in the Department of
Environment. The department is not a ministry but a governmental agency under the supervision of
the president. The head of the department is also one of the twelve Vice-Presidents of Iran.
Within the Department of Environment, a National Climate Change Office (NCCO), also called
National Climate Change Working Group, was established in 1998. Its main responsibilities are the
preparation of National Communications (NCs), the enhancement of capacities for GHG inventorying
and MRV, the preparation of the national action plan for adaptation (NAPA), awareness raising and the
mainstreaming of climate change into planning. The NCCO comprises the deputies of the most relevant
ministries and is also responsible for the coordination of the Sub-committee for Climate Change under
the National Committee for Sustainable Development (Grantham Institute, 2017). The Committee is
organised into working groups, as well as two cross-cutting groups on mitigation and adaptation,
which ensures that the policies and projects are relevant across sectors and regions. The
organizational structure of the committee is presented in Figure 9, as shown in the NC2 (DoE and
UNDP, 2010). Possibly a revised structure chart will be included in the NC3, currently under
preparation. The department of Environment also supervises the National CDM Committee, composed
of nominated members from key ministries and organizations (Nachmany et al., 2015).
The bulk of Iran’s mitigation potential lies in its energy supply and demand sectors. As such, other
ministries and agencies play central roles in the country’s climate-relevant policy architecture:
- Supreme Energy Council, which oversees the energy sector, is chaired by the President and
comprises the Ministers of Petroleum, Ministry of Energy, Ministry of Economic Affairs and
Finance, Ministry of Industry, Mines and Trade, and Ministry of Agriculture, amongst others.
- Renewable Energy and Energy Efficiency Organization (SATBA), under the authority of Iran’s
Ministry of Energy. The Ministry of Energy is also responsible for water management.
- Operating under the auspices of the Ministry of Petroleum:
o Iran Fuel Conservation Organisation (IFCO), established in 2000 with the mission to
regiment fuel consumption in the energy chain from supply side to demand side through
review and survey of fuel consumption trends and executing conservation measures
nationwide. IFCO focuses on Article 12 of the Law on Elimination of Competitive
Production Barriers and Financial System Improvement by designing and implementing
performance-based energy efficiency programmes in different high-energy intensity
sectors. Currently programmes focus on central heating systems of buildings, gas space
heaters,, renewal of truck, bus, and taxi fleets, railway, as well as upstream oil, gas, and
petrochemicals.
o The National Iranian Oil Company (NIOC), owning a vast amount of oil and gas reserves, is
one of the world’s largest oil companies. Since 1951, NIOC has been directing and making
policies regarding exploration, drilling, production, research and development, refining,
distribution and export of oil, gas, and petroleum products.
- Other influential ministries include those of Roads and Urban Development, and Industry, Mines
and Trade.
Iran signed the United Nations Framework Convention on Climate Change (UNFCCC) in 1992 and
ratified the Convention in 1996. The National Rules of Procedure for Implementation of the
UNFCCC, last revised in 2012, mandate all relevant ministries to develop and implement programmes
leading to mitigation and adaptation of climate change.
22Implementation of Nationally Determined Contributions: Islamic Republic of Iran
The current sixth Five-year Development Plan (2017-2021) does not make any mention of climate
change. Nevertheless, in May 2017, Iran launched its National Strategic Plan on Climate Change (UNDP
Iran, 2017). More details about it are given in section 2.5.1 below.
In the realm of adaptation, a Vulnerability and Adaptation (V&A) Assessment was conducted by the
National Climate Change office in 2014 and incorporated into the draft NC3. The NC2 put forward a
number of resource management strategies to tackle climate vulnerabilities, including the
vulnerability of Iran’s economy to response measures taken by Annex I countries to reduce their oil
and gas demand. The Iranian government has as yet not prepared a National Adaptation Plan.
The adverse effects of climate change have become increasingly evident in Iran over the past decade,
and the Iranian government acknowledges this in its INDC. Expert interviews reveal that climate
change adaptation measures are often seen as a priority over mitigation. Issues of particular concern
are altered dust and sand storm as well as drought patterns in the semi-arid regions (Keramat et al.,
2011; Khanjani, 2016; Modarres et al., 2016). Ministry officials are increasingly seeking advice on the
links and synergies between climate change and food, water and energy security (also known as the
‘Food-Water-Energy Nexus’).
The institutional set up of Iranian climate policy is constrained by the limitations in multi-lateral
cooperation. A number of international support commitments that were under discussion after the
nuclear deal was struck were put on hold in 2017 following statements of the president of the United
States regarding plans to "decertify" the deal and of the president of France requesting negotiations
with Iran regarding ballistic missiles (see section 2.7). Much of the country’s policy steps to date have
been supported by UNDP, with finance from the Global Environment Facility. Experts consulted have
pointed out that UNDP and GEF will not support Iranian climate policy initiatives as of 2018.
Figure 9: National Climate Change Office Management Chart
Source: DoE and UNDP (2010)
23Implementation of Nationally Determined Contributions: Islamic Republic of Iran
2.3 MRV of GHG emissions
Iran submitted its first National Communication to the UNFCCC in 2003, providing GHG inventory data
for the year 1994. The Second National Communication (NC2) was submitted in 2011, with a more
detailed inventory presenting calculated emission data for the year 2000 and projected data for 2010-
25.
A Third National Communication is in the making and drafts are partly available online (DoE and
UNDP, 2014), offering inventory data for the year 2010 and projections until 2030. The draft Third
National Communication (NC3) provides more detail on the emissions of each sector than the previous
communications. No Biennial Update Reports (BUR) have been delivered yet. All three national
communications have been prepared by the National Climate Change Office (NCCO, see above), with
the support of GEF and UNDP.
In both submitted communications, difficulties of gathering activity data were stressed. Iran’s national
MRV system is being developed. The INDC suggests that it will be operational by 2020 (DoE, 2015).
The NCCO is responsible for the coordination of data collection for the national GHG inventory, and
ultimately for reporting to the UNFCCC. There are however no details on how current efforts are
organised nor on the plans for implementing the MRV system by 2020. It is unclear whether any
international donor agency has shown an intention to provide technical assistance or support capacity
building in this realm. Personal communications with Iranian experts revealed that the process will
resume once the Paris Agreement is ratified and the NDC approved.
The emissions inventory in the draft NC3, uses the latest (2006) IPCC guidelines and provides an
example of the template that was sent to governmental agencies to report on activity levels. Due to a
lack of national or local robust data, a Tier 1 approach was applied. National emission factors are
however available for specific subsectors, such as the energy sector (IPCC Sector 1A, Fuel combustion
activities) and the cement industry within industrial sector (IPCC Sector 2, Industrial Production and
Product Use (IPPU) (DoE and UNDP, 2014).
2.4 Description and evaluation of the INDC
Iran’s Intended Nationally Determined Contribution (INDC) was published in November 2015, shortly
before COP21. The INDC contains an unconditional reduction pledge of 4% versus a business-as-
usual (BAU) scenario in 2030, and a pledge of 12% reduction versus BAU scenario subject to the
presence of international financial and technical support (DoE, 2015). It is important to note that
both the unconditional and conditional pledges are subject to the removal of current sanctions and
absence of sanctions in the future. The cost of implementation is expected to be around 70 billion USD,
split into 17.5 billion USD for the unconditional reduction and an additional 52.5 billion USD for the
additional 8%. No NDC has yet been published.
The INDC document itself does not present quantitative values for the BAU or mitigation scenarios and
it makes no specific reference to the sources of emission reductions. It however states that
international sanctions have prevented Iran from reaching previous targets for reductions (30%
energy intensity reduction in the last Five-year Development Plan 2011-2015). It also states that its
energy intensity actually increased as a result of the sanctions, which is in line with the data presented
in Figure 7. The INDC moreover highlights the need for phasing out of energy subsidies in order to
achieve the unconditional and conditional commitments. However, costs for such a measure are not
presented.
Due to the lack of detail of Iran’s INDC, no in-depth assessments of the pledges have been published to
date. The underlying assumptions for the BAU and mitigation scenario in the INDC are however laid
out in the energy sector chapter of the draft of Iran’s Third National Communication (DoE and UNDP,
2014), which is described in more detail below. It is important to note that, although parts of this
24Implementation of Nationally Determined Contributions: Islamic Republic of Iran
national communication are publically available, this document has not been submitted to the
UNFCCC, nor endorsed by the government as its official position.
An analysis by the European Parliament (2017) considers that Iran’s INDC pledges are relatively
modest compared to the projected increase in emissions. Personal communications with Iranian
climate policy experts suggest that there is a general consensus that both the unconditional and
conditional commitments could be achieved relatively easily, including with measures against gas
flaring and efficiency. For comparison, in their scenario analysis of Iran’s future energy system,
Moshiri and Lechtenboehmer (2015) find that the viable reduction potential of Iran’s emissions could
be around 40% versus BAU (with energy efficiency measures only), or up to 50% if combined with
renewable energies. It is moreover important to stress that the baseline and mitigation scenarios in
the INDC assume a very strong GDP growth of 8% per annum (in line with the current sixth Five-Year
Development Plan). Under current conditions, even if the uncertainty around sanctions were to
dissipate, this target can be considered ambitious, with IMF and World Bank forecasts pointing at a 4%
growth in the near term (see Economy under section 2.1). In other words, emission growth projections
may be overestimated.
Finally, the INDC document highlights the need for significant investments into adaptation - about 100
billion USD in total - and emphasises measures related to the water sector: infrastructure, demand
management, increased efficiency, and new water resources.
BAU and mitigation scenarios in Second National Communication, Draft Third National
Communication and INDC
The figures of projected GHG scenarios presented in the latest officially submitted NC2 (DoE and
UNDP, 2010) are quite different from the ones given in the draft NC3 (DoE and UNDP, 2014). In the
NC2, the projected BAU emissions for 2025 are considerably higher, with 2,250 Mt CO2e. The
mitigation potential in the “All Policies” mitigation scenario is of 64%, bringing emissions down to 700
MtCO2e by 2025. On the other hand, the NC3’s projections are more moderate, with around 1,400
MtCO2e and 1,700 MtCO2e by 2025 and 2030 respectively, and a significantly lower reduction potential
of 4-12% versus BAU (Figure 10).
The BAU scenario in the draft NC3 envisages an average annual emissions growth rate of 4.7%, for the
energy sector as a whole, with the highest growth rate of 5.9% per annum in the transport sector. As a
result, emissions more than double by 2030 (from approximately 700 MtCO2e in 2010 to over 1,700
MtCO2e in 2030). The mitigation scenario of the NC3, on the other hand, presents an overall reduction
of 210 MtCO2e by 2030, corresponding to the conditional 12% reduction target. The pathway to
achieving the 2030 vision is almost linear, with a slightly slower rate of reductions in the 2010-2015
period. Reductions arise mainly from four subsectors: industry, natural gas supply chain (gas
treatment facilities and transport and distribution work), electricity generation and transport, with
shares of 2.85%, 2.71%, 2.26% and 2.24%, respectively. When summed together, the reductions from
gas flaring and gas supply chain management constitute 70 MtCO2e, which is equivalent to 4% of 2030
emissions. Expert interviews suggest that, while not stated explicitly in the INDC, these two measures
constitute the unconditional mitigation pledge. Reducing gas flaring therefore seems to be perceived
as a low-hanging fruit with considerable co-benefits and margin for additional reductions.
There are a number of discrepancies between the draft NC3 mitigation scenario and the INDC. The
former assumes a 2015 start in reductions, while the INDC assumes a 2021 start. Moreover the
investment costs that the draft NC3 suggests (12 to 38 billion USD) are different from those
stated in the INDC document (70 billion USD). Communications with experts suggest that this may
be partly due to differences in methodology (Net Present Value vs. total investment cost). The draft
NC3 does not provide a whole-economy mitigation scenario across energy and non-energy sectors.
The NC2 does present such an integrated perspective, which shows that the energy sector plays an
25You can also read