Atmospheric Impact Report for a Proposed Polyethylene Terephthalate Plant in the Coega Special Economic Zone, Port Elizabeth, South Africa - ALO ...
←
→
Page content transcription
If your browser does not render page correctly, please read the page content below
Atmospheric Impact Report for a
Proposed Polyethylene
Terephthalate Plant in the Coega
Special Economic Zone, Port
Elizabeth, South Africa

Report Prepared for

ALO Polymers (Pty) Ltd.

Report Number 561164/AIR

Report Prepared by

June 2021
SRK Consulting: 561164: Atmospheric Impact Report for ALO Polymers                                  i

            Atmospheric Impact Report for a Proposed
            Polyethylene Terephthalate Plant in the Coega
            Special Economic Zone, Port Elizabeth, South
            Africa

            ALO Polymers (Pty) Ltd.
            SRK Consulting (South Africa) (Pty) Ltd.
            Section A Second Floor, Suite 02/B1
            Norfolk House
            54 Norfolk Terrace, off Blair Atholl Drive
            Westville 3630
            South Africa

            e-mail: Durban@srk.co.za
            website: www.srk.co.za

            Tel: +27 (0) 31 279 1200
            Fax:+27 (0) 31 279 1204

            SRK Project Number 561164

            June 2021

             Compiled by:                                                Reviewed by:

             H. Tularam (Pr. Sci. Nat)                                   M. van Huyssteen
             Senior Scientist                                            Partner

             Email: HTularam@srk.co.za
             Authors:
             H. Tularam; N. Govender; P. Burmeister

TULH/VHUY                                  561164-ALO_Polymers_AIR_Final amended_20210625   June 2021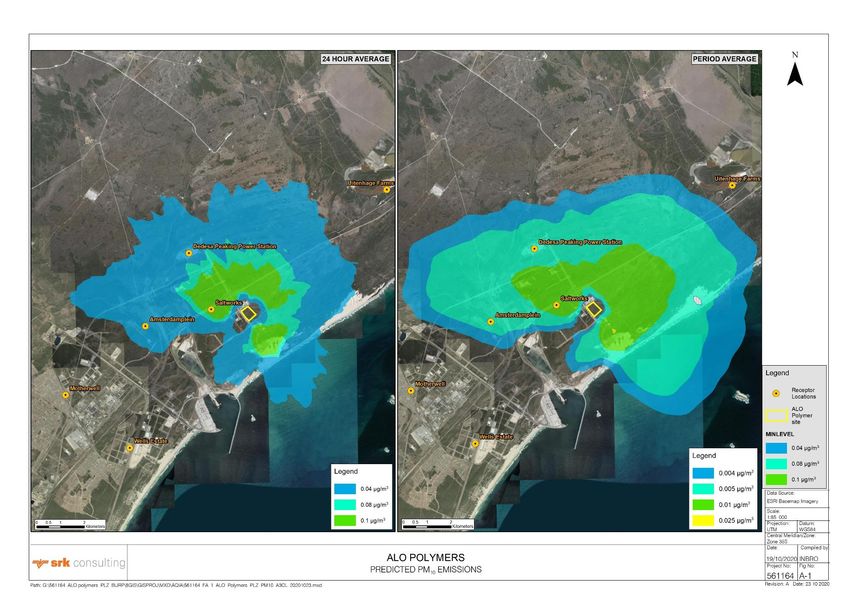
SRK Consulting: 561164: Atmospheric Impact Report for ALO Polymers                                                 ii

            Executive Summary
            SRK Consulting (South Africa) Pty (Ltd). (SRK) was appointed by ALO Polymers (Pty) Ltd. (ALO
            Polymers) to undertake an Environmental Impact Assessment (EIA) for the development of a
            polyethylene terephthalate (PET) production plant within the Coega Special Economic Zone (SEZ) in
            the Nelson Mandela Bay Metropolitan Municipality. As part of the EIA process, a specialist
            Atmospheric Impact Report (AIR) is required in terms of Section 45 of the National Environmental
            Management: Air Quality Act (NEM:AQA), as well as an Atmospheric Emission Licence (AEL), should
            the project be granted environmental authorisation. An emissions inventory was compiled using
            technical plant process specifications provided by the plant engineers (Chemtex). A Level 3
            (CALPUFF) atmospheric dispersion model was used to assess the potential impacts of the proposed
            plant. Further to the specialist AIR, a Greenhouse Gas (GHG) emission inventory was compiled for
            ALO Polymers. Key findings are as follows:

            •   The sulphur dioxide(SO2), nitrogen dioxide (NO2) and particulate matter (PM) with diameters less
                are 10 micrometers (PM10) concentrations can be seen to disperse in an easterly and north-
                easterly as well as a westerly and north westerly direction away from ALO Polymers operations
                as per the prevailing wind directions. Air pollutant concentrations decrease with increasing
                distance from the site, to levels that are low to negligible.
            •   All predicted period and 99th percentile (P99) average concentrations from the proposed ALO
                Polymers operations for SO2, PM10 and NO2 demonstrate full compliance with the respective
                average National Ambient Air Quality Standards (NAAQS) at all receptors.
            •   Volatile Organic Compound (VOC) emissions from the storage tanks are to remain negligible and
                below the ambient NAAQS for benzene.
            •   Percentage contribution to existing SO2 concentrations measured at the Saltworks monitoring
                station is predicted to remain less than 10% for each averaging period. The percentage
                contribution to existing NO2 and PM10 concentrations measured at the Saltworks monitoring station
                is to remain less than 1% for each averaging period. This suggests that proposed operations at
                ALO Polymers are to have a negligible contribution to the existing long-term average SO2, PM10
                and NO2 concentrations at this point.
            •   The total GHG emissions are 21 766.8 t CO2e, with the manufacturing process of PET being the
                highest contributor (85.9%).
            •   Comparison to the national GHG inventory showed that stationary combustion as well as the use
                of oil and lubricants were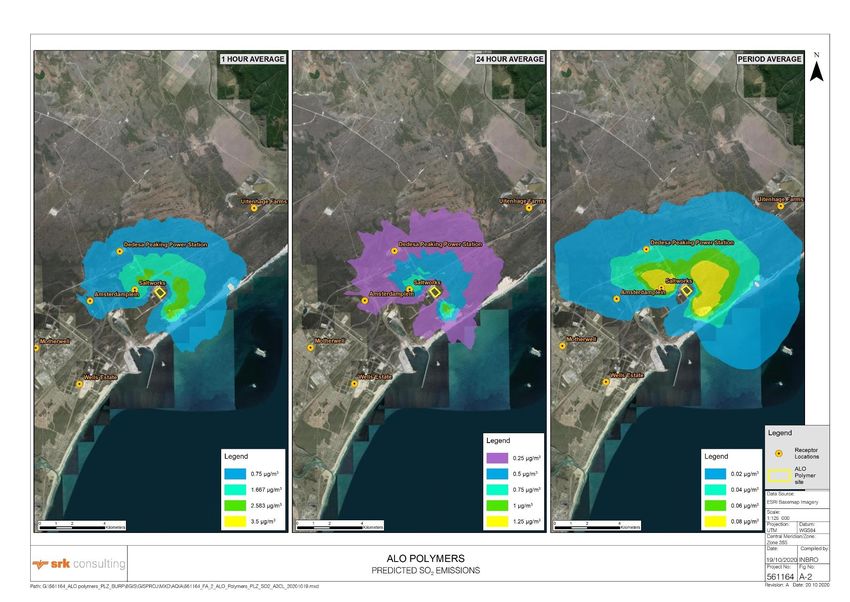
SRK Consulting: 561164: Atmospheric Impact Report for ALO Polymers                                                                                                 iii

Table of Contents
    Executive Summary ..................................................................................................................................... ii
    Table of Contents ........................................................................................................................................ iii
    List of Abbreviations ................................................................................................................................... vii
    Disclaimer.................................................................................................................................................. viii
1 Introduction .................................................................................................................. 1
    1.1     Background and approach .................................................................................................................. 1
    1.2     Scope of report.................................................................................................................................... 1
2 Project identification requirements ............................................................................ 2
    2.1     Enterprise details ................................................................................................................................ 2
    2.2     Project location.................................................................................................................................... 2
    2.3     Atmospheric emission licence............................................................................................................. 5
3 Process description ..................................................................................................... 5
    3.1     The CP processes............................................................................................................................... 7
            3.1.1      Paste formation and esterification ........................................................................................... 7
            3.1.2      Polymerisation ......................................................................................................................... 7
            3.1.3      Polymer transfer line and chip making .................................................................................... 8
            3.1.4      Additives .................................................................................................................................. 8
    3.2     The SSP Process ................................................................................................................................ 9
            3.2.1      Intermediate conveying ........................................................................................................... 9
            3.2.2      Crystallizer ............................................................................................................................... 9
            3.2.3      Pre-heater ............................................................................................................................... 9
            3.2.4      Solid state reactor ................................................................................................................... 9
            3.2.5      Product cooling...................................................................................................................... 10
    3.3     Air emissions ..................................................................................................................................... 10
            3.3.1      OSC and HTM heater stack .................................................................................................. 10
            3.3.2      Boiler stack ............................................................................................................................ 11
            3.3.3      Storage tanks ........................................................................................................................ 11
4 Technical information ................................................................................................ 12
    4.1     Unit processes .................................................................................................................................. 12
    4.2     Hours of operation............................................................................................................................. 12
    4.3     Raw materials used........................................................................................................................... 12
    4.4     Production rates ................................................................................................................................ 12
    4.5     Abatement equipment and appliances ............................................................................................. 13
5 Legislative framework ................................................................................................ 13
    5.1     Minimum emission standards ........................................................................................................... 13
    5.2     National ambient air quality standards .............................................................................................. 16
            5.2.1      Volatile organic compounds .................................................................................................. 16
            5.2.2      Particulate matter .................................................................................................................. 16
            5.2.3      Sulphur dioxide...................................................................................................................... 17

TULH/VHUY                                              561164-ALO_Polymers_AIR_Final amended_20210625                                                      June 2021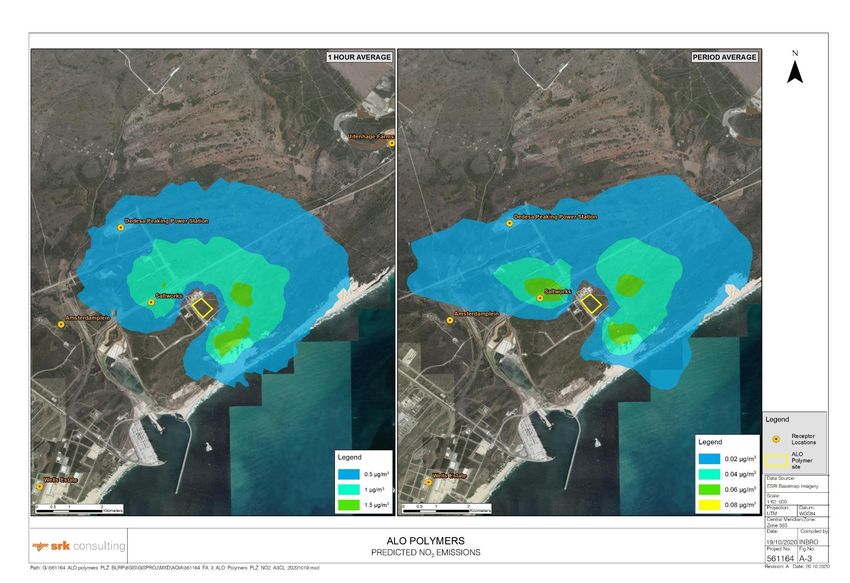
SRK Consulting: 561164: Atmospheric Impact Report for ALO Polymers                                                                                             iv

            5.2.4      Nitrogen dioxide .................................................................................................................... 17
6 Baseline assessment ................................................................................................. 18
    6.1     Meteorological conditions ................................................................................................................. 18
            6.1.1      Macro scale climate............................................................................................................... 18
            6.1.2      Micro scale climate ................................................................................................................ 20
    6.2     Ambient air quality monitoring........................................................................................................... 29
            6.2.1      PM10 concentrations .............................................................................................................. 30
            6.2.2      PM2.5 concentrations .............................................................................................................. 33
            6.2.3      SO2 concentrations ................................................................................................................ 35
            6.2.4      NO2 concentrations................................................................................................................ 37
7 GHG assessment ........................................................................................................ 39
8 Dispersion modelling methodology.......................................................................... 44
    8.2     Dispersion model used ..................................................................................................................... 44
    8.3     Meteorological data ........................................................................................................................... 45
    8.5     Specified sensitive receptors ............................................................................................................ 45
    8.7     Emissions inventory .......................................................................................................................... 48
    8.8     Model output ..................................................................................................................................... 48
    8.9     Assumptions and limitations ............................................................................................................. 48
9 Dispersion modelling results .................................................................................... 49
    9.1     PM10 concentrations .......................................................................................................................... 49
    9.2     SO2 concentrations............................................................................................................................ 50
    9.3     NO2 concentrations ........................................................................................................................... 50
10 Modelled contributions in relation to ambient concentrations .............................. 51
11 Analysis of impact on the environment .................................................................... 52
12 Conclusions ................................................................................................................ 54
13 Recommendations ..................................................................................................... 54
14 Formal declarations ................................................................................................... 56
15 References .................................................................................................................. 62
Appendices ...................................................................................................................... 64
Appendix A: Plume Isopleths ....................................................................................... 65

TULH/VHUY                                            561164-ALO_Polymers_AIR_Final amended_20210625                                                    June 2021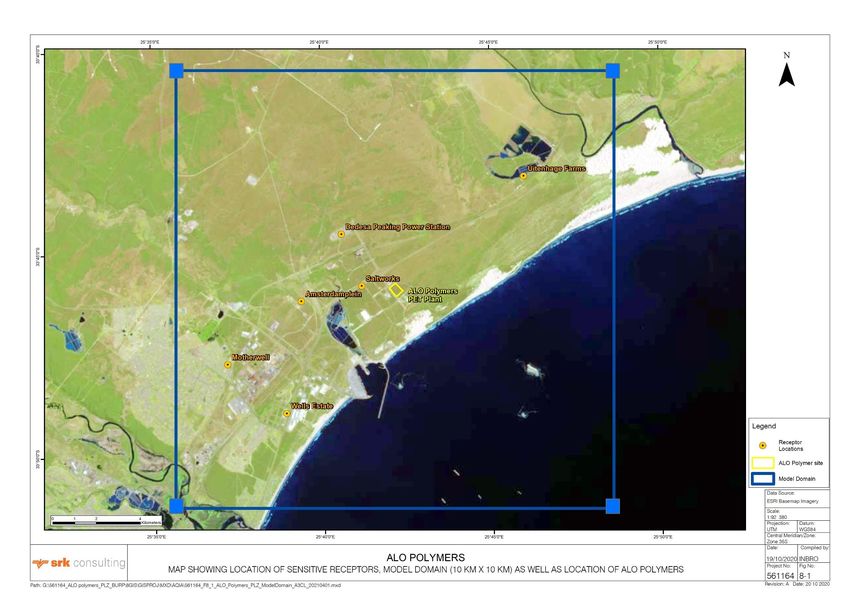
SRK Consulting: 561164: Atmospheric Impact Report for ALO Polymers                                                                                            v

List of Tables
Table 2-1: Applicant details ................................................................................................................................ 2
Table 2-2: Details of responsible person ............................................................................................................ 2
Table 2-3: Location and extent of ALO Polymers ............................................................................................... 3
Table 3-1: Materials Storage Capacity ............................................................................................................. 11
Table 4-1: List of unit processes and functions ................................................................................................ 12
Table 4-2: List of unit processes and functions ................................................................................................ 12
Table 4-3: Raw materials used ......................................................................................................................... 12
Table 4-4: Production Rate ............................................................................................................................... 13
Table 4-5: Abatement methods ........................................................................................................................ 13
Table 5-1: Associated Minimum Emission Standards for Subcategory 6 (Organic chemical manufacturing) . 14
Table 5-2: Storage vessels for liquids .............................................................................................................. 14
Table 5-3: Storage vessel vapour recovery / destruction units. ....................................................................... 15
Table 5-4: Ambient Air Quality Standard for Benzene ..................................................................................... 16
Table 5-5: Air quality standards for PM10.......................................................................................................... 17
Table 5-6: Air quality standards for PM2.5 ......................................................................................................... 17
Table 5-7: Ambient air quality standards for SO2 ............................................................................................. 17
Table 5-8: Ambient air quality standards for NO2 ............................................................................................. 17
Table 6-1: Description of surroundings and locations of the Amsterdamplein, Motherwell and Saltworks
            monitoring stations ..................................................................................................................... 21
Table 6-2: Meteorological data recoveries for the period January 2017 to December 2019 ........................... 23
Table 6-3: Monthly rainfall data from the Saltworks weather station for the period January 2017 to December
             2019 ........................................................................................................................................... 23
Table 6-4: Average monthly temperatures from the Saltworks weather station for the period January 2016 to
             August 2020 ............................................................................................................................... 25
Table 6-5: Data recovery for the air quality monitoring stations for the period January 2017 to December 2019
              30
Table 6-6: PM10 monitoring results and compliance summary for the Saltworks, Amsterdamplein and
            Motherwell monitoring stations for the period January 2017 to December 2020 ...................... 31
Table 6-7: PM2.5 monitoring results and compliance summary for the Saltworks monitoring station for the period
             January 2017 to December 2019............................................................................................... 33
Table 6-8: SO2 monitoring results and compliance summary for the Saltworks, Amsterdamplein and Motherwell
             monitoring stations for the period January 2017 to December 2019 ......................................... 35
Table 6-9: NO2 monitoring results and compliance summary for the Saltworks, Amsterdamplein and Motherwell
             monitoring stations for the period January 2017 to December 2019 ......................................... 37
Table 7-1: GHG sources as identified from Annexure 1 of the NGERs ........................................................... 40
Table 7-2: Activity data for ALO Polymers........................................................................................................ 41
Table 7-3: Emission Factors ............................................................................................................................. 41
Table 7-4: PET process mass balance data .................................................................................................... 42
Table 7-5: Cumulative Scope 1 annual emissions per zone ............................................................................ 42
Table 7-6: GHG emission comparison ............................................................................................................. 44
Table 8-1: Sensitive receptors included in the model....................................................................................... 45
Table 8-2: Stack emission source parameters ................................................................................................. 48

TULH/VHUY                                              561164-ALO_Polymers_AIR_Final amended_20210625                                                 June 2021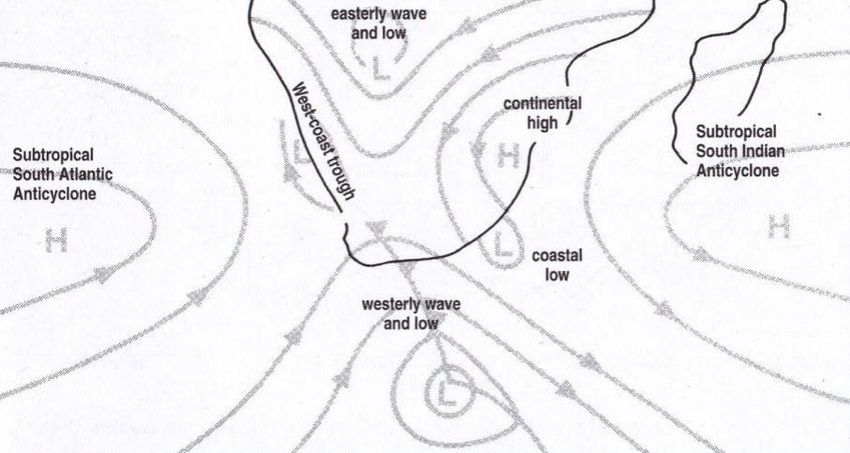
SRK Consulting: 561164: Atmospheric Impact Report for ALO Polymers vi
Table 8-3: Stack emission rates ....................................................................................................................... 48
Table 9-1: Modelled PM10 concentrations from ALO Polymers ........................................................................ 50
Table 9-2: Modelled SO2 concentrations from ALO Polymers ......................................................................... 50
Table 9-3: Modelled NO2 concentrations (µg/m³) from ALO Polymers ............................................................ 51
Table 10-1: Percentage contribution of SO2 concentrations ............................................................................ 51
Table 10-2: Percentage contribution of annual NO2 concentration .................................................................. 52
Table 10-3: Percentage contribution of annual PM10 concentration................................................................. 52
Table 11-1: Significance rating of Air Quality impact and recommended mitigation measures ....................... 52
Table 11-2: Significance rating of for impacts associated with GHG emissions and recommended mitigation
measures ................................................................................................................................... 53
List of Figures
Figure 2-1: Locality map ..................................................................................................................................... 4
Figure 3-1: PET plant production process .......................................................................................................... 6
Figure 3-2: Model images of the UFPP and Finisher vessels (source: ALO Polymers) .................................... 8
Figure 3-3: Schematic of ALO’s OSC and HTM heater (source: ALO Polymers) ............................................ 10
Figure 6-1: Annual variations in the positions of the South Atlantic and South Indian anticyclones (Source:
Preston-Whyte et al., 2000) ....................................................................................................... 18
Figure 6-2: Important features of the major pressure cells over southern Africa (Source: Preston-Whyte et al.,
2000) .......................................................................................................................................... 19
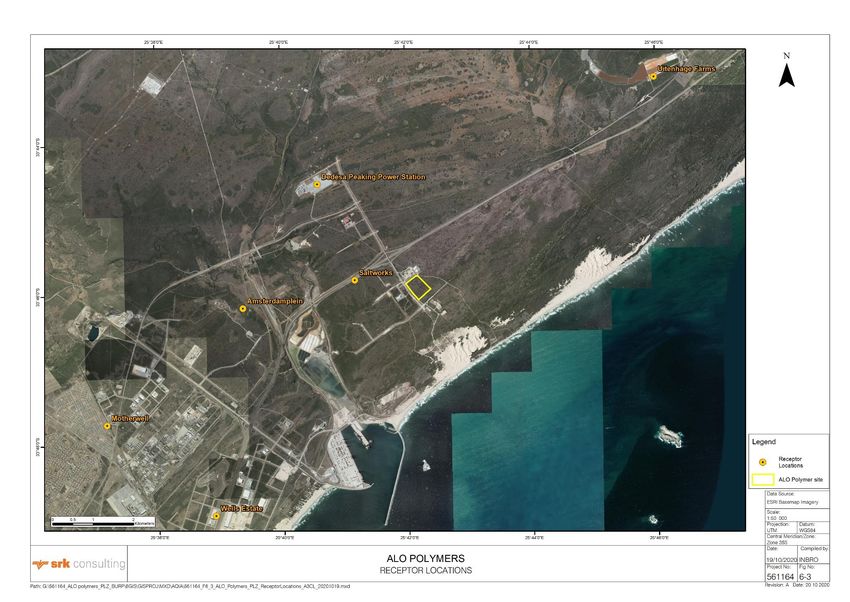
Figure 6-3: Receptor locations ......................................................................................................................... 22
Figure 6-4: Rainfall data from the Saltworks monitoring station for the period January 2017 to December 2019
24
Figure 6-5: Average temperature and average relative humidity data from the Saltworks monitoring station for
the period January 2017 to December 2019 ............................................................................. 25
Figure 6-6: All hours, day time and night time wind roses for the plant area for the period January 2017 to
December 2019.......................................................................................................................... 27
Figure 6-7: Seasonal wind roses for the plant area for the period January 2017 to December 2019 ............. 28
Figure 6-8: Wind frequency distribution data for the project area for the period January 2017 to December
2019 ........................................................................................................................................... 29
Figure 6-9: Daily and annually averaged PM10 concentrations from the Saltworks and Motherwell monitoring
stations for the period January 2017 December 2019 ............................................................... 32
Figure 6-10: Daily and annually averaged PM2.5 concentrations from the Saltworks monitoring station for the
period January 2017 to December 2019.................................................................................... 34
Figure 6-11: Hourly measured, daily averaged and annually averaged SO2 concentrations from the Saltworks,
Amsterdamplein and Motherwell monitoring stations for the period January 2017 to December
2019 ........................................................................................................................................... 36
Figure 6-12: Hourly measured and annually averaged NO2 concentrations from the Saltworks, Amsterdamplein
and Motherwell monitoring stations for the period January 2017 to December 2019 ............... 38
Figure 7-1: ALO GHG emission (CO2e) ........................................................................................................... 43
Figure 8-1: Map showing location of sensitive receptors, model domain (10 km x 10 km) as well as location of
ALO Polymers ............................................................................................................................ 47
TULH/VHUY 561164-ALO_Polymers_AIR_Final amended_20210625 June 2021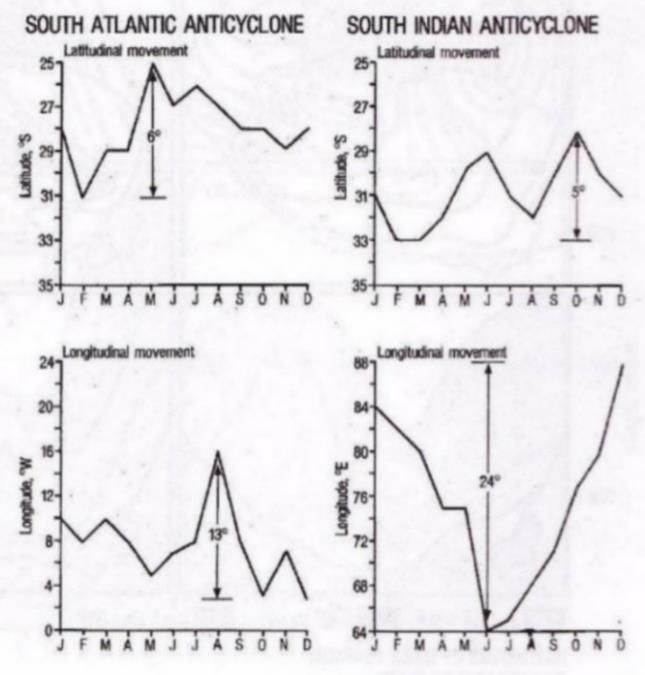
SRK Consulting: 561164: Atmospheric Impact Report for ALO Polymers                                             vii

            List of Abbreviations

             AEL                         Air Emissions License
             AIR                         Atmospheric Impact Report
             ATO                         Antimony Tin Oxide
             CP                          Continuous Polymerisation
             DEA                         Department of Environmental Affairs (National) (now DEFF)
             DEFF                        Department of Environment, Forestry and Fisheries (National)
                                         (formerly DEA)
             DEG                         Diethylene Glycol
             EAP                         Environmental Assessment Practitioner
             EG                          Ethylene Glycol
             EIA                         Environmental Impact Assessment
             GIS                         Geographic Information Systems
             GN                          Government Notice
             HP                          High Pressure
             HTM                         Heat Transfer Medium
             HTF                         Heat Transfer Fluid
             SEZ                         Special Economic Zone
             LFO                         Light Fuel Oil
             MEG                         Monoethylene Glycol
             MES                         Minimum Emissions Standards
             NAAQS                       National Ambient Air Quality Standards
             NEM:AQA                     National Environmental Management: Air Quality Act
             OSC                         Organic Stripping Column
             PET                         Polyethylene terephthalate
             PIA                         Pure Isophthalic Acid
             PM                          Particulate Matter
             PM10                        Particulates with an aerodynamic diameter of less than 10 µm
             PM2.5                       Particulates with an aerodynamic diameter of less than 2.5 µm
             PTA                         Pure Terephthalic Acid
             SANAS                       South African National Accreditation System
             SAAQIS                      South African Air Quality Information System
             SSP                         Solid State Polymerisation
             TOV                         Torsional Oscillatory Viscometer
             TPD                         Tons per day
             UFPP                        Up-Flow Pre-Polymerisation
             VOC                         Volatile Organic Compound
             WRF                         Weather research and forecasting
             WWTP                        Wastewater Treatment Plant

TULH/VHUY                                  561164-ALO_Polymers_AIR_Final amended_20210625                June 2021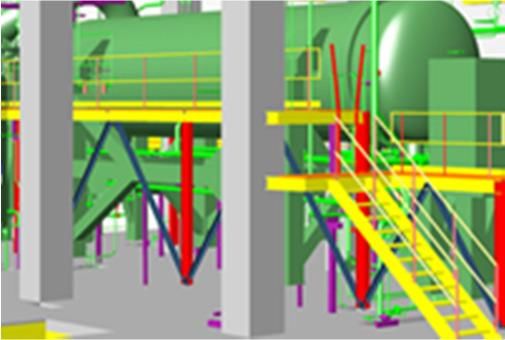
SRK Consulting: 561164: Atmospheric Impact Report for ALO Polymers                                              viii

            Disclaimer
            The opinions expressed in this Report have been based on the information supplied to SRK Consulting
            (South Africa) (Pty) Ltd. (SRK) by ALO Polymers (Pty) Ltd. (ALO Polymers). The opinions in this Report
            are provided in response to a specific request from ALO Polymers to do so. SRK has exercised all
            due care in reviewing the supplied information. Whilst SRK has compared key supplied data with
            expected values, the accuracy of the results and conclusions from the review are entirely reliant on
            the accuracy and completeness of the supplied data. SRK does not accept responsibility for any errors
            or omissions in the supplied information and does not accept any consequential liability arising from
            commercial decisions or actions resulting from them. Opinions presented in this report apply to the
            site conditions and features as they existed at the time of SRK’s investigations, and those reasonably
            foreseeable. These opinions do not necessarily apply to conditions and features that may arise after
            the date of this Report, about which SRK had no prior knowledge nor had the opportunity to evaluate.

TULH/VHUY                                  561164-ALO_Polymers_AIR_Final amended_20210625                  June 2021
SRK Consulting: 561164: Atmospheric Impact Report for ALO Polymers                                             Page 1

1           Introduction
1.1         Background and approach
            SRK Consulting (South Africa) Pty (Ltd). (SRK) was appointed by ALO Polymers (Pty) Ltd (ALO
            Polymers) to undertake an Environmental Impact Assessment (EIA) and associated environmental
            authorisations for the development of a polyethylene terephthalate (PET) production plant within the
            Coega Special Economic Zone (SEZ) in the Nelson Mandela Bay Metropolitan Municipality. As part of
            the EIA process, a specialist Atmospheric Impact Report (AIR) is required in terms of Section 45 of
            the National Environmental Management: Air Quality Act (No. 39 of 2004) (NEM:AQA) (this report) as
            well as an Atmospheric Emission Licence (AEL), should the project be granted environmental
            authorisation.

            This report provides a baseline description of the air quality and meteorological conditions for the study
            area and assesses any potential impacts that the proposed facility may have on the ambient air quality
            in the surrounding airshed. The assessment accounts for all key ambient air pollution releases
            associated with the proposed facility i.e. Sulphur Dioxide (SO2), Particulate Matter (PM10), Nitrogen
            Dioxide (NO2), and Total Volatile Organic Compounds (TVOCs). To assess the cumulative impact of
            the proposed operations, existing air quality monitoring data was sourced from the Amsterdamplein,
            Motherwell and Saltworks monitoring stations that is maintained by the Coega Development
            Corporation (CDC) and located within the study domain.

            An air pollutant emissions inventory was compiled using technical plant process specifications
            provided by the plant engineers (Chemtex). A Level 3 (CALPUFF) atmospheric dispersion model was
            used to assess the potential impacts that the proposed plant may have on air quality in the Coega
            Special Economic Zone (SEZ) airshed. Predicted long-term (period) and short-term 99th percentile
            average concentrations are compared with the relevant National Ambient Air Quality Standards
            (NAAQS), as published in Government Notice 1210 of 2009 (Government Gazette 32816) and 2013
            (Government Notice 893, Government Gazette 37054).

            In addition to the AIR component of this study, a greenhouse gas (GHG) emission inventory has also
            been prepared for ALO Polymers. GHG emissions were estimated through the use of emission factors
            for stationary combustion, use of oil and lubricants, as well as the use of electrical equipment. In
            addition, carbon emissions from the PET process were estimated by a chemical mass balance
            calculation based on the inputs and related outputs.

            Findings from this study have been presented in the format prescribed by the AIR Regulations
            described further below.

1.2         Scope of report
            In terms of Section 53(f) of NEM:AQA, the Department of Environmental Affairs (DEA) now referred
            to as Department of Environment, Forestry and Fisheries (DEFF), developed and published
            "Regulations Regarding Air Dispersion Modelling, 2014" herein referred to as the “Modelling
            Regulations’”. The regulations were published in Government Gazette No. 37804 on 11 July 2014
            under Government Notice (GN) No. R533.

            The Modelling Regulations, contained in Appendix A of the GN R533 Regulations are prescribed as
            the technical Code of Practice for air dispersion modelling, and provide technical standards on the
            application of air dispersion models.

TULH/VHUY                                  561164-ALO_Polymers_AIR_Final amended_20210625                      June 2021
SRK Consulting: 561164: Atmospheric Impact Report for ALO Polymers Page 2
The Code of Practice is applicable to:
a) The development of an Air Quality Management Plan, as contemplated in Chapter 3 of the
NEM: AQA.
b) The development of a Priority Area Air Quality Management Plan, as contemplated in Section 19
of the NEM:AQA.
c) The development of an Atmospheric Impact Report (AIR), as contemplated in Section 30 of the
NEM:AQA.
d) The development of a specialist Air Quality Impact Assessment (AQIA) study, as contemplated in
Section 37(2)(b) of the NEM:AQA.
The scope of this assessment and report follows the prescribed format of an Air Dispersion Modelling
Study Report or AIR, and provides all the relevant, available information in order to comply with the
requirements of the regulations regarding air dispersion modelling (Code of Practice).
2 Project identification requirements
2.1 Enterprise details
The details for ALO Polymers are presented in Table 2-1 with Table 2-2 presenting the details of the
relevant contact person.
Table 2-1: Applicant details
Criteria Details
Enterprise Name ALO Polymers (Pty) Ltd
Trading As ALO Polymers
Type of Enterprise, e.g. Company/Close
Company
Corporation/Trust
Registered Address 8 Montecello Estate, Tamboti Road,Midrand 1685
Postal Address 8 Montecello Estate, Tamboti Road,Midrand 1685
Telephone Number (General) 082 043 9690
Fax Number (General) N/A
Industry Type/Nature of Trade Manufacturing
Table 2-2: Details of responsible person
Criteria Details
Responsible Person Mr. Luzuko Mbidlana
Telephone Number 082 043 9690
E-mail Address luzuko@alopolymers.com
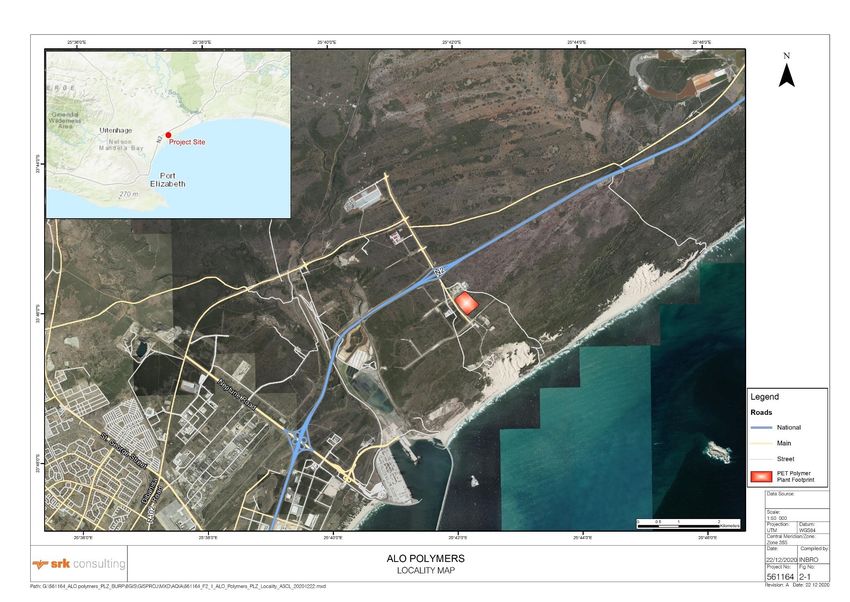
2.2 Project location
The proposed project is located in zone 7 (Chemicals Cluster) of the Coega SEZ, in the Nelson
Mandela Bay Metropolitan Municipality, in the Eastern Cape Province of South Africa. The plant is
located approximately 0.67 km south-southeast from the N2 national road, approximately 0.23 km
northeast of Cerebos’ refinery (salt production), approximately 0.05 km south of the Spiral Wrap factory
(wrapping products manufacturing) and adjacently located Lension warehouse (biodegradable plastics
manufacturing). A site locality map is presented in Figure 2-1.
TULH/VHUY 561164-ALO_Polymers_AIR_Final amended_20210625 June 2021SRK Consulting: 561164: Atmospheric Impact Report for ALO Polymers Page 3
Table 2-3: Location and extent of ALO Polymers
Criteria Details
Physical Address of the Project Zone 7, Coega SEZ, Gqeberha
33°45'55.19"S
Coordinates of Approximate Centre of Operations
25°42'9.07"E
Extent (km2) 0.16 km2
Elevation Above Mean Sea Level (m) 51 m
Province Eastern Cape
Metropolitan/District Municipality Nelson Mandela Bay Metropolitan Municipality
TULH/VHUY 561164-ALO_Polymers_AIR_Final amended_20210625 June 2021SRK Consulting: 561164: Atmospheric Impact Report for ALO Polymers Page 4
Figure 2-1: Locality map
TULH/VHUY 561164-ALO_Polymers_AIR_Final amended_20210625 June 2021SRK Consulting: 561164: Atmospheric Impact Report for ALO Polymers Page 5
2.3 Atmospheric emission licence
The purpose of this study is to inform the application for an AEL to include the listed activities described
in Section 5 below.
3 Process description
The production of PET has two main processing steps. The first process is continuous polymerisation
(CP), which produces an opaque amorphous chip from two main raw materials. The second process
of solid-state polymerisation (SSP), applies heat and kinetic energy to the amorphous chips to increase
its intrinsic viscosity and crystallinity (to give the resin the required tensile strength for the packaging
industry). The SSP process produces a white resin which is finished product, and this is supplied to
customers.
ALO plans to build a 900 ton per day (tpd) CP plant and 600 tpd SSP plant. A second 300 tpd SSP
plant will be built when demand increases. A diagram showing the PET plant operations is presented
in Figure 3-1 and the following subsections provide a detailed description of the components of the
PET production process. Kindly note that this AIR also incorporates impacts from the second 300 tpd
SSP plant to accommodate for future expansion. Each process is described further below.
TULH/VHUY 561164-ALO_Polymers_AIR_Final amended_20210625 June 2021SRK Consulting: 561164: Atmospheric Impact Report for ALO Polymers Page 6
CP Plant SSP Plant
Pre
PTA STORAGE Crystaliser
Reactor
PASTE TANKS ESTERIFIER UFPP REACTOR HIGH 3 x CUTTERS
POLYMERISATION
Crystaliser
MEG
STORAGE
Preheater
2 X Therminol
cooling Cooler
Heaters Amorphous
tower
Storage
Waste water Small
Treatment Plant Boiler
Organic stripping column Classifier PET silos
Utilities - Electric substation, air
compressors,Chiller,Nirogen unit
ALO POLYMERS ATMOSPHERIC IMPACT REPORT Project No.
PET PRODUCTION PROCESS 561164
Figure 3-1: PET plant production process
TULH/VHUY 561164-ALO_Polymers_AIR_Final amended_20210625 June 2021SRK Consulting: 561164: Atmospheric Impact Report for ALO Polymers Page 7
3.1 The CP processes
3.1.1 Paste formation and esterification
Raw materials for the production of PET are purified terephthalic acid (PTA), purified isophthalic acid
(PIA), monoethylene glycol (MEG) and antimony trioxide (ATO), which is used as a catalyst. These
raw materials are continuously added in fixed amounts, using a ratio control system, in a Paste Mix
Tank. The purpose of the Paste Mix Tank is merely to form homogeneous paste and no reaction takes
place in this tank. The paste is continuously fed to the Esterifier, which is the first reactor in the process.
In the Esterifier vessel, paste is heated in a heat exchanger using Heat Transfer Media (HTM) from an
oil heater unit. There is an Organic Stripping Column (OSC) after the Esterifier, where water of reaction
is separated and sent to effluent treatment plant for further treatment. The Esterifier vessel
temperature is around 170 °C and operates at atmospheric pressure. The monomer (or single units of
polymer) formed in the Esterifier is fed to the polymerisation section.
3.1.2 Polymerisation
This section consists of two polymerization vessels in which the monomer further reacts to form
polyester polymer of the desired viscosity and colour. The reaction links polymer chains with the
evolution of ethylene glycol (EG). Excess EG is removed by subjecting the polymer to progressively
lower pressure and higher temperatures in the polymerisation vessels.
Monomer from the Esterifier is pumped through a jacketed (insulated) line to the first vessel, the Up
flow Pre-Polymeriser or UFPP (modelled visual is presented in Figure 3-2 (a)). The material enters at
the bottom of the vessel and flows out the top. The vessel contains separation trays and mechanical
agitation is not required. The vessel is jacketed with HTM vapour for heating and operates under
vacuum. The heat, reduced pressure and surface area generation remove most of the excess EG. On
reaching the top of the UFPP, the pre-polymer and EG vapour are separated. EG removed from the
vessel is condensed in a spray type condenser and flows to a barometric tank. The pre-polymer flows
out of the vessel and is transferred to the next and final melt reactor, the Finisher (modelled visual is
presented in Figure 3-2 (b)).
The Finisher is a specially designed horizontal cylindrical vessel with a full-length agitator. The agitator
is designed to generate high surface area in the polymer. The vessel is operated under vacuum which
removes additional EG, thereby increasing the polymer viscosity. EG removed from the vessel is
condensed in a spray type condenser and flows to a barometric tank. The EG from this barometric
tank is sent to the barometric tank linked to the spray condenser after the UFPP. The EG from this
tank is sent to a Glycol Recycle Tank, from where it is fed back into the Glycol Feed Tank for the paste
formation process.
A secondary spray condenser system is installed for environmental reasons. Here, the volatile organic
compounds from the primary spray condensers (after both the UFPP and Finisher units) are washed
by a cold glycol stream and are dissolved in the glycol. The dissolved organics in the glycol stream
are recycled into the Esterifier and are removed with the water phase of the OSC.
TULH/VHUY 561164-ALO_Polymers_AIR_Final amended_20210625 June 2021SRK Consulting: 561164: Atmospheric Impact Report for ALO Polymers Page 8
Figure 3-2 (a): Modelled UFPP vessel Figure 3-2 (b): Modelled Finisher vessel
ALO POLYMERS ATMOSPHERIC IMPACT
Project No.
REPORT 561164
MODELLED PROPOSED POLYMERISATION VESSELS
Figure 3-2: Model images of the UFPP and Finisher vessels (source: ALO Polymers)1
3.1.3 Polymer transfer line and chip making
The final polymer melt from the Finisher is pumped via a polymer transfer line to chip making. The
transfer line consists of one polymer pump and is designed to minimize the residence time in the
system. The molten polymer is filtered prior to chip making. A Torsional Oscillatory Viscometer (TOV)
is installed in the line for measurement and monitoring of the final polymer viscosity. The polymer melt
from the Finisher is fed into multiple chip making units (Cutters), which are thereafter sent to
Amorphous Storage.
3.1.4 Additives
Catalyst is added at a fixed concentration and in an amount to control the polymerization reaction as
well as the final Sb in polymer. The solubility of the catalyst in EG is low until the solution is heated up
to 160° C.
Diethylene glycol (DEG) is an unavoidable by-product of polymer preparation and the amount
generated depends on time and temperature conditions to which oligomer (molecules consisting of a
few monomer units) and polymer are exposed. Since these conditions must be varied due to other
demands, e.g. throughput changes, the unavoidable DEG variations are usually compensated for by
adding sufficient DEG with the oligomer to maintain DEG at a constant level. Approximately 0.9%
(weight percent) DEG of final polymer is injected, depending on final requirement.
Inhibitor is added to neutralize the impurities in polymer. Phosphorous in the polymer is introduced as
1% polyphosphric acid (H3PO4) solution (i.e. 1% H3PO4 and 99% EG). An excessive quantity of H3PO4
impairs the polymerisation reaction.
Toner is added to oligomer at 0.5 - 3.0 parts per a million (ppm) in final polymer and injected as 0.03%
(weight percent) solution of toner in EG to improve the colour of the product.
1
Diagrams not to scale relative to each other.
TULH/VHUY 561164-ALO_Polymers_AIR_Final amended_20210625 June 2021SRK Consulting: 561164: Atmospheric Impact Report for ALO Polymers Page 9
3.2 The SSP Process
3.2.1 Intermediate conveying
PET chips from the CP process are pneumatically conveyed to the SSP plant, into a Pre-Crystallizer
unit. The conveying system uses compressed air and includes a screw compressor, a cartridge filter
and a nitrogen purge system for the empty blowing of the conveying line.
3.2.2 Crystallizer
Before amorphous polyester can be treated thermally at temperatures above its glass transition region
(temperature range where the amorphous structure transitions from being rigid to more flexible,
typically 70 - 80 °C for this case), a sticky crystallization stage, during which the pellets have tendency
to form agglomerates, has to be overcome. Any risk of sticking together of the newly added amorphous
pellets is prevented by remixing with already crystallized material and the vigorous spouting action
caused by the large amount of circulated process gas (nitrogen). The crystallized product leaves the
process unit by displacement over a fixed weir plate.
The process gas is heated up to the required process temperature by a heater and is recirculated by
a radial fan, and after leaving the crystallizer, entrained dust is separated by a Cyclone. The gradual
enrichment of the process gas in the loop with moisture removed from the pellets, is kept at a
permissible level by exchanging a part of the circulating gas stream.
3.2.3 Pre-heater
To avoid stickiness in the Solid-State Reactor, the product is “pre-heated” above the maximum solid-
state reaction temperature in the reactor; during this process step the low melting point is shifted to a
higher temperature. After this treatment, the product temperature will be decreased slightly below the
maximum solid-state reaction temperature.
The pellets leaving the crystallizer continuously fall into the Pre-heater via a rotary valve, which
separates the crystallization loop from the preheating loop. The pellets are heated up to the required
solid stating temperature by a counter-flowing hot nitrogen gas stream, which is fed through the roofs
and distributed over the height of the annealing unit. After the Pre-heater, the pellets in the product
outlet are conveyed to the Solid-State Reactor.
The nitrogen of the preheating loop is recirculated. The return gas coming from the Pre-heater is mixed
with the return gas from the Reactor. The final product temperature of the discharged material is
controlled by regulating the temperature or the flow rate of the nitrogen, which enters the cooling
compartment at the very bottom of the Pre-heater. The hot product leaving the heater is conveyed
directly into the reactor. A dense phase conveying system with nitrogen is chosen in order to minimize
the damage to the pellets.
3.2.4 Solid state reactor
Solid state polycondensation takes place in the Solid-State Reactor, where the intrinsic viscosity of
the product increases. Via the polycondensation reaction, the molecular weight of the polymer is
increased to the desired value (depending on temperature and retention time).
The pellets from the Pre-heater are conveyed directly into the Solid-State Reactor, where the actual
polycondensation takes place in a slowly downward moving bed of pellets. The by-products from the
polymer are removed by the counter flowing nitrogen. The return gas from the Reactor is mixed with
the return gas from the Pre-heater and passes through a dust filter. Afterwards, the gas flow is divided
between the crystallization loop and the preheating loop.
TULH/VHUY 561164-ALO_Polymers_AIR_Final amended_20210625 June 2021SRK Consulting: 561164: Atmospheric Impact Report for ALO Polymers Page 10
3.2.5 Product cooling
The hot product is cooled down to temperatures that allow for storing or handling of the product. Hot
pellets are continuously fed via a rotary feed into a fluid bed Cooler and are cooled down to a
temperature at which they can be handled in the subsequent downstream systems. The product leaves
the process by displacement, via an adjustable weir plate. Ambient air is used to cool the product.
After passing through the Cooler, the hot air flows through the Cyclone to remove any entrained dust
and is exhausted by a radial fan through the silencer back into to the atmosphere.
3.3 Air emissions
3.3.1 OSC and HTM heater stack
A primary source of emissions at the facility stems from the OSC column used to strip out organics
from the reaction ‘off water’. The stripping column is a packed column where organic content from the
effluent is stripped with low pressure steam. The water is cooled and sent to the wastewater treatment
plant (WWTP) and ppm levels of organic vapour is fed to the oil heater unit, where combustion occurs.
This vapour is used for heating the CP vessels as well providing heat for the closed loop liquid heating
system for SSP system. Light Fuel Oil (LFO) will be used as the source of energy for the heaters.
While there are three heater stacks proposed for the facility, one will be on standby. A schematic of
the OSC and the HTM heater can be seen in Figure 3-3.
CO2 +H2O
Organic vapour
To HTM Unit
O
S
C
C
o
l
u
m S
n t
a
c HTM
Effluent Water k Heater Process unit
Storage Storage
tank tank
Process unit
LFO
Steam
Air
ALO POLYMERS ATMOSPHERIC IMPACT
Project No.
REPORT 561164
ALO’S OSC AND HTM HEATER
Figure 3-3: Schematic of ALO’s OSC and HTM heater (source: ALO Polymers)
TULH/VHUY 561164-ALO_Polymers_AIR_Final amended_20210625 June 2021SRK Consulting: 561164: Atmospheric Impact Report for ALO Polymers Page 11
3.3.2 Boiler stack
A small 3 ton per hour boiler generating steam at 10 bars is proposed to be installed at the facility. The
primary fuel for the boiler will be light fuel oil. The steam consumption is in the various units for different
purposes such as:
− CP Process Use (Stripping column & Line Tracing).
− Intermittent requirements like Smothering for Heat Transfer Fluid (HTF) vaporizer.
A second standby boiler (3 ton per hour) will also be installed at the facility and only be used in the
event the primary boiler is down for maintenance. Emissions from the boiler stack have been ducted
to one common heater stack (outlined above) at the plant.
3.3.3 Storage tanks
PTA and PIA will be imported in containers and stored at site on open ground in rows of three stacks
high. PTA powder will be transported from the containers to PTA day silo using drag chain conveying
system with nitrogen blanketing. A storage capacity for approximately three weeks has been
considered, which amounts to approximately 16 200 tons (i.e. 810 containers for PTA and 20
containers for PIA, 69 empty containers). Table 3-1 outlines the material storage capacity of the PET
plant tank farm.
Additionally, the utilities area will be used to store nitrogen and compressed air. Other storage areas
on site will encompass a shed, electric substation, admin building, maintenance/workshop, laboratory,
additive storage area and control room.
Table 3-1: Materials Storage Capacity
PET Plant Tank Farm
State of Dangerous Good
Material Storage Capacity Use
Matter (Yes/No)
Monoethylene Glycol Liquid No 700 m3 Raw material
(MEG)
Impure EG Liquid No 200 m3 Raw material
Therminol VP1 Liquid No 200 m3 Heat transfer medium
Di-Ethylene Glycol (DEG) Liquid No 150 m3 Additive
Light Furnace Oil (LFO) Liquid Yes 100 m3 Fuel or thermal heater
Raw Water Liquid No 1 000 m3 Cooling
Fire Water Liquid No 1 000 m3 Emergency
Pure Terephthalic Acid Solid No 1 200 m3 Raw material
(PTA) (daily use silo)
PTA (bulk container Solid No 16 200 tons Raw material
storage)
Pure Isophthalic acid (PIA) Solid No 200 m3 Raw material
Phosphoric Acid Solid Yes 810 kg Additive
Nitrogen Gas No 5 000 kg Transfer medium
Bulk Storage Tanks
MEG x 2 Liquid No 15 000 m3 Raw material
LFO Liquid Yes 7 000 m3 Fuel or thermal heater
TULH/VHUY 561164-ALO_Polymers_AIR_Final amended_20210625 June 2021SRK Consulting: 561164: Atmospheric Impact Report for ALO Polymers Page 12
Emissions from the storage tanks are to remain marginal due to the low vapour pressure of the product
being stored. Furthermore, each tank is to make use of nitrogen blanketing to reduce emissions to
atmosphere.
4 Technical information
The following technical information was provided by ALO Polymers.
4.1 Unit processes
Details of the unit processes and their core functions associated with ALO Polymers are presented in
Table 4-1.
Table 4-1: List of unit processes and functions
Unit process Unit process core function Batch or continuous
Heat and cool the raw material paste,
via external heat exchangers to modify
Continuous Polymerisation (CP) Continuous
the polymer to produce an intermediate
product (solid chips).
Solid chips reheated to form polyester
Solid State Polymerisation (SSP) Continuous
resin
4.2 Hours of operation
Details of the operating hours and days for each unit process associated with ALO Polymers are
presented in Table 4-2.
Table 4-2: List of unit processes and functions
Unit process Operating Hours Days of Operation per Year
Continuous Polymerisation (CP) 24 365
Solid State Polymerisation (SSP) 24 365
4.3 Raw materials used
Information regarding the raw materials associated with ALO Polymers is presented in Table 4-3.
Table 4-3: Raw materials used
Design consumption rate Units (quantity/period)
Raw material type
(quantity)
Purified terephthalic acid 23 000 ton/ month
Purified isophthalic acid 540 ton/ month
Monoethylene glycol 9 500 ton/ month
Diethylene glycol 80 ton/ month
Light fuel oil 3 000 ton/ month
Water 200 ton/ day
4.4 Production rates
Information regarding the production rate associated with ALO Polymers is presented in Table 4-4.
TULH/VHUY 561164-ALO_Polymers_AIR_Final amended_20210625 June 2021SRK Consulting: 561164: Atmospheric Impact Report for ALO Polymers Page 13
Table 4-4: Production Rate
Maximum Permitted Production Units (quantity/period)
Product Name Capacity (Volume) – design
capacity
PET Resin 328 500 tons/annum
4.5 Abatement equipment and appliances
The technology relating to abatement associated with ALO Polymers presented in Table 4-5.
Table 4-5: Abatement methods
Appliance function/
Appliance name Appliance type/ description
purpose
The Organic Stripping Column is a
packed column where organic content
in the effluent from the esterification The removal of organics from
Organic Stripping Column process and secondary vacuum spray process streams, and reduced
condenser, is stripped with low air emissions.
pressure steam, which is sent to the
Heat Transfer Medium Heater.
Light fuel oil and ppm level of organic
vapour from the Organic Stripping The elimination of organic
Heat Transfer Medium Heater Column undergoes combustion in a emissions to the atmosphere and
burner section to vaporise Heat increase energy efficiency.
Transfer Medium fluid.
5 Legislative framework
In South Africa, the main legislation governing air quality is the National Environmental Management:
Air Quality Act, No. 39 of 2004 (NEM:AQA). As the overarching law regulating air quality within South
Africa, the NEM:AQA aims to protect the environment by providing reasonable measures for the
prevention of pollution and ecological degradation and for securing ecologically sustainable
development while promoting justifiable economic and social development. Furthermore, the
NEM:AQA outlines national norms and standards regulating air quality monitoring, management and
control by all spheres of government.
The NEM:AQA introduces a system based on ambient air quality standards and corresponding
emission limits to achieve these. Two significant regulations stemming from NEM:AQA have been
promulgated in this regard and are as follows:
• Government Notice 1210 of 2009 (Government Gazette 32816): National Ambient Air Quality
Standards (NAAQS). Amendments were subsequently published in Government Notice 893 of
2013 (Government Gazette 37054).
• Government Notice 248 of 2010 (Government Gazette 33064): List of activities which result in
atmospheric emissions which have or may have a significant detrimental effect on the
environment, including health, social conditions, economic conditions, ecological conditions or
cultural heritage. Amendments were subsequently published in Government Notice 893 of 2013
(Government Gazette 37054) and Government Notice 1207 of 2018 (Government Gazette 42013).
Further described in the following subsections are the relevant Minimum Emissions Standards (MES)
and NAAQS as applicable to this assessment.
5.1 Minimum emission standards
The listed activity applicable to ALO Polymers in terms of Section 21 of the NEM:AQA is Category 6:
Organic Chemicals Industry. A description of Category 6 and the standards that apply to the category
TULH/VHUY 561164-ALO_Polymers_AIR_Final amended_20210625 June 2021SRK Consulting: 561164: Atmospheric Impact Report for ALO Polymers Page 14
is presented in Table 5-1. It should be noted that only the TVOCs (thermal and non-thermal) standards
are applicable.
Table 5-1: Associated Minimum Emission Standards for Subcategory 6 (Organic chemical
manufacturing)2
Description The production or use in production of organic chemicals not specified elsewhere
including acetylene, acetic, maleic or phthalic anhydride or their acids, carbon
disulphide, pyridine, formaldehyde, acetaldehyde, acrolein and its derivatives,
acrylonitrile, amines and synthetic rubber. The production of organometallic
compounds, organic dyes and pigments, surface active agents.
The polymerisation or co-polymerisation of any unsaturated hydrocarbons substituted
hydrocarbon (including vinyl chloride). The manufacture, recovery or purification of
acrylic acid or any ester of acrylic acid.
The use of toluene di-isocyanate or other di-isocyanate of comparable volatility, or
recovery of pyridine.
Application All installations producing or using more than 100 tons per annum of any of the listed
compounds. Storage tanks with cumulative tankage capacity larger than 500 cubic
meters containing any listed compound or a combination of the compounds listed above.
Substance or mixture of
substances mg/Nm3 under normal conditions of 273 Kelvin and
Plant Status
Common Name Chemical 101.3kPA
symbol
Total volatile New 150
organic
N/A
compounds
(thermal) Existing 150
Total volatile New 40 000
organic
N/A
compounds (non-
thermal) Existing 40 000
a) The following transitional arrangement shall apply for the storage and handling of raw materials,
intermediate and final products with a vapour pressure greater than 14kPa at operating
temperature:
i. Leak detection and repair (LDAR) program approved by licensing authority to be
instituted, by 01 January 2014.
b) The following special arrangements shall apply for control of TVOCs from storage of raw materials,
intermediate and final products with a vapour pressure of up to 14 kPa at operating temperature,
except during loading and offloading. (Alternative control measures that can achieve the same or
better results may be used) –
i. Storage vessels for liquids shall be of the following type:
Table 5-2: Storage vessels for liquids
Application All permanent immobile liquid storage facilities at a single
site with a combined storage capacity of greater than 1000
cubic-meters
True vapour pressure of contents at product
Type of tank or vessel
storage temperature
2
National Environment Management: Air Quality Act (No. 39 of 2004), Listed Activities and Associated Minimum Emission
Standards Identified in Terms of Section 21 Of the National Environmental Management, 2010
TULH/VHUY 561164-ALO_Polymers_AIR_Final amended_20210625 June 2021You can also read