Seventh Annual Market Monitoring Working Document - April 2019 - IRG Rail
←
→
Page content transcription
If your browser does not render page correctly, please read the page content below
Seventh Annual
Market Monitoring Working Document
 April 2019
List of contents
List of country abbreviations and regulatory bodies .................................................................... 3
List of figures ................................................................................................................................. 4
1. Introduction .......................................................................................................................... 7
2. Network characteristics of the railway market ..................................................................... 9
 2.1. Total route length.......................................................................................................... 9
 2.2. Electrified route length ............................................................................................... 10
 2.3. High-speed route length ............................................................................................. 11
 2.4. Main infrastructure managers’ share of route length ................................................ 11
 2.5. Network usage intensity ............................................................................................. 12
 2.6. Railway undertaking revenues with respect to the rail network ................................ 13
3. Track access charges paid by railway undertakings for the minimum access package ...... 15
4. Market players and global rail traffic .................................................................................. 19
 4.1. Market players ............................................................................................................ 19
 4.2. Total rail traffic ............................................................................................................ 20
5. The rail freight market ........................................................................................................ 22
 5.1. Rail freight market size ................................................................................................ 22
 5.2. Market shares of freight railway undertakings ........................................................... 24
 5.3. Economic performance of freight railway undertakings ............................................ 25
6. The rail passenger market ................................................................................................... 27
 6.1. Rail passenger market size .......................................................................................... 28
 6.2. Market shares of passenger railway undertakings ..................................................... 30
 6.3. Economic performance of passenger railway undertakings ....................................... 31
7. Competition for the passenger market with focus on the procedures for award of public
service contracts ......................................................................................................................... 35
8. Incumbent’s strategy to access rail passenger markets abroad ......................................... 48
 8.1. Total number of passenger railway undertakings by country and their activities...... 48
 8.2. Strategies of historical incumbents when operating abroad via their subsidiaries .... 52
 8.3. Services offered by historical incumbents when operating abroad via their subsidies
 57
9. Key regulatory decisions in 2017 ........................................................................................ 61

 2
List of country abbreviations and regulatory bodies

 Country Country abbreviation Participating regulatory bodies
 Austria AT Schienen-Control GmbH
 Regulatory Body for Railway
 Belgium BE Transport and for Brussels Airport
 Operations
 Railway Administration Executive
 Bulgaria BG
 Agency
 Transport Infrastructure Access
 Czech Republic CZ
 Authority
 Croatia HR HAKOM
 Denmark DK Jernbanenaevnet
 Estonia EE Estonian Competition Authority
 Finnish Transport and
 Finland FI
 Communications Agency Traficom
 Autorité de Régulation des Activités
 France FR
 Ferroviaires et Routières
 Germany DE Bundesnetzagentur
 Greece GR Regulatory Authority for Railways
 Hungary HU Rail Regulatory Body
 Autorità di Regolazione dei
 Italy IT
 Trasporti
 Kosovo KS Railway Regulatory Authority
 Latvia LV State Railway Administration
 Communications Regulatory
 Lithuania LT Authority of the Republic of
 Lithuania
 Institut Luxembourgeois de
 Luxembourg LU
 Régulation
 Netherlands NL Autoriteit Consument & Markt
 Norway NO Statens jernbanetilsyn
 Poland PL Urząd Transportu Kolejowego
 AMT - Autoridade da Mobilidade e
 Portugal PT
 dos Transportes
 Republic of North Macedonian Railway Regulatory
 MK
 Macedonia Agency
 Consiliul Naţional de Supraveghere
 Romania RO
 din Domeniul Feroviar
 Slovakia SK Transport Authority
 Slovenia SI AKOS
 Comisión Nacional de los
 Spain ES
 Mercados y la Competencia
 Sweden SE Transportstyrelsen
 Schiedskommission im
 Switzerland CH
 Eisenbahnverkehr
 United Kingdom UK Office of Rail and Road

 3
List of figures
Figure 1 – Evolution of total route length (in km and in %) between 2016 and 2017 ................. 9
Figure 2 – Electrified route length (in km and in % of the total route length) in 2017 ............... 10
Figure 3 – High-speed route length (in km) in 2017 ................................................................... 11
Figure 4 – Main infrastructure manager’s share of total route length in 2017 .......................... 12
Figure 5 – Network usage intensity (train-km per route km per day) in 2017 ........................... 13
Figure 6 – Total railway undertaking revenues per route length (in thousand Euro per km) in
 2017........................................................................................................................... 13
Figure 7 – Infrastructure managers revenues (in Euro per train-km) from railway
 undertakings for the minimum access package in 2017 ........................................... 15
Figure 8 – Infrastructure managers revenues share from railway undertakings of passenger
 and freight markets in 2017 ...................................................................................... 16
Figure 9 – Infrastructure managers revenues from railways undertakings per train-km per
 passenger and freight services in 2017 ..................................................................... 17
Figure 10 – Number of active railway undertakings (total and per service) in 2017 .................. 19
Figure 11 – Rail traffic (in millions train-km) and the breakdown between passenger and
 freight services (in %, based on train-km) in 2016 ................................................... 20
Figure 12 – Rail freight traffic (in billion net tonne-km) in 2017 and evolution between 2016
 and 2017.................................................................................................................... 23
Figure 13 – Freight traffic load (tonne-km per freight train-km) in 2017 ................................... 23
Figure 14 – Market shares of freight railway undertakings (based on train-km) in 2017 .......... 24
Figure 15 – Market shares of freight railway undertakings (based on net tonne-km) in 2017 .. 25
Figure 16 – Freight operators' revenues per train-km and net tonne-km in 2017 ..................... 25
Figure 17 – Share of PSO and non-PSO services (based on train-km) in 2017............................ 27
Figure 18 – Share of PSO and non-PSO services (based on passenger-km) in 2017 ................... 28
Figure 19 – Number of passenger-km per passenger train-km in 2017 ..................................... 28
Figure 20 – Passenger transport in billion passenger-km in 2017 .............................................. 29
Figure 21 – Passenger transport (in million passengers) in 2017 ............................................... 30
Figure 22 – Market shares of passenger railway undertakings (based on passenger-km) in
 2017........................................................................................................................... 31
Figure 23 – Market shares of passenger railway undertakings (based on train-km) in 2017 ..... 31
Figure 24 – Passenger operators' revenues (in passenger-km and in passenger train-km) in
 2017........................................................................................................................... 32
Figure 25 – Passenger operators' revenues from fares (in Eurocent per passenger-km) in
 2017........................................................................................................................... 32
Figure 26 – Share of passenger operators' revenues from fares and compensations in 2017... 33
Figure 27 – Passenger PSO operators' revenues from fares (in Eurocent per passenger-km) in
 2017........................................................................................................................... 33
Figure 28 – Share of passenger PSO operators' revenues from fares and compensations in
 2017........................................................................................................................... 33
Figure 29 – Number of active railway undertakings and ownership groups by country ............ 49
Figure 30 – Share of railway undertakings according to the type of ownership ........................ 50

 4
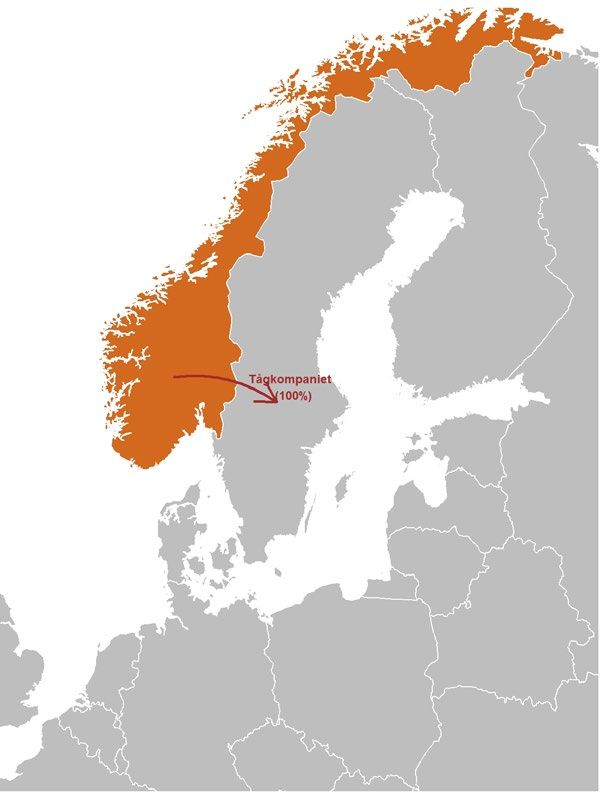
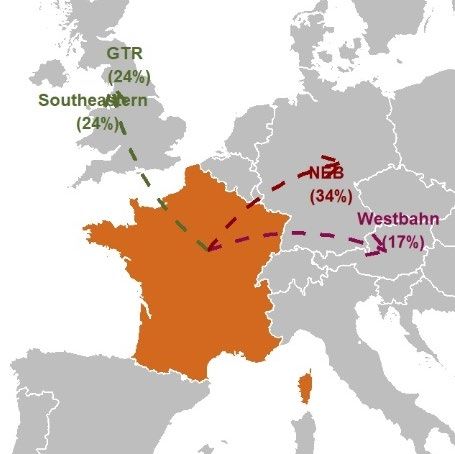
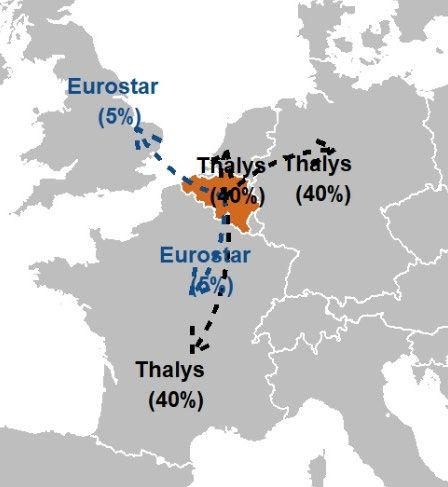
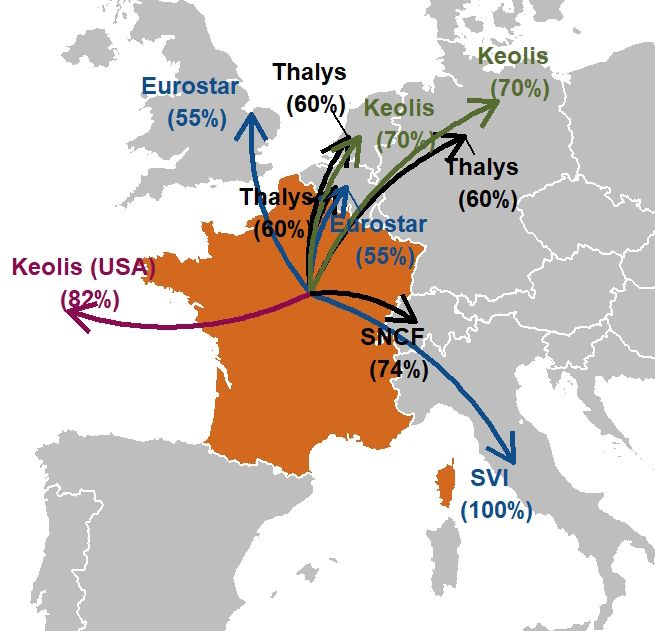
Figure 31 – Type of services provided by passenger railway undertakings in each country
 (based on number of railway undertakings) ............................................................. 51
Figure 32 – Markets entered abroad according to the seat of the incumbent’s subsidiaries .... 52
Figure 33 – Presence of ten incumbents abroad via their subsidiaries ...................................... 53
Figure 34 – Types of service provided in markets abroad by historical incumbents’
 subsidiaries (in number of markets entered)............................................................ 57
Figure 35 – Type of complementary services offered abroad by historical incumbents’
 subsidiaries ................................................................................................................ 59

 5
01
 Introduction

 Participating countries

 AT - Austria LV - Latvia
 BE - Belgium LT - Lithuania
 BG - Bulgaria LU - Luxembourg
 HR - Croatia MK - Republic of
 CZ - Czech North Macedonia
 Republic NL - Netherlands
DK - Denmark NO - Norway
 EE - Estonia PL - Poland
 FI - Finland PT - Portugal
 FR - France RO - Romania
 DE - Germany SK - Slovakia
 GR - Greece SI - Slovenia
 HU - Hungary ES - Spain
 IT - Italy SE - Sweden
 KS - Kosovo CH - Switzerland
 UK - United Kingdom
1. Introduction

This working document complements the Seventh IRG-Rail Market Monitoring
report 1 by providing country specific data (mostly for 2017) and further context to
the results presented in the main report. The aim of this document is to provide a
more detailed description and analysis on the developments in the monitored
countries.
The content of the working document follows the structure set up in the main
report, with chapters on the network characteristics of the railway market
(Chapter 2), the track access charges paid by railway undertakings for the
minimum access package (Chapter 3), the market players and global rail traffic
(Chapter 4) before eventually analysing the rail freight (Chapter 5) and the
passenger (Chapter 6) markets.
There are two focuses of this year’s report on the competition for the market with
an analysis on the outcome of awarding procedures for public service contracts
(Chapter 7), followed by an investigation into incumbents’ strategies to access
rail passenger markets abroad (Chapter 8).
Additionally, the working document also includes a summary of important
regulatory decisions taken (Chapter 9) and for which consequences appeared in
2017.
All data provided in the tables and figures of the working document is available
on the IRG-Rail website. 2
The working document can either be read as a separate report, or in parts for
anyone interested in country specific or more detailed information than that
presented in the main report.

1
 The Seventh IRG-Rail Market Monitoring Report can be found on IRG-Rail website.
2
 The data is available on IRG-Rail website.

 7
02
Network characteristics
 of the railway market

2. Network characteristics of the railway market
 2.1. Total route length

Compared to 2016, only four countries have seen a change in total route length
of more than 1% (Figure 1). For France, the increase of 346 route km (1.2%) is a
result of the opening of new lines between Tours and Bordeaux, Le Mans and
Rennes (of which 94% is high-speed lines), and Nimes and Montpellier, offset
somewhat by a decrease of classic lines. The total route length for the
Netherlands has decreased by 313 km (9.3%) compared to 2016. This is a
reversal of a change between 2015 and 2016 which saw the route length in the
Netherlands increase by 310 km. This is because in 2016 the infrastructure
manager in the Netherlands used a different method for the calculation of route
length.
For the other countries with changes in route length, these can be attributed to
construction or decommission of routes and changes in reporting practices over
time. For example, the increase in route length for the UK is partly a result of data
quality improvements following the introduction of a new database for track
assets. For Spain, the reduction compared to 2016 is due to the decommissioning
of sections of Iberian gauge track that have not been used for many years,
whereas for Poland old lines in the North-East of the country were reopened,
leading to an increase in route length. For Germany, the increase is largely due
to the opening of a new line between Ebensfeld and Erfurt in 2017.
Eleven countries had no change in their route length between 2016 and 2017.
The combined route length across the participating countries increased by
316 km compared to the previous year, which represents less than 0.2% of the
total route length.
 Figure 1 – Evolution of total route length (in km and in %)
 between 2016 and 2017

 346 gains and losses compared to 2016 in km 316

 185

 77 62 67
 41
 6

 AT BE BG HR CZ DK EE FI FR DE GR HU IT KS LV LT LU MK NL NO PL PT RO SK SI ES SE CH UK Sum
 -2 -13 -16 -7 -8
 -112

 -313

 gains and losses compared to 2016 in percent
 1,2% 1,2%
 0,7% 0,5% 0,4% 0,4%0,14%
 0,1%

 AT BE BG HR CZ DK EE FI FR DE GR HU IT KS LV LT LU MK NL NO PL PT RO SK SI ES SE CH UK Sum
 -0,1% -0,5% -0,3% -0,1%
 -0,7%
 -2,3%

 -9,3%

 9

2.2. Electrified route length

The level of electrification of the railway network differs significantly between
countries (Figure 2). Switzerland is the only participating country with a fully
electrified network, while Kosovo has the only network on which no lines are
electrified. Overall, 55% of the total route for participating countries is electrified.
Many countries have had small increases in the length of electrified route since
2016 with the largest increases seen in France, the UK and Germany. In France,
this is due to the construction of the new lines mentioned above, which are all
electrified. These changes are indicative of investment in the rail networks to
electrify existing lines and the construction of new electric routes. The use of
electric powered trains is considered cleaner and more efficient than diesel
powered equivalents and may help to increase capacity on existing networks.
Poland, Portugal and Spain are the only countries in which the length of electrified
route has fallen from year to year. However, this year-over-year evolution does
not always reflect the longer-term trend of electrification. For instance, in the case
of Spain, despite the year-on-year reduction, there has been an upward trend in
the length of the electrified route between 2012 and 2017, increasing from
9,063 km to 9,730 km. In Poland there is a plan for the electrification of about 300
km of lines in the upcoming years.
 Figure 2 – Electrified route length (in km and in % of the total route length) in 2017

 in kilometres
 20 736

 16 641
 13 291
 11 829
 9 730
 8 189
 5 323 5 875
 4 004 3 238 3 331 4 030
 3 102 2 870 3 066 2 310 2 459
 980 1 639 1 588
 642 132 532 0 257 152 262 324 609

 AT BE BG HR CZ DK EE FI FR DE GR HU IT KS LV LT LU MK NL NO PL PT RO SK SI ES SE CH UK
 in % of total route length
 100%
 95%
 86%
 76% 75%
 71% 71%
 67% 64% 61% 64% 63%
 56% 58% 53% 55%
 47% 50%
 41% 44%
 38% 34% 38% 36%
 25% 24%
 9% 12% 8%
 0%

 AT BE BG HR CZ DK EE FI FR DE GR HU IT KS LV LT LU MK NL NO PL PT RO SK SI ES SE CH UK AVG

 10
2.3. High-speed route length

Another indicator of the ongoing development of the European railway network is
the expansion of high-speed lines. Seven countries now report having high-speed
lines as defined in the European Commission’s Implementing Regulation
2015/1100 (Figure 3).
The total length of high-speed route in the participating countries in 2017 amounts
to 7,972 km of lines, increasing by 8% in one year (+576 km). This change is
primarily driven by the construction of new high-speed lines in France (+473 km)
on routes between Tours and Bordeaux and Le Mans and Rennes, in Germany
(+107 km) between Ebensfeld and Erfurt and in the Netherlands (+15 km). On
average, the annual growth rate since 2013 is 4.7%.
 Figure 3 – High-speed route length (in km) in 2017

 7 972
 7 397 137
 7 134
 137 109 87
 6 623 6 621 261
 125 109 72
 109 261 963
 261
 109 109 1
 261 261 963 Switzerland
 923
 923 923 1 101 Netherlands
 994 994
 UK
 871 871
 Belgium
 2 640 Italy
 2 030 2 166
 2 033 2 033 Germany
 France
 Spain

 2 426 2 424 2 692 2 695 2 675

 2013 2014 2015 2016 2017
 1on swiss high-speed-tunnel-tracks trains run at max. 200 km/h
 due to capacity issues

 2.4. Main infrastructure managers’ share of route length

The main infrastructure managers control 93% of the total route length across the
participating countries (Figure 4). In 15 countries, the main infrastructure
manager controls 100% of the network. In Czech Republic, whose data is
included in the market monitoring report for the first time, the main infrastructure
manager controls 98% of the total route.Only three countries have a main
infrastructure manager’s share of 80% or lower; Switzerland (58%), Kosovo
(76%) and Denmark (80%).
There have been only marginal changes in the share of route controlled by the
main infrastructure manager since 2016, with France showing minor decreases
in the proportion of route controlled by the main infrastructure manager

 11
(-2 percentage points). This is due to new newly opened routes not being
managed by the main infrastructure manager.
 Figure 4 – Main infrastructure manager’s share of total route length in 2017

 100%100%100% 98% 100% 98% 100% 100%100%100%100%100%100% 100%100%100%100%
 96% 99,9% 97%
 94% 93%
 88% 89%
 85% 85% 84%
 80%
 76%

 58%

 AT BE BG HR CZ DK EE FI FR DE GR HU IT KS LV LT LU MK NL NO PL PT RO SK SI ES SE CH UK AVG

 2.5. Network usage intensity

Network usage intensity measures the number of train-km per route km per day
and is an indicator of the overall occupancy of the network. However, it cannot
be considered a true measure for congestion, as multi-track lines are not taken
into account. Moreover, the intensity of usage of the rail network can vary
significantly between different regions within a country.
For most participating countries, the rail networks are more highly used by
passenger services than by freight trains (Figure 5). Lithuania, Latvia and
Slovenia are the only countries in which the rail network is utilised more
intensively by freight services than passenger services. The usage intensity for
freight is highest in Slovenia, followed by Austria and Germany, which may reflect
the level of cross-border freight traffic in these countries.

 12
Figure 5 – Network usage intensity (train-km per route km per day) in 2017

 144

 116

 95
 88
 82 80 77 75
 134
 102
 54
 50 50 48
 90 56 45
 84 58 40 40 38 38
 77 65 37 34 34
 23
 44 37 24 23 22 22
 44 39 20
 31 33 26 31 29 23 18
 30 13 13
 18 17 16 9
 24 26 15 7 7
 15 19 13 12 10 2
 9 10 10 6 11 7 9 7 12 8 8 11 6 6 7 10 5
 6 4 5 4 6 1 3 2 10
 NL CH UK DK LU AT DE BE AVG IT SI CZ FR SE PT SK HU NO ES PL RO HR FI LT BG LV GR EE MK KS

 Freight Passenger

 2.6. Railway undertaking revenues with respect to the rail network

Figure 6 shows the total railway undertaking revenue (that includes the revenues
from fares as well as the compensations for both passenger and freight railway
undertakings) per route length per country. With an average value of
358 thousand Euro per route kilometre, this indicator shows high disparity across
countries: from 8 thousand Euro of revenue for railway undertakings in Kosovo,
to 934 thousand Euro in the Netherlands. These differences could be explained
by several reasons, such as the size of the network, operators’ revenues from
fares or from compensations, the usage intensity of the rail network amongst
others.
 Figure 6 – Total railway undertaking revenues per route length
 (in thousand Euro per km) in 2017 3

 934

 821
 795

 667

 530 528

 360 358

 217 213 207
 168 154 141 122 111
 88
 65 57 56
 8

 NL UK LU DK AT DE IT AVG ES LT SE LV PL PT FI RO HU HR BG GR KS

3
 The average takes into account the countries mentioned in the figure. The missing country are not
included in this average.

 13
03
 Track access charges
 paid by railway
 undertakings for the
minimum access package
3. Track access charges paid by railway undertakings for the minimum
 access package

Directive 2012/34/EU which was to be implemented before June 16th, 2015
required Member States across Europe to harmonise their charging methods.
Figure 7 shows that the average track access charge (TAC) per train-km paid by
railway undertakings varies widely among countries. In Lithuania, railway
undertakings pay on average 13.36 Euro of TAC per train-km, while railway
undertakings in Slovenia pay on average 0.54 Euro. In Slovenia, this relatively
low amount is because operators of PSO passenger services are exempted from
paying TAC.
It is worth noting that Figure 7 does not allow drawing any clear comparison of
track access charges between the monitored markets. In some countries, the
track access charges for passenger trains also encompass for instance station
usage or other costs that may not be included in the TAC in other countries.
 Figure 7 – Infrastructure managers revenues (in Euro per train-km)
 from railway undertakings for the minimum access package in 2017 4

 13,36

 8,75
 7,99
 7,39

 5,96

 4,65
 4,32 4,11
 3,89 3,84
 3,07
 2,43 2,20
 2,07 1,95 1,85 1,85
 1,60 1,36
 1,20 1,12 0,99 0,97
 0,93
 0,68 0,64 0,54

 LT LV FR BE CH DE MK ES AVG UK IT AT RO PL LU PT NL SK GR DK SE FI BG CZ HR NO SI

Figure 8 shows that track access charges paid by operators are mainly derived
from passenger services. In most countries, this is due to the fact that there are
more passenger services than freight services. In some countries, however, this
is also due to a large difference in track access charges between passenger and
freight services, as shown in Figure 9.

4
 The average value in this graph differs from the one in the main report since the samples are different:
this one includes all the available data for 2017 while the one in the main report includes only countries
which provided data for the 2013-2017 period.

 15
Figure 8 – Infrastructure managers revenues share from railway undertakings
 of passenger and freight markets in 2017 5

 1% 3% 4% 5% 6% 8% 10% 11% 12% 12% 13%
 16% 16%
 20%
 32% 33% 35% 35%
 41%
 49% 51% 51%
 64%
 69%

 93%
 99% 97% 96% 95% 99%
 94% 92%
 90% 89% 88% 88% 87%
 84% 84%
 80%
 68% 67% 65% 65%
 59%
 51% 49% 49%
 36%
 31%

 7%
 1%
 ES UK FR BE LU IT GR NL PT CH AVG DK DE NO SE AT SK RO HR BG PL CZ FI LV LT SI

 passenger freight

Figure 9 shows that on average freight services pay less TAC (2.81 Euro per
train-km) than passenger services (4.17 Euro per train-km). In France, passenger
services pay 8.94 Euro per train-km on average (the highest of the monitored
countries), while freight services pay 2.30 Euro. The amount of TAC paid by
railway undertakings depends on pricing rules that differ according to whether
this are freight or passenger services. In both cases, TAC include reservation,
the use of railway infrastructure and the use of electrical supply equipment for
traction current. Moreover, in France, freight services receive a public grant
(called the “freight compensation”) directly paid by the state to the infrastructure
in order to finance the part of the marginal cost which is not covered by TAC paid
by the freight operators.
In Lithuania, freight operators pay 21.16 Euro per train-km on average, while
passenger services providers pay 2.17 Euro. This is because the rail network is
much more highly used by freight trains than by passenger trains. Lithuania has
identified market segments that can bear mark-ups in order to obtain full recovery
of the costs incurred by the infrastructure manager. The mark-ups are applied to;
passenger transit, cargo transit, dangerous goods carriage, low-value goods
carriage and other goods carriage market segments. 6 In view of these, freight
trains face higher charges for the minimum access package than passenger
trains.
In Latvia, freight services pay 10.36 Euro per train-km on average, while
passenger services pay 6.47 Euro. This is because the scope of the minimum
access package differs significantly for freight and passenger railway
undertakings. The minimum access package for freight includes infrastructure
that is used only by freight railway undertakings such as freight railway stations

5
 The average value in this graph differs from the one in the main report since the samples are different:
this one includes all the available data for 2017 while the one in the main report includes only countries
which provided data for the 2013-2017 period.
6
 More information is available here: https://www.rrt.lt/en/railways/supervision-of-charges.

 16
and sidings. As the minimum access package for passenger railway undertakings
does not include freight specific infrastructure, the charge of the minimum access
package for passenger railway undertakings is considerably lower.
In Belgium, passenger services pay 8.17 Euro per train-km on average, while
freight services pay 2.48 Euro. This is because freight operators only need to pay
the direct cost they cause as a result of operating the train service. The
infrastructure manager in Belgium uses mark-ups in addition to the direct costs
to obtain full recovery of its costs. Because the market needs to be able to bear
these costs, these are charged mostly to the passenger railway undertakings.
In Slovenia, freight operators pay 1.01 Euro per train-km on average, while
passenger services pay 0.01 Euro. This is because passenger trains operating
under PSO contracts are exempt from paying TAC.
In Portugal, freight operators pay 1.33 Euro per train-km on average, while
passenger operators pay 1.96 Euro. This is because the calculation rules laid
down in the national regulation for minimum access package charges define
different parameters for each market segment; freight, urban, regional, long
distance/international and empty trains.

 Figure 9 – Infrastructure managers revenues from railways undertakings
 per train-km per passenger and freight services in 2017 7

 Passenger services
 8,94
 8,17

 6,47
 6,01
 5,19
 4,67
 3,94 4,17
 3,22
 2,35 2,17 1,96
 1,75 1,96 1,93
 1,33 1,40 1,53 1,51
 1,06 0,99
 0,67 0,54 0,58 0,51 0,65
 0,01

 AT BE BG HR CZ DK EE FI FR DE GR HU IT KS LV LT LU MK NL NO PL PT RO SK SI ES SE CH UK AVG

 Freight services

 21,16

 10,36

 5,68
 4,06 3,25 3,14
 2,61 2,48 1,73 2,13 2,14 2,30 3,00 1,78 2,04 1,92 1,33
 2,96
 1,81 1,01 1,58 2,15 2,81
 1,06 0,62 0,28

 AT BE BG HR CZ DK EE FI FR DE GR HU IT KS LV LT LU MK NL NO PL PT RO SK SI ES SE CH UK AVG

7
 The average value in this graph differs from the one in the main report since the samples are different:
this one includes all the available data for 2017 while the one in the main report includes only countries
which provided data for the 2013-2017 period.

 17
04
 Market players
and global rail traffic
4. Market players and global rail traffic
 4.1. Market players

The number of active railway undertakings in IRG-Rail member countries varies
significantly, depending on historical national developments, barriers to market
entry or other factors. In some countries, such as Lithuania and the Republic of
North Macedonia, there is one single railway undertaking offering both passenger
and freight services. Conversely, Germany (319), Czech Republic (99) and
Poland (86) reported the highest numbers of active railway undertakings in 2017.8
Most countries experienced an increase or stable number of railway undertakings
in comparison to 2016, with only four out of 29 countries seeing a decline in the
number of active railway undertakings (Germany, Slovenia, Sweden and UK).
 Figure 10 – Number of active railway undertakings (total and per service) in 2017

 Total per country
 99
 86
 61
 42 47 43
 34 35
 25 28 28
 15 15 14 17 20
 8 5 11 5 11
 2 319 2 3 1 2 1 4

 AT BE BG HR CZ DK EE FI FR DE GR HU IT KS LV LT LU MK NL NO PL PT RO SK SI ES SE CH UK

 Number of active RUs Passenger and Freight
 137

 97
 75

 36 39 40
 28 27 32
 12 14 7 15
 22
 19 24 22 21 26
 15 2 1 2 3 1 1 15 11 2 4 10 911
 3 1 1
 95
 2 1 4 229 2 4 1 3 1 1
 1
 1 56 2 6 4 1 1
 9

 AT BE BG HR CZ DK EE FI FR DE GR HU IT KS LV LT LU MK NL NO PL PT RO SK SI ES SE CH UK

 Passenger Freight

For the majority of member countries, the number of active freight railway
undertakings exceeds the number of passenger railways undertakings. This may
be because the liberalisation of the freight market began earlier. When observing
the absolute numbers of freight and passenger railways undertakings, some
undertakings might be listed twice within one country when they operate both in
the freight and the passenger sectors. Consequently, the sum of active
passenger and freight railways undertakings can appear to be greater than the
total number of railways undertakings (Figure 10).
The proportion of passenger undertakings operating PSO services varies
significantly across countries. In 13 countries 100% of passenger services are
PSO, whereas in others such as Belgium (33%), France (25%) or Czech Republic
(18%) only a minority of undertakings run under PSO. However, this does not
necessarily imply that these markets are more competitive, as this can depend

8
 Please note that due to different counting rules, the number of passenger RUs active in each country
may not be the same as the one found in Chapter 8. Refer to Section 8.1. for more details.

 19
on other factors such as the process for awarding PSO contracts (e.g.
tendering). 9

 4.2. Total rail traffic

A total of 4.52 billion train-km was reported in 2017 in the 29 countries. Breaking
this down by country reveals that Germany (24%), the United Kingdom (13%)
and France (11%) contributed almost half of the amount (47%) of the total supply
(Figure 11).
Passenger services accounted for 81% of the total train-km. This is typical of the
majority of monitored countries, with the share passenger train-km ranging
between 67% (Poland) and 95% (Denmark). There are only three countries
(Latvia, Lithuania and Slovenia) where the share of freight traffic exceeds that of
passenger traffic. Although overall train-km have been steadily increasing since
2013, the distribution between freight and passenger traffic has not changed,
suggesting that both freight and passenger traffic are increasing at a similar rate.
 Figure 11 – Rail traffic (in millions train-km) and the breakdown between passenger and freight services
 (in %, based on train-km) in 2016

 1 104 in million train kilometres

 567
 475
 366
 240
 165 168 160 193 160 226
 99 82 104 94
 30 22 48 14 15 52 37 51 22
 7 11 0,3 8 2

 AT BE BG HR CZ DK EE FI FR DE GR HU IT KS LV LT LU MK NL NO PL PT RO SK SI ES SE CH UK

 in percent
 5% 8% 6% 7% 13% 23% 13% 6% 19%
 14%
 28% 26% 22% 21% 30% 14% 25% 20% 13% 21% 28% 21% 17% 26%
 31% 33% 31%
 59% 59% 53%

 95% 92% 94% 93% 87% 77% 87% 94% 81%
 86%
 72% 74% 78% 79% 70% 86% 75% 80% 87% 79% 72% 79% 83% 74%
 69% 67% 69%
 41% 41% 47%

 AT BE BG HR CZ DK EE FI FR DE GR HU IT KS LV LT LU MK NL NO PL PT RO SK SI ES SE CH UK AVG

 passenger freight

9
 Please refer to the Chapter 7 for additional details on the awarding procedure of public service
contracts.

 20
05
 The rail
freight market
5. The rail freight market
 5.1. Rail freight market size

The total demand in 2017 was 451 billion net tonne-km (across the 28 countries
observed). The German, Polish and French rail freight markets continued to be
the largest; together they represent just under 50% of the total demand.
Rail freight traffic saw a 4.0% increase in tonne-km between 2016 and 2017
(Figure 12). Across the monitored countries there was a wide variation in
development between 2016 and 2017, ranging from -11.2% in Denmark to 31%
in Norway and 41% in Greece. A decrease in net tonne-km was noted in seven
countries compared to 2016, while the demand for freight services increased in
18 countries (and remained constant in another). For countries with relatively low
absolute values of traffic, a small variation in traffic can show as a large
percentage change, which may reflect the apparently wide range of change
across the monitored countries.
In Greece, the large increase of 41% can be explained by resolving some
problems experienced the previous year (for example traffic was stopped on a
section of the Thessaloniki - Idomeni railway line for approximately two and a half
months due to the takeover of the line by refugees/immigrants). 10 Furthermore,
there was an increase in the volume of freight transport between the two largest
commercial ports of Athens and Thessaloniki.
In Norway, the increase of 31% can be explained by an increase in intermodal
national rail freight traffic, driven by the two competitors CargoNet AS (the
Norwegian incumbent) and Green Cargo AB (the Swedish incumbent). An
important factor in that increase was that 2017 saw relatively high reliability and
availability of the rail infrastructure in Norway when compared with previous
years. This allowed the railway undertakings to offer more continual and reliable
intermodal rail freight services.

10
 See Sixth Market Monitoring Working Document.

 22
Figure 12 – Rail freight traffic (in billion net tonne-km) in 2017
 and evolution between 2016 and 2017

 Freight traffic in billion net tonne kilometres
 128,7

 54,8
 33,4
 23,5 23,2 21,8
 15,8 12,5 15,0 15,4 13,6 9,6 11,7 17,2
 7,7 3,9 2,3 0,5 2,3
 10,4
 0,4 0,02 0,3 4,3 4,2 2,8 5,1 10,4

 AT BE BG HR CZ DK EE FI FR DE GR HU IT KS LV LT LU MK NL NO PL PT RO SK SI ES SE CH UK

 gains and losses compared to 2016

 41,1%

 30,6%

 15,9%
 14,1% 15,9% 11,8% 12,5%
 8,2% 9,6% 8,3% 4,7%
 3,0% 5,5% 1,4%
 2,7% 2,1%
 1,4% 2,0% 0,7%
 4,0%
 0,0%

 AT BE BG HR CZ DK EE FI FR DE GR HU IT KS LV LT LU MK NL NO PL PT RO SK SI ES SE CH UK Sum
 -0,9% -0,8% -3,1%
 -5,4% -5,8% -6,3%
 -11,2%

As in 2016, the Baltic States showed the highest load factor in 2017, more than
three times the overall average of 535 tonne-km per train-km (Figure 13). This is
likely due to their infrastructure allowing much heavier loaded wagons than in the
rest of Europe. 11
After the Baltic countries, Finland shows the highest load factor with 729 tonne-
km per train-km, followed by Poland (685). The lowest value is recorded in
Denmark with 120 tonne-km per train-km.
 Figure 13 – Freight traffic load (tonne-km per freight train-km) in 2017

11
 The average value in this graph differs from the one in the main report since the samples are
different: this one includes all the available data for 2017 while the one in the main report includes only
countries which provided data for the 2013-2017 period.

 23
5.2. Market shares of freight railway undertakings

The market shares of incumbent and non-incumbent railway undertakings are an
important indicator of the potential for competitive advantages for incumbent
operators, and of the possible barriers to new entrants.
In some countries the domestic incumbent is still the only freight operator, as is
the case in Greece, Kosovo, Lithuania, Luxembourg and the Republic of North
Macedonia. In Finland, the incumbent continues to operate nearly 100% of the
market. Conversely, in some countries there is are neither domestic nor foreign
incumbents active on the freight market, for example in Portugal and Denmark.
New entrants in the freight market can be either foreign incumbents (from another
country) or non-incumbents (national or foreign ones). The share of new entrants
is relatively high in some countries. In the Netherlands more than half of the
market share is dominated by the foreign incumbent (58% of tonne-km and 61%
of train-km), with the remaining market in the hands of non-incumbent
undertakings. Whereas in the United Kingdom the opposite is observed with non-
incumbents operating 55% of tonne-km and 53% of train-km.
Across all the countries observed 57% of the traffic is performed by the domestic
incumbent (in both tonne-km and in train-km), 13% by foreign incumbents and
30% by non-incumbents. Sweden, Poland, Norway, Italy and Germany all have
similar market structures to the overall picture. For most of the remaining
countries the domestic incumbent has a much higher share.
 Figure 14 – Market shares of freight railway undertakings (based on train-km) in 2017

 24
Figure 15 – Market shares of freight railway undertakings (based on net tonne-km) in 2017 12

 5.3. Economic performance of freight railway undertakings

The revenue per train-km for freight operators ranges from 11.94 Euro in Spain
to 51.59 in Luxembourg (Figure 16). Per net tonne-km, the freight operators’
revenues ranges from 1.99 Eurocent in Latvia to 10.29 Eurocent in Kosovo.
 Figure 16 – Freight operators' revenues per train-km and net tonne-km in 2017

 In Euro per freight train-km
 51,38

 42,55
 36,66 36,02
 31,51
 25,47
 21,57 22,02 21,03 22,09 21,30
 19,83
 16,21 18,37 17,65 17,86
 15,32
 13,2213,06 13,29 11,94

 0,00

 AT BE BG HR CZ DK EE FI FR DE GR HU IT KS LV LT LU MK NL NO PL PT RO SK SI ES SE CH UK AVG

 In Eurocent per net tonne-km

 10,29
 9,36

 6,09
 4,62 4,43 3,91 4,34 3,96 4,59
 3,87
 2,76 3,24 3,02 3,04 3,55 3,23 2,96 2,83 3,31
 1,99 2,48
 0,00

 AT BE BG HR CZ DK EE FI FR DE GR HU IT KS LV LT LU MK NL NO PL PT RO SK SI ES SE CH UK AVG

12
 The average value in this graph differs from the one in the main report since the samples are
different: this one includes all the available data for 2017 while the one in the main report includes only
countries which provided data for the 2013-2017 period.

 25
06
 The rail
passenger market
6. The rail passenger market

Across the monitored countries PSO services account for 83% of the train-km
offered on the passenger market. There are 9 countries in which the share of
non-PSO train-km is lower than 5% (Belgium, Croatia, Estonia, Hungary,
Luxembourg, the Netherlands, Norway, Slovenia and the UK). In some countries,
such as Romania, international traffic makes up all of the non-PSO operations,
with domestic traffic exclusively provided by PSO services. In Germany non-PSO
services are provided in long-distance railway transport. For geographical
reasons, some countries such as Lithuania, Romania and Slovenia 13 do not
distinguish between regional and long-distance services.
 Figure 17 – Share of PSO and non-PSO services (based on train-km) in 2017

 1% 3% 0,03% 1% 0,5% 1% 0,4% 2%
 4% 6% 6% 5% 8% 8% 6% 7%
 8%
 18% 17%
 24%
 32% 32%
 36%
 48%
 60%

 99% 97% 100% 99% 100% 99% 100% 98%
 96% 94% 94% 95% 92% 92% 94% 93%
 92%
 82% 83%
 76%
 68% 68%
 64%
 52%
 40%

 AT BE BG HR CZ DK EE FI FR DE GR HU IT KS LV LT LU MK NL NO PL PT RO SK SI ES SE CH UK AVG

 PSO Non-PSO
 Note: „0%“-values are alw ays 0,000% (real 0)

A similar situation can be found on the demand side (measured in passenger-
km). 65% of all passenger-km were operated in the framework of PSO contracts.
In some countries, such as Czech Republic, France, Germany, Italy, Poland and
Spain, the share of PSO traffic on the supply side is bigger than on the demand
side. While the share of PSO services in the French passenger market reaches
68% in terms of train-km, it amounts to only 38% in passenger-km. This can be
explained by the fact that most of the non-PSO services have larger capacities
than the regional PSO services. It may also reflect higher occupation rates on the
non-PSO market than on the PSO market. In Germany, the high share of PSO
train-km (82%) is driven by the high amount of regional traffic operated under
PSO, whereas non-PSO traffic is predominantly long-distance services, which is
lower in number. Furthermore, long-distance trains carry more than three times
as many passengers as regional trains, leading to a notably higher non-PSO
share based on passenger-km (41%).

13
 In Slovenia, for instance, the longest line do not exceed 393 km.

 27
Figure 18 – Share of PSO and non-PSO services (based on passenger-km) in 2017 14

 1% 0,1% 1% 1% 1%
 5% 3% 2% 4%
 6% 7% 7% 11%
 16%

 32% 32% 35%
 41% 42%
 48% 48%
 57%
 62%

 99% 99,9% 100%100% 99% 99% 99% 98%
 94% 95% 97% 93% 93% 96%
 89%
 84%

 68% 68% 65%
 59% 58%
 52% 52%
 43%
 38%

 AT BE BG HR CZ DK EE FI FR DE GR HU IT KS LV LT LU MK NL NO PL PT RO SK SI ES SE CH UK AVG

 PSO Non-PSO
 Note: „0%“-values are alw ays 0,000% (real 0)

 6.1. Rail passenger market size

Across the 28 countries considered, the load factor (passenger-km / train-km) in
2017 was 129 passenger-km per train-km 15. Load factor was above the average
value in France, Italy, Spain, Portugal and the Netherlands; these countries have
also shown the most notable increases compared with the previous two years.
 Figure 19 – Number of passenger-km per passenger train-km in 2017 16

14
 Note that in Luxembourg, the passenger-km data on the line Luxembourg-Paris is not available which
explains why the share of PSO traffic in this graph amounts to 100% while it amounts to 99% in the
share of PSO and non-PSO services based on train-km.
15
 Note that the load factor is different from the occupancy rate. Indeed, not only the occupancy rate
can impact the passenger load factor, but also the carrying capacities (number of seats per trains) for
instance.
16
 The average value in this graph differs from the one in the main report since the samples are
different: this one includes all the available data for 2017 while the one in the main report includes only
countries which provided data for the 2013-2017 period.

 28
In terms of passenger-km, Germany had the biggest market, followed by France,
the United Kingdom and Italy (Figure 20). Together, they represent 65% of the
market across all monitored countries. While overall passenger-km increased by
3.5% in comparison with 2016, Germany, the country with the biggest market
showed an increase of 2.7%. In France, a moderate growth of 7% was observed
between 2016 and 2017. This was mainly because there were several strikes in
2016 that lowered the railway traffic. However, in comparison to 2015 there was
still an increase between 2015 and 2017 as a result of the development of low-
cost offers and new high-speed lines.
 Figure 20 – Passenger transport in billion passenger-km in 2017

 Passenger traffic in billion passenger kilometres
 97,7
 92,4

 68,9
 51,6

 26,1
 20,9 20,2 19,5
 13,3 12,7 9,5
 7,7 6,6 5,7 4,4 4,3 3,9 3,6 1,4 1,2 0,7 0,7 0,6 0,4 0,4 0,4 0,1 0,01

 DE FR UK IT ES CH PL NL SE AT CZ HU DK RO PT FI SK NO BG GR HR SI LV LU LT EE MK KS

 22,8%
 Gains and losses compared to 2016

 13,6%
 10,4% 7,2% 5,9% 8,8%
 7,4% 7,0% 2,7% 2,3% 3,7% 3,5% 5,9%
 2,1% 3,0% 4,1% 3,5%
 0,6% 1,0% 0,3% 1,3%

 AT BE BG HR CZ DK EE FI FR DE GR HU IT KS LV LT LU MK NL NO PL PT RO SK SI ES SE CH UK Sum
 -1,4% -0,4% -5,9% -2,7% -4,4%
 -10,9%

 -22,3%

 -34,7%

Countries with large population and long railway network naturally show the
highest figures in terms of passenger transport (in passenger-km) and number of
passengers. However, considering population density and suitable timetabling,
Austria and Denmark show relatively high figures as well.
As would be expected from the passenger-km data, Germany had the highest
number of passengers in 2017 (Figure 21). This represents an increase of 3.8%
in comparison to 2016.

 29
Figure 21 – Passenger transport (in million passengers) in 2017 17

 6.2. Market shares of passenger railway undertakings

Across the monitored countries, domestic incumbents have a market share of
77% 18 in terms of passenger-km. The only countries where the market share of
domestic incumbents was below the average are Sweden, Poland and the United
Kingdom. In the United Kingdom, the domestic incumbent accounts only for 1%
of the market 19 and the share of the foreign incumbent is about 40%. In Sweden,
the main reason for the drop in the market share of the domestic incumbent is
that other railway undertakings have won competitive tenders in regional PSO-
traffic. Most recently the incumbent lost the contract for the commuter services in
the Stockholm area (which explains the extent of the drop in 2017). In Poland, a
higher market share of new entrants is due to the fact that regional services are
operated by new regional companies formed by regional authorities (22% market
share) and by Przewozy Regionalne (also 22% market share), a company that
stems from the incumbent, but was municipalised by regional authorities in 2008.
In 2015 the state bought package control in Przewozy Regionalne, but the
company does not have ownership relations with the incumbent.

17
 Note that the number of passengers was optional data and therefore not available in all the countries.
18
 The average value in this graph differs from the one in the main report since the samples are
different: this one includes all the available data for 2017 while the one in the main report includes only
countries which provided data for the 2013-2017 period.
19
 The domestic incumbent in UK, NI Railways (Northern Ireland Railways) is the Northern Ireland
domestic incumbent, which runs on a network separate to the majority of the mainline railway in Great
Britain.

 30
Figure 22 – Market shares of passenger railway undertakings (based on passenger-km) in 2017

 5% 0,1% 5% 3% 0,3% 4%
 7%
 12% 12% 8% 0% 0% 5% 10% 8% 10% 0%
 12% 0% 12% 15%
 18% 0% 0% 17%
 0,1% 8% 0,2% 1% 0%
 8%
 43%

 27% 60%

 0,5%
 100%100% 100%100% 100% 100%100%100% 100%100%
 95% 95% 97% 93% 95% 92% 90% 96%
 88% 88% 88% 89% 88%
 82% 84%
 77%

 57% 56%

 40%

 1%
 AT BE BG HR CZ DK EE FI FR DE GR HU IT KS LV LT LU MK NL NO PL PT RO SK SI ES SE CH UK AVG

 Domestic Incumbent Foreign Incumbent Non-Incumbent
 Note: „0%“-values are alw ays 0,000% (real 0)

The market share of domestic incumbents in terms of offered passenger train-km
was 71% across monitored countries (Figure 23). With the exception of a few
countries, such as the United Kingdom, Sweden, Poland, Denmark, Switzerland
and Germany, domestic incumbents still dominate most markets. In ten countries
there is no competition at all.
 Figure 23 – Market shares of passenger railway undertakings (based on train-km) in 2017

 1% 0,1% 1%
 6% 6% 6% 9% 6% 6% 7%
 13% 3% 16% 13% 17%
 0,2% 15% 17% 17%
 0,4% 30% 1% 28%

 12% 42% 11%
 59% 27%

 96% 100% 100% 94% 100% 100%
 94% 94% 90%
 100%
 94%
 100% 100% 100%
 94% 93%
 100% 100%
 87% 84% 86% 1% 83%
 70% 72% 72% 71%
 56% 46%
 40%

 1%
 AT BE BG HR CZ DK EE FI FR DE GR HU IT KS LV LT LU MK NL NO PL PT RO SK SI ES SE CH UK AVG

 Domestic Incumbent Foreign Incumbent Non-Incumbent

 6.3. Economic performance of passenger railway undertakings

Across the monitored countries the revenue of passenger railway undertakings
was 19.37 Euro per train-km and 13.96 Eurocent per passenger-km in 2017. 20
The highest unit revenues on the supply side (Euro per train-km) occur in France,

20
 The average value in this graph differs from the one in the main report since the samples are
different: this one includes all the available data for 2017 while the one in the main report includes only
countries which provided data for the 2013-2017 period.

 31
Luxembourg and the United Kingdom, while the highest unit revenue on the
demand side (Eurocent per passenger-km) was reported for Luxembourg.
 Figure 24 – Passenger operators' revenues
 (in passenger-km and in passenger train-km) in 2017

 In Euro per passenger train-km
 33,77

 25,00
 23,16
 19,92 19,37
 16,67 18,00 17,83 18,03

 12,16 12,60 12,36
 11,08
 9,02 8,04
 6,83 7,50
 5,49 5,69
 3,28 4,03

 AT BE BG HR CZ DK EE FI FR DE GR HU IT KS LV LT LU MK NL NO PL PT RO SK SI ES SE CH UK AVG

 In Eurocent per passenger-km
 44,38

 17,08 17,93
 15,09 14,88 15,34 13,70 13,96
 12,50 12,34 12,41 11,6411,48
 8,28 9,65 9,57 9,78
 5,94 5,93 6,35
 3,53

 AT BE BG HR CZ DK EE FI FR DE GR HU IT KS LV LT LU MK NL NO PL PT RO SK SI ES SE CH UK AVG

Considering only takings from fares, the revenue among the monitored countries
was 10 Eurocent per passenger-km (Figure 25). The highest unit revenues
(18.3 Eurocent per passenger-km) were found in the United Kingdom.
 Figure 25 – Passenger operators' revenues from fares
 (in Eurocent per passenger-km) in 2017

 18,3

 13,0
 11,0
 9,2 9,3 10,0
 7,9 8,3
 7,3
 5,9 6,3
 4,5 5,3 5,4 4,7
 4,5
 2,7 2,9
 1,7

 AT BE BG HR CZ DK EE FI FR DE GR HU IT KS LV LT LU MK NL NO PL PT RO SK SI ES SE CH UK AVG

In 2017 71% of all revenues for passenger services were collected from fares.
Comparing the different countries, large differences can be seen in the
distribution between revenues from fares and from compensations. In some
countries, such as Bulgaria and Luxembourg, the majority of revenues are from
public compensations (80% and 87%, respectively). Conversely, in the UK the
government received a net contribution from railway undertakings (i.e. PSO rail
operators paid more to the government in premiums than they received in

 32
compensation). This gives the impression in Figure 26 that in the UK fares make
up greater than 100% of the total revenue.
 Figure 26 – Share of passenger operators' revenues from fares and compensations in 2017

 5% 1%
 10%
 23% 28% 29%
 38% 40% 45% 41% 36%
 48% 51% 52%
 64% 64%
 80%
 87%
 95% 99% 102%
 90%
 77% 72% 71%
 62% 60% 55% 59% 64%
 52% 49% 48%
 36% 36%
 20%
 13%
 -2%
 AT BE BG HR CZ DK EE FI FR DE GR HU IT KS LV LT LU MK NL NO PL PT RO SK SI ES SE CH UK AVG
 Fares Compensations

As mentioned in Figure 18, 65% of all passenger-km were operated in the
framework of PSO contracts in 2017. Figures 27 and 28 repeat the analysis
presented in Figures 25 and 26 for PSO operators’ revenue only. The PSO
revenue per passenger-km across monitored countries was 9.25 Eurocent. This
is slightly lower than the figure for all passenger operators (10 Eurocent per
passenger-km). The highest unit revenue for PSO operators was reported for the
United Kingdom (16.69 Eurocent per passenger-km), while two countries show
passenger PSO operators’ revenues of less than 2 Eurocent per passenger-km
(Bulgaria and Hungary).
 Figure 27 – Passenger PSO operators' revenues from fares (in Eurocent per passenger-km) in 2017

 16,69
 14,32
 13,11

 8,53 9,25
 7,21 7,69 7,16 6,68
 5,92 6,09
 5,28
 4,53 3,83 4,15
 3,60 3,43 3,51 3,63
 1,83 2,36
 1,55

 AT BE BG HR CZ DK EE FI FR DE GR HU IT KS LV LT LU MK NL NO PL PT RO SK SI ES SE CH UK AVG

Across the monitored countries 42% of PSO revenues arise from compensation,
which is, as expected, higher than in the overall passenger market (29% of total
operators’ revenues). In all countries the share of PSO operators’ revenues from
compensations is higher than in the total passenger market (Figure 26).
 Figure 28 – Share of passenger PSO operators' revenues from fares and compensations in 2017

 5% 2%
 19%
 31%
 42% 41% 42%
 60% 60% 54% 55% 53% 62% 59% 59% 54%
 64% 64% 68% 71%
 82% 87%
 95% 98% 102%
 81%
 69%
 58% 59% 58%
 40% 40% 46% 45% 47% 38% 41% 41% 46%
 36% 36% 32% 29%
 18% 13%
 -2%
 AT BE BG HR CZ DK EE FI FR DE GR HU IT KS LV LT LU MK NL NO PL PT RO SK SI ES SE CH UK AVG
 Fares Compensations

 33
07
 Competition for the
 passenger market with
focus on the procedures
 for award of public
 service contracts
7. Competition for the passenger market with focus on the
 procedures for award of public service contracts

In order to complete the information provided in the main document of the seventh
report, this chapter provides details for each country, on the direct as well as on
the tendering procedures for award of PSO contracts for regional and long-
distance passenger services.
The information comes from the data collected via a questionnaire sent to
regulatory bodies. 21

Austria
Regional
One directly awarded PSO contract has been attributed to the incumbent operator
(ÖBB Personenverkehr) by the state authority, for a period of ten years. This
contract represents around three million train-km. So far there have been no
competitive tenders in Austria. Most of the current PSO contracts cover a period
from 2010 to December 2019. The PSO contract for Vorarlberg has been
renewed whilst the contracts for other regions are still being negotiated with the
incumbent. Direct award is used for all regional services.
Long-distance
Direct award is also used for the majority of long distance services except for
lines where there is open access competition.

Belgium
Regional
The domestic passenger rail market is not open to competition. Thus, the
incumbent operator - Société Nationale des Chemins de Fer Belge (NMBS-
SNCB) is the only railway undertaking in the market. Currently, there is no new
management contract. The previous one was legally extended for four additional
years, until the new contract enters into force. The current public service contract
was directly awarded to the incumbent operator in 2008. Regional, local and long-
distance traffic are considered as public service transport.
Long-distance
A PSO contract was directly awarded to the incumbent operator, NMBS-SNCB,
to cover national passenger services for a four-year period.

21
 See the Main Report, part 7.2. for details on the methodology used.

 35
Bulgaria
Regional
There is currently only one operator responsible for the public passenger railway
traffic. The Ministry of Transport, responsible to manage the public transport
service, has launched a tendering procedure for the provision of PSO services.
The Ministry drafts the contract and the operator has to adhere to it, without any
negotiations between the parties.
Long-distance
No long-distance PSO contract was directly awarded to railway undertakings,
with active services in 2017, nor has it been tender awarded any PSO contract to
railway undertakings with services commemced between 2013 – 2017.

Croatia
No distinction between Regional and Long-distance
Public transport services are centrally organised by the Ministry of the Sea. For
the time being, there is only one operator of PSO rail passenger services in
Croatia, HZ Putnički prijevoz d.o.o. (HZ Passengers). The PSO contract is de
facto awarded directly to the incumbent operator. Domestic railway passenger
transport in Croatia has not been liberalized yet.

Czech Republic
Regional
Contracts for PSO passenger rail services are awarded either directly or through
competitive tendering. The oldest contracts have a duration of ten years, but more
recent ones have a maximum duration of 15 years. One regional PSO contract
of around 829 million train-km has been awarded to the incumbent covering all
the territory.Three contracts have been granted to other railway undertakings for
certain regions. Two of these contracts represent around 4 million train-km, the
other covers four specific lines.
Concerning the PSO contracts awarded via competitive tenders, only one
contract had three bidders; including one from. the incumbent operator. The PSO
contract, awarded to another railway undertaking covers approximately 20 million
train-km. In both cases, whether contracts were awarded directly or via a public
tender, the contracting authority was a regional authority. 22
Long-distance
The long-distance services are granted to the incumbent operator, Czech
Railways, through a directly awarded PSC for a duration of ten years. In addition,
a public tender process was launched with five bidders interested, one of them
being the incumbent operator. However, GW Train Regio a.s. won the PSC,

22
 There are 14 regions (including the city of Prague), concerning the regional transport services.

 36
which has a duration of ten years as well. For both processes the contracting
authority is the state, the Ministry of Transport.

Denmark
Regional
There has not been any competitive tendering procedures in the period of 2013-
2017. The PSO contracts were negotiated between the Danish State and the
relevant railway undertaking before 2013. After these negotiations, the PSO
contracts were extended. The duration of PSC varies from eight to ten years. A
directly awarded contract was given to the Danish incumbent (DSB) for the period
from January 2015 until December 2024.
Long distance
A PSO contract was directly awarded. The Danish incumbent, DSB, is the only
RU, which has a PSO contract for long distance. The duration is the same as for
regional distance, 10 years. The awarding authority is the State. In this case “long
distance” is defined as the routes passing the Great Belt (the sea between the
two major islands Zealand and Funen) from Copenhagen to 3 different major
cities in Jutland (Esbjerg, AArhus and Aalborg).

Estonia
Regional
Although the market is fully open to competition, no one has been willing to enter
the market, given its small size. The state-owned company, AS Eesti Liinirongid,
operates passenger services under a PSC. This contract was established
between the Ministry and the incumbent and was negotiated by the parties. The
current PSC has a duration of five years. For the time being no decision has been
made on the need and possibility and to extend the duration of the contract.
Long-distance
No long-distance PSO contract was directly awarded to railway undertakings,
with active services in 2017, nor has it been tender awarded any PSO contract to
railway undertakings with services commemced between 2013 – 2017.

Finland
Regional
The competent authorities, the Ministry of Transport and Communications and
the Helsinki Regional Transport Authority, have concluded agreements with the
incumbent railway undertaking VR Group. The VR Group will providecommuter
rail services in Helsinki region until 2021 and in other regional areas until the end
of 2019. Long distance

 37
You can also read


