Universal Child Benefits: transforming the lives of children across South Asia - Stephen Kidd, Diloá Athias and Anh Tran Working Paper March 2021 ...
←
→
Page content transcription
If your browser does not render page correctly, please read the page content below
Universal Child Benefits: transforming
the lives of children across South Asia
Stephen Kidd, Diloá Athias and Anh Tran

Working Paper
March 2021
UNICEF REGIONAL OFFICE FOR SOUTH ASIA

Universal Child Benefits: a proposal to transform the lives of children across South
Asia

Working Paper

© United Nations Children’s Fund (UNICEF) March 2021

Readers citing this document are suggested to use the following text: Stephen Kidd, Diloá Athias and Anh Tran
(2021), ‘Universal Child Benefits: a proposal to transform the lives of children across South Asia’. UNICEF
Regional Office for South Asia Working Paper No. 2021-01. Kathmandu, UNICEF South Asia.

UNICEF Regional Office for South Asia (ROSA)
Lekhnath Marg, Lainchaur
Kathmandu, Nepal
www.unicef.org/rosa

Design: Anh Tran and India Fallon

Cover photograph credit: Ó UNICEF/Thomas Nybo

This is a working document intended to facilitate the exchange of knowledge and to stimulate discussion. The
publication was prepared for UNICEF by a team from Development Pathways - including Stephen Kidd, Diloá
Athias and Anh Tran – with technical supervision from Abdul Alim, Regional Social Policy Adviser from UNICEF
ROSA.

This publication was produced with financial support of the Government of Japan. The findings, interpretations
and conclusions expressed in this paper are those of Development Pathways and do not necessarily reflect the
policies or views of the Government of Japan, UNICEF and of the United Nations. The text has not been edited
to official publication standards, and UNICEF accepts no responsibility for errors. The designations in this
publication do not imply an opinion on legal status of any country or territory, or of its authorities, or the
delimitation of frontiers.

Permission is required to reproduce any part of this publication: All images and illustrations used in this
publication are intended for informational purposes only and must be used only in reference to this publication
and its content. All photos are used for illustrative purposes only. UNICEF photographs are copyrighted and may
not be used for an individual’s or organization’s own promotional activities or in any commercial context. The
content cannot be digitally altered to change meaning or context. All reproductions of non-brand content MUST
be credited, as follows: Photographs: “© UNICEF /photographer’s last name”. Assets not credited are not
authorized. Thank you for supporting UNICEF.

This report, additional online content and corrigenda are available at https://www.unicef.org/rosa/social-inclusion-
and-policy
Universal Child Benefits: a proposal to
transform the lives of children across
              South Asia
               Working Paper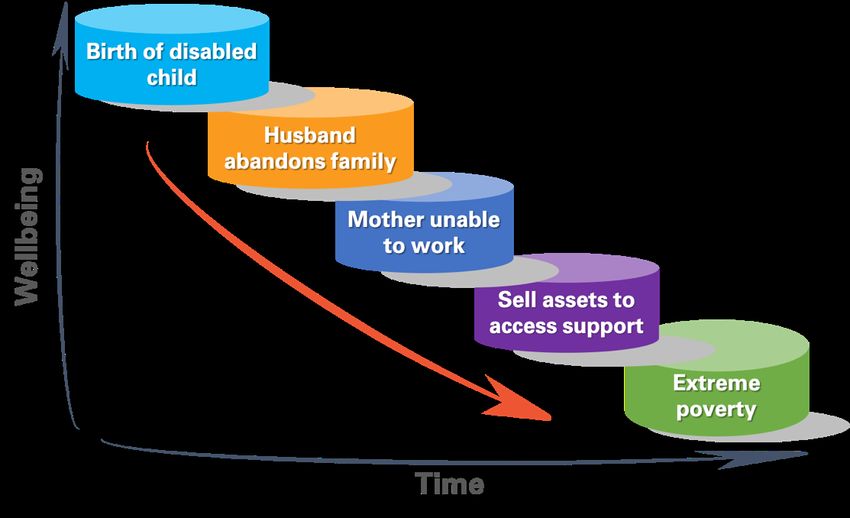
Summary

Summary
Across South Asia, children are largely excluded from national social security systems. As a
result, families are unable to adequately support the development of their children and are
vulnerable to the daily crises that threaten to undermine their standards of living. Indeed,
most families in South Asia have been unable to weather the shock of the COVID-19 crisis,
which has resulted in a significant deterioration in child wellbeing through the region and
threatens to reverse many of the gains made in growth and prosperity during recent years.
Countries in South Asia risk undermining their economies if they do not invest in children. If
the health, nutrition and learning of children is to be enhanced, it is critical that an
imaginative solution is found to the challenge of widespread low incomes.

This paper presents analysis that demonstrates the urgency of all countries in South Asia to
invest in social security for children, in line with the Convention on the Rights of the Child. It
presents options for Universal Child Benefits (UCBs) across Bangladesh, India, Maldives,
Nepal, Pakistan and Sri Lanka, with simulations of their potential costs, coverage and
impacts on poverty and consumption. While the best UCB option would be to offer it
immediately to all children (0-17 years), this is unlikely to happen due to concerns about
fiscal space. However, a feasible approach would be to introduce a UCB initially at a
relatively low cost, by providing a benefit to the youngest children, with the age of eligibility
expanding over time: no child would be taken off the scheme until they reach their 18th
birthday. This paper presents three options based on different eligibility ages in the first year
of implementation: 0-2 years, 0-5 years, and 0-9 years.

This paper shows that it is possible for all governments in South Asia to introduce a UCB
immediately. The impacts on child wellbeing would be significant amongst the poorest
families but also among those on middle with low and insecure incomes. In all countries,
the UCBs would reach a high proportion of the population – either as direct or indirect
recipients – given that children are found in most households. This would vastly improve
food security among recipient households and have significant impacts on national child
poverty, while reducing inequality across the region. If families spent the benefit only on
children, this could make a major difference to their lives, improving their nutrition and
enabling families to invest in other activities that are conducive to children’s learning,
including their home environment, thereby enhancing educational outcomes.

                                                                                                    i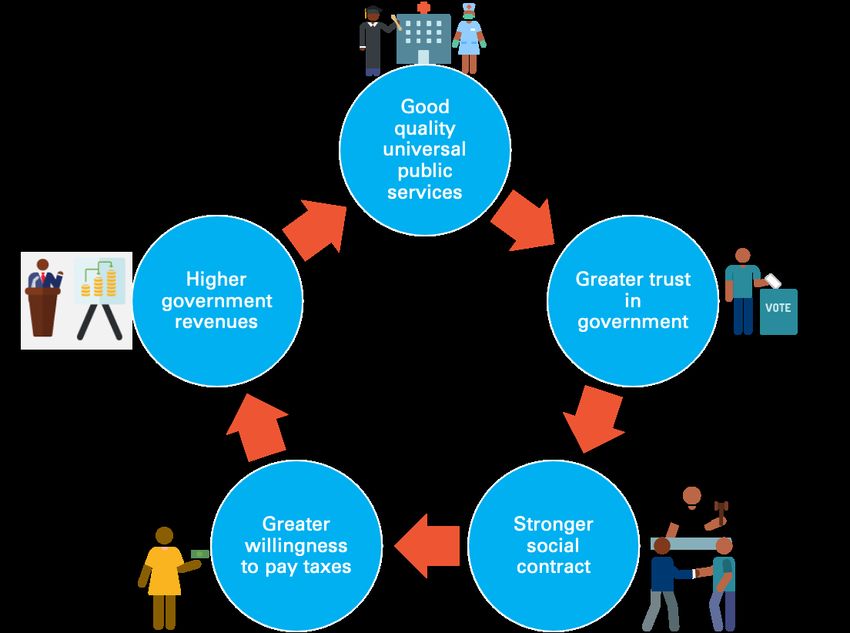
Summary

The COVID-19 crisis makes it vitally important for countries to find the fiscal space to invest
in UCBs, as it would support both economic recovery and provide essential financial
assistance to families across South Asia. For countries with relatively low gross debt, such
as Bangladesh and Nepal, borrowing to finance a UCB could be a sensible investment,
given the benefits that countries would derive from its implementation. Furthermore, if
countries borrowed to fund the first year of the UCB implementation, increase in gross debt
would be negligible (without significantly worsening countries’ finances or debt servicing
requirements) and the economy would be boosted as consumption increases.

The benefits of a UCB would go beyond those directly experienced by children in the short-
term. Its introduction would provide a short and long-term boost to national economies and
the national level impact will be the strengthening of national social contracts. Given that
most households will begin to receive cash on a regular and predictable basis, their trust in
government will grow. As has happened elsewhere, this should result in a stronger social
contract which, over time, is likely to encourage citizens to pay higher taxes. As government
revenues grow, they will be able to increase their investment in all public services, in
particular in health and education.

                                                                                                ii
Contents
Contents
Summary ............................................................................................................................................ i
Acronyms ........................................................................................................................................... iii
1 Introduction ........................................................................................................................ 1
2 The rationale for Universal Child Benefits in South Asia .................................................... 4
2.1 Challenges faced by children across South Asia .................................................................... 4
2.1.1 Low incomes among South Asia’s children ................................................................... 4
2.1.2 Nutrition among children ................................................................................................ 9
2.1.3 Child education and the home learning environment................................................... 15
2.1.4 Disability among children ............................................................................................. 18
2.1.5 Impacts of the COVID-19 crisis on children ................................................................. 19
2.2 The potential demographic dividend in South Asia .............................................................. 21
2.3 Inequality across South Asia ................................................................................................ 22
3 Effectiveness of South Asia’s social security systems in addressing the
challenges facing children .................................................................................................................... 24
4 Child benefits across the globe ........................................................................................ 28
5 Options for investing in UCBs in South Asia .................................................................... 33
5.1 Level of investment required for the UCB options .............................................................. 37
5.2 Coverage of households by the UCBs ................................................................................. 39
5.3 Impacts of the UCBs on poverty rates ................................................................................. 42
5.4 Increase in consumption among children ............................................................................ 44
5.5 Increase in household food consumption ............................................................................ 47
5.6 Reductions in inequality ....................................................................................................... 49
5.7 Overview of impacts of UCBs on children and society ........................................................ 50
6 Pathways for financing UCBs in South Asia..................................................................... 52
7 Conclusion........................................................................................................................ 58
Bibliography …………………………………………………………………………………………………….60
Annex 1 Methodology employed to simulate the potential impacts of introducing UCBs............. 65
Annex 1.1 Estimating the level of investment required ............................................................ 65
Annex 1.2 Simulated impacts .................................................................................................... 66
Annex 2 Different options of benefit value and age eligibility under a budget scenario of
0.5 per cent of GDP ............................................................................................................................. 69
Annex 3 Detailed costing of the UCBs for all options .................................................................... 70
Annex 4 Simulated impact indicators of the UCBs for all options .................................................. 72
Annex 4.1 Impacts of the UCBs on poverty rates ..................................................................... 72
Annex 4.2 Increase in consumption by children ........................................................................ 74
Annex 4.3 Increase in household food consumption ................................................................ 75
Annex 4.4 Reductions in inequality ........................................................................................... 76
iiiAcronyms
Acronyms
4P Pantawid Pamilyang Pilipino Program (The Philippines)
ADB Asian Development Bank
AHS Annual Household Survey (Nepal)
BDT Bangladeshi Taka
BF Bolsa Família (Brazil)
BISP Benazir Income Support Programme (Pakistan)
CA Childcare Allowance (Uzbekistan)
CGE Computable General Equilibrium
COVID-19 2019 Novel Coronavirus Disease
CRC Convention on the Rights of the Child
CSO Central Statistics Organisation (Afghanistan)
DA Disability Allowance (Sri Lanka)
DFID Department for International Development
FA Family Allowance (Uzbekistan)
GDP Gross Domestic Product
HIICS Household Integrated Income and Consumption Survey (Pakistan)
HIES Household Income and Expenditure Survey (Bangladesh, Maldives, Sri
Lanka)
ICF Inner City Fund (ICF International Inc.)
IHDS India Human Development Survey
IIPS International Institute for Population Sciences (India)
IPC-IG International Policy Centre for Inclusive Growth
ILO International Labour Organization
IMF International Monetary Fund
INR Indian Rupee
LKR Sri Lankan Rupee
MBS Mi Bono Seguro (Guatemala)
MOH Ministry of Health
MoHFW Ministry of Health and Family Welfare (India)
MVR Maldivian Rufiyaa
NCD Non-Communicable Disease
NFHS National Family Health Survey (India)
ivAcronyms
NIPORT National Institute of Population Research and Training (Bangladesh)
NIPS National Institute of Population Studies (Pakistan)
NPR Nepalese Rupee
NREGA Mahatma Gandhi National Rural Employment Guarantee Act (India)
NSAP National Social Assistance Program (India)
NSER National Socio-Economic Register (Pakistan)
NSIA National Statistics and Information Authority (Afghanistan)
Nu. Bhutanese Ngultrum
OAP Old Age Pension (Bangladesh)
OAA Old Age Allowance (Sri Lanka)
ODI Overseas Development Institute
OECD Organisation for Economic Co-operation and Development
OPHI Oxford Poverty and Human Development Initiative
PESP Primary Education Stipend Project (Bangladesh)
PKH Program Keluarga Harapan (Indonesia)
PKR Pakistani Rupee
PPP Purchasing Power Parity
Rs. Indian/Pakistani Rupee
SDG Sustainable Development Goal
SESP Secondary Education Stipend Project (Bangladesh)
Tk. Bangladeshi Taka
UCB Universal Child Benefit
UDHR Universal Declaration of Human Rights
UNDESA United Nations Department of Economic and Social Affairs
UNESCO United Nations Educational, Scientific and Cultural Organization
UNICEF United Nations International Children's Fund
US$ United States Dollar
WEO IMF World Economic Outlook (database)
WFP World Food Program
WHO World Health Organization
v1 Introduction
1 Introduction
In the 21st century all children should be given the opportunity to flourish and no child should
grow up hungry. Yet, in too many countries children do not benefit from a healthy diet, good
quality education and a protective, caring home environment. In 1948, nations came
together and agreed the Universal Declaration of Human Rights which stated: ‘Motherhood
and childhood are entitled to special care and assistance. All children, whether born in or out
of wedlock, shall enjoy the same social protection.1’ Over 70 years later, much still needs to
be done to ensure that all children benefit from every right to which they are entitled.
It also makes economic sense for countries to invest in their children. Countries depend on
a healthy population and skilled workforce to be competitive in global markets and achieve
sustainable economic growth. Investments in children, through public services such as
health, education and social security, enable children to maximise their potential in
education and the labour market. Indeed, as Figure 1-1 indicates, if countries wish to
achieve good education and health outcomes among children, they must also invest in
social protection, including both social security and social services. While it is essential to
ensure free access for all children to high quality schooling and health services, this alone
will not achieve adequate health and education outcomes if families lack sufficient income
to invest in their children’s wellbeing. The poor diets experienced by many children globally
undermine both their health and education and in addition, if parents are too poor to offer
their children time and attention – as well as activities to stimulate their minds alongside a
peaceful home environment – child development will be hindered. The most vulnerable
children – in particular those with disabilities – also require additional support from social
services, including trained social workers.
1
United Nations (1948).
11 Introduction
Figure 1-1: Investments by government in core public services to achieve health,
nutritional and education outcomes among children
Source: Development Pathways
There exists a wide body of evidence on the positive impacts of social security and higher
incomes on child development. Indeed, the Convention on the Rights of the Child (CRC) has
stated clearly, in Article 26, that it is the right of every child to access social security while
Article 6 sets out that: “States Parties shall ensure to the maximum extent possible the
survival and development of the child.”2 So, when families are unable to obtain sufficient
income from the fruits of their labour to provide their children with an adequate standard of
living – another basis human right which is stipulated in Article 27 of the CRC – it is the
obligation of the state to step in and offer families additional income from social security.3
One of the most effective means of supplementing family incomes to underpin an adequate
standard of living is through child benefits, which enable the State to provide parents (or
caregivers) with a regular and predictable cash income to invest in and care for their
children. The only way of guaranteeing that all children are reached, including the poorest, is
through a Universal Child Benefit (UCB). Children with disabilities, who face the greatest
challenges, should also be able to access Universal Child Disability Benefits.
2
UNICEF (1989).
3
UNICEF (1989).
21 Introduction
However, as this paper will show, across South Asia most children and their families are
unable to access any form of social security, despite the vast majority living on low and
insecure incomes. As a result, families are unable to adequately support the development of
their children and are vulnerable to the daily crises that threaten to undermine their
standards of living, never mind large-scale shocks affecting whole regions or nations.
Indeed, most families across South Asia have been unable to weather the shock of the
COVID-19 crisis, which has further undermined child wellbeing.
Building on a previous paper published by the UNICEF Regional Office for South Asia which
built the case for emergency UCBs during the COVID-19 crisis,4 this paper presents analysis
to demonstrate the urgency of all countries in South Asia to invest in social security for
children, in particular through UCBs. Section 2 examines the rationale for UCBs in South
Asia, focusing on the challenges faced by children and their families. Section 3 looks at the
extent to which children can access current social security systems in the region while
Section 4 briefly summarises the global experience with UCBs, following their first use by a
country in 1944. Evidence on the potential costs and impacts of UCBs on South Asia’s
children are presented in Section 5, while Section 6 considers how the fiscal space can be
found for their introduction. Section 7 concludes the report.
4
See Kidd, Athias, et al. (2020), available at: https://www.developmentpathways.co.uk/publications/emergency-universal-child-
benefits-addressing-the-social-and-economic-consequences-of-the-covid-19-crisis-in-south-asia/.
32 The rationale for Universal Child Benefits in South Asia
2 The rationale for Universal Child Benefits in
South Asia
There are around 600 million children in South Asia, most of whom live in families struggling
to give them the upbringing they deserve.5 This section examines the rationale for investing
in UCBs across the region, focusing on the challenges experienced by children across South
Asia and the potential demographic dividend that could be achieved if governments were to
allocate adequate resources to the region’s children.
2.1 Challenges faced by children across South Asia
This section examines the challenges of low incomes, undernutrition and poor health, as
well as inadequate educational outcomes experienced by the children of South Asia. It also
considers the specific challenges faced by children with disabilities.
2.1.1 Low incomes among South Asia’s children
In recent decades, South Asian countries have made good progress in tackling extreme
poverty. Figure 2-1 uses the international US$3.20 per day poverty line, in purchasing power
parity (PPP) terms, to show poverty rates since the early 1980s across most of the
countries in South Asia. In all countries, there has been a positive downward trend, which
means that the lives of many children have improved . Nonetheless, it is noticeable that
Bangladesh, India and Nepal have not yet reached the level that Sri Lanka was at in 1985.
5
UNICEF (2020).
42 The rationale for Universal Child Benefits in South Asia
Figure 2-1: Changes in poverty rates across South Asia by year, using the US$3.20 (PPP)
poverty rate
Bangladesh Bhutan India Maldives Nepal Pakistan Sri Lanka
Poverty rate, based on $3.20 PPP poverty line
100%
90%
80%
70%
60%
50%
40%
30%
20%
10%
0%
1983
1984
1985
1986
1987
1988
1989
1990
1991
1992
1993
1994
1995
1996
1997
1998
1999
2000
2001
2002
2003
2004
2005
2006
2007
2008
2009
2010
2011
2012
2013
2014
2015
2016
2017
Source: World Bank Povcalnet, available at: http://iresearch.worldbank.org/PovcalNet/.
Despite this encouraging progress, the vast majority of children in South Asia are still being
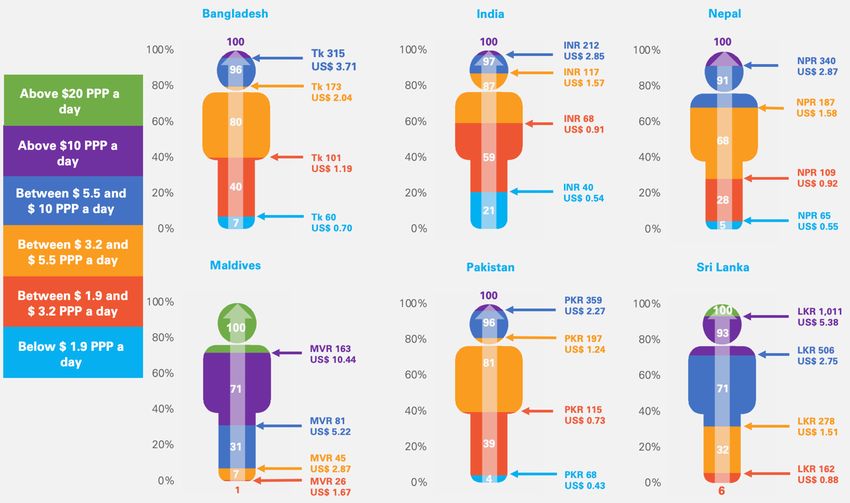
raised by families living on low incomes. As Figure 2-2 shows, across almost all countries,
most children are living under US$5.50 per day when measured in terms of purchasing
power parity (PPP). While this may seem relatively high, when it is translated into national
currencies and actual dollars, it seems a lot less. For example, in India, 90 per cent of
children live on less than US$1.57 (INR117) per day, in Bangladesh, 80 per cent live on less
than US$2.04 (Tk173) per day, and in Sri Lanka, 75 per cent live on less than US$2.87
(LKR506) per day (which, in the case of the latter, is the equivalent of US$10 PPP). Most
children live with families who are in precarious employment in the informal or subsistence
economies, resulting in incomes that are low and highly insecure. As will be discussed
below, these incomes have fallen considerably during 2020 as a result of COVID-19.
52 The rationale for Universal Child Benefits in South Asia
Figure 2-2: Proportion of children living under different levels of per capita consumption
6
across a selection of countries in South Asia
Source: Own calculations based on Bangladesh HIES 2016, India IHDS-II, Maldives HIES 2016, Nepal AHS 2014/15, Pakistan
HIICS 2015/16 and Sri Lanka HIES 2016.
Another way of looking at the challenge of widespread low incomes across South Asia is to
compare those considered to be the region’s richest families with the poorest families in
high-income countries, such as the United States. Figure 2-3 indicates the per capita daily
consumption in purchasing power parity (PPP) dollars of those who were living on the 75th
percentile across seven countries in South Asia prior to COVID-19, comparing it to the per
capita daily consumption at the 10th lowest percentile in the United States, which is around
US$20 PPP. It shows that the vast majority of the population in South Asia is living on much
less – in comparable living standards terms – than the very poorest families in the United
States. Yet, it is widely recognised that the poorest families in the USA are in desperate
need of social security.
6
Different thresholds are used to assess the proportion of children living under different levels of per capita consumption in
the Maldives and Sri Lanka, starting from $3.20 PPP and $20.00 PPP, in comparison to the other countries in the region where
the proportion living above $20.00 PPP is too small to include.
62 The rationale for Universal Child Benefits in South Asia
Figure 2-3: Per capita daily consumption figures – in PPP dollars and nominal dollars (in
th
white text, within the bars) – for those at the 75 percentile of the population for
th
countries in South Asia, compared to the consumption of those at the 10 percentile in
the USA
25
US$ 12.15
In the USA, 10 per cent of the population live on less than US$20 (PPP) per person per day
20
US$ PPP
15
10 US$ 3.13
US$ 2.09
5 US$ 1.34 US$ 1.23 US$ 2.01
0
Maldives Sri Lanka Nepal India Pakistan Bangladesh
Source: Own calculations based on Bangladesh HIES 2016, India IHDS-II, Maldives HIES 2016, Nepal AHS 2014/15, Pakistan
HIICS 2015/16 and Sri Lanka HIES 2016.
A further indication of South Asia’s widespread low incomes is the proportion of overall
expenditure that households consume on food. In most high-income countries, households
spend, on average, less than 15 per cent of their income on food. Yet, across South Asia,
the proportion is much higher among households with children: it is 48 percent in
Bangladesh, 43 per cent in India, 25 per cent in the Maldives, 62 per cent in Nepal, 30 per
cent in Pakistan and 39 per cent in Sri Lanka. Further, as Figure 2-4 indicates, it is only
among the richest 10 per cent of the population that the proportion comprising food
expenditure falls although, even then, it is still much greater than in high-income countries,
indicating that it would be premature to refer to everyone in this group as ‘rich.’ Among
those in the poorest half of the population in Bangladesh, India, Nepal, Pakistan and Sri
Lanka, food consumption is above 50 per cent of household expenditures. As a result,
families have little available to invest in their children beyond basic (and often inadequate)
nutrition.
72 The rationale for Universal Child Benefits in South Asia
Figure 2-4: The proportion of total consumption spent on food across households with
children, by welfare deciles
80%
70% 70 70
67 67 68 66
66
61 60 63 60 62
Proportion of total consumption
60%
59 59 58 57 55 54 59
57
55 54 57 54 53 54
53 55 52 51 51 52 Bangladesh
50% 50 50
49 48 47 47 46
46 44 India
44 43
40% 39 40 Maldives
35 37 35 37
35 35
33 33 Nepal
30% 28 27 28
25 24 Pakistan
24
20% 20 Sri Lanka
10%
0%
Lowest 2nd 3rd 4th 5th 6th 7th 8th 9th Highest
Welfare deciles
Source: Own calculations based on Bangladesh HIES 2016, India IHDS-II, Maldives HIES 2016, Nepal AHS 2014/15, Pakistan
HIICS 2015/16 and Sri Lanka HIES 2016.
A particular challenge facing girls in South Asia – although one that is rarely discussed – is
access to adequate menstrual protection. In India, for example, 42 per cent of girls aged 15-
19 years do not use hygienic menstrual protection, and the proportion may well be higher
among younger girls.7 This is likely due to the cost of purchasing menstrual protection, given
that there is a strong correlation between a higher rate of hygienic menstrual protection and
greater wealth, as indicated by Figure 2-5. Among Indian families in the lowest wealth
quintile, nearly 80 per cent struggle to regularly purchase good quality sanitary products for
their daughters. Inadequate menstrual protection can also be a reason for girls not attending
school, so it is particularly important to address if they are to realise their full potential. One
answer is to increase family incomes through a UCB.
7
IIPS & ICF (2017)
82 The rationale for Universal Child Benefits in South Asia
Figure 2-5: Proportion of girls in India aged 15-19 years not using hygienic menstrual
protection, by welfare quintile
100%
hygienic menstrual protection
80%
Percentage not using
78.9
60%
58.7
40%
39.6
20%
23.8
0% 11.2
Lowest Quintile 2 Quintile 3 Quintile 4 Highest
Welfare quintile
Source: IIPS & ICF (2017)
2.1.2 Nutrition among children
It is well-established that the first 1,000 days of life (roughly between conception and the
second birthday) are critical to a child’s development.8 It is a unique window of opportunity
when the foundations of optimum health, growth, and brain development across the
lifespan are set. However, if, during this period, children suffer from poor nutrition, which
causes them to be stunted, research indicates that they may never fully recover and will
experience, on average, a 26 per cent reduction in lifetime earnings. In some contexts, this
can lead to a loss in gross domestic product (GDP) that is double what some countries
currently spend on healthcare.9 Other research has indicated that scaling up effective
interventions in early childhood development in countries across the Global South to
address malnutrition is likely to yield long-term benefits of US$3 for every US$1 invested.10
A UCB is a very effective means of tackling stunting.
Prior to COVID-19, children throughout the region were already facing the detrimental
effects of poor nutrition. A total of 7.7 million children below the age of 5 years in South
Asia suffered from severe wasting while 33 per cent, or 56 million, were stunted, with 40
million living in India (see Figure 2-6).11 As discussed in Section 2.1.5, the COVID-19 crisis
8
Cusick & Georgieff (n.d.)
9
Richter et al. (2017)
10
Fink et al (2016).
11
UNICEF (2020).
92 The rationale for Universal Child Benefits in South Asia
will likely lead to a significant further deterioration, with family incomes falling dramatically.
In Afghanistan, for example, the number of children experiencing severe wasting rose by 15
per cent during 2020.12
Figure 2-6: Percentage of children below the age of 5 years who are stunted, by country
45%
Proportion of children below the age of 5 years
40%
35% 38.2 37.6
35.8
34.7
33.5
30%
who are stunted
30.8
25%
20%
15% 17.3
15.3
10%
5%
0%
Afghanistan Bangladesh Bhutan India Maldives Nepal Pakistan Sri Lanka
Source: UNICEF Multiple Indicator Cluster Survey (Afghanistan, Bangladesh, Bhutan, India, Sri Lanka); MOH Nepal et al.
(2017); MOH Maldives & ICF (2018); and NIPS & ICF (2019)
It is important to note that stunting affects children across all economic classes, as shown
by Figure 2-7 which examines Bangladesh, India and Pakistan (and a similar pattern can be
found in other countries in the region). This is further evidence that incomes are low across
most families in South Asia and demonstrates the need to provide financial support, not just
to the poorest children, but to all children.
12
UNICEF (2020).
102 The rationale for Universal Child Benefits in South Asia
Figure 2-7: Stunting rates across the welfare distribution in Bangladesh, India and
Pakistan
60%
Percentage of children under age of 5 who
Bangladesh India Pakistan
50%
40%
are stunted
30%
20%
10%
0%
Lowest Second Middle Fourth Richest
Wealth quintiles
Source: UNICEF data, retrieved from: https://data.unicef.org/topic/nutrition/malnutrition/; MoHFW India et al. (2019); NIPORT &
ICF (2019); and NIPS & ICF (2019).
Similarly, micro-nutrient deficiencies can also damage child wellbeing and development. For
example, across six separate studies in low-income countries, infants with iron deficiency
anaemia were found to have mental capacity scores that were between 6-15 percentage
13
points lower than their non-iron-deficient peers. Across most countries in South Asia, on
any given day the majority of children do not consume foods rich in iron and, in some, the
proportion is particularly high: for example, in India, the proportion is 82 per cent of children
14
while in Afghanistan it is 70 per cent. Even in Sri Lanka, where incomes are higher, 41 per
cent of children each day are unable to consume sufficient iron. As Figure 2-8 shows, the
proportion of young children not consuming iron rich foods in the previous day does not
differ significantly across the welfare distribution, again potentially indicating the impact of
widespread low incomes. It is fair to assume that the impacts of low iron consumption on
child wellbeing and cognitive development across South Asia could be significant.
13
Walker et al. (2007).
14
CSO et al. (2017) and IIPS & ICF (2017).
112 The rationale for Universal Child Benefits in South Asia
Figure 2-8: Percentage of children aged 6-23 months who did not consume foods rich in
iron in last 24 hours, by country and wealth quintile
Afghanistan Bangladesh India Maldives Nepal Pakistan Sri Lanka
90%
85
Percentage of children age 6-23 months
80% 83 81 82
77 79
74 73 73
70% 71 70
68
66 63 64
60% 60 60 62
54 54
50% 51
47 46 47
44
40% 41 40
36 37
30% 30 32
28 26 25
20%
10%
0%
Lowest Second Middle Fourth Highest
Welfare quintiles
Source: NIPORT et al. (2016); CSO et al. (2017); IIPS & ICF (2017); MOH Nepal et al. (2017); MOH Sri Lanka & ICF International
(2017); MOH Maldives & ICF (2018); and, NIPS & ICF (2019).
Looking across countries in South Asia, it is possible to discern further potential evidence of
the link between family incomes and micro-nutrient deficiency. Figure 2-9 demonstrates a
strong correlation between daily per capita expenditures across South Asian countries at the
75th percentile – in nominal dollars – and the proportion of children not consuming iron-rich
foods in the previous 24 hours. There is a marked improvement when expenditures – and,
therefore, incomes – are higher.
Figure 2-9: Relationship between percentage of children aged 6-23 months who did not
consume foods rich in iron in the previous 24 hours, and the daily per capita consumption
th
of those living at the 75 percentile of the welfare distribution
Sources: NIPORT et al. (2016); IIPS & ICF (2017); MOH Nepal et al. (2017); MOH Sri Lanka & ICF International (2017); MOH
Maldives & ICF (2018); NIPS & ICF (2019); and World Bank Povcalnet, available at: http://iresearch.worldbank.org/PovcalNet/.
Note: Data is unavailable for Afghanistan and Bhutan.
122 The rationale for Universal Child Benefits in South Asia
Diet and nutrition play a key role in brain development throughout childhood, and not just in
the first years of life. Iron deficiency during school age has been linked with lower test
scores at school.15 Further, undernutrition in adolescence is associated with impaired
cognitive functioning, school absenteeism and psychological stress.16 As global expert Dr
Neville Golden has noted: “If [teens] don’t eat right, they can become irritable, depressed
[and] develop problems such as obesity and eating disorders – and those have a whole host
of psychological morbidities.”17
A good indication of how undernutrition continues throughout childhood in South Asia is in
the height of 19-year-olds. Figure 2-10 shows the average height of 19-year-olds across a
range of countries – the bottom 50 countries, plus a range of others for comparison – and
their global rankings, from tallest to shortest. All countries in South Asia are ranked in the
bottom fifty of countries worldwide, for both males and females. The shortest 19-year-olds
in the region are found in Nepal for males and Bangladesh for females. For example, a 19-
year-old male in Nepal is, on average, 19 centimetres shorter than a Dutch male of the
same age, while the difference is 18 centimetres among 19-year-old females from
Bangladesh. Of particular concern is the fact that, among girls, Nepal and Bangladesh are
ranked 2nd and 3rd lowest globally. Girls in South Asia are in a worse position than boys: the
th
average ranking, out of 200 countries, across South Asian countries for girls is 186 and for
th
boys it is 176 . The continuation of undernutrition throughout childhood among the majority
of children in South Asia will have negative consequences on their development. This could,
however, be addressed in part by access to a UCB.
15
Halterman et al. (2001); Otero et al. (1999); Walter (2003).
16
Belachew et al. (2011); Cusick & Kuch (2012); Patton et al. (2016); UNICEF (2019).
17
Dr Neville Golden, Chief of Adolescent Medicine at Stanford University School of Medicine, USA, quoted in Costa (2016).
132 The rationale for Universal Child Benefits in South Asia
Figure 2-10: Average heights of 19-year-old boys and girls across South Asia, with ranking
on the global scale between 0-200 (in white text, bars), in international comparison
Girls Boys
Netherlands 1 Netherlands 1
American Samoa 10 Slovenia 10
Sweden 20 Dominica 20
Greece 30 Canada 30
Australia 40 Romania 40
Senegal 50 Hungary 50
South Korea 60 Trinidad and Tobago 60
Brazil 70 Tonga 70
Turkey 80 Egypt 80
Portugal 90 Portugal 90
Taiwan 100 Venezuela 100
Namibia 110 Guyana 110
Zimbabwe 120 Syria 120
Kenya 130 Mongolia 130
Guinea 140 Mexico 140
Bahrain 150 Nauru 150
Panama 151 Swaziland 151
Nigeria 152 Malaysia 152
Tajikistan 153 Central African Rep 153
Belize 154 Viet Nam 154
Angola 155
Ethiopia 155
Equatorial Guinea 156
Uganda 156
Colombia 157
DR Congo 157
Mexico 158
Afghanistan 158
Nauru 159
Angola 159
Eritrea 160
Benin 160
Sierra Leone 161
Tajikistan 161
Zambia 162
Gambia 162
Ethiopia 163
Vanuatu 163
Malaysia 164
Papua New Guinea Cote d'Ivoire 164
165
Tanzania 166 Equatorial Guinea 165
Solomon Islands 167 Guinea Bissau 167
Lesotho 168 Sri Lanka 168
Rwanda 169 Lesotho 169
Liberia 170 Maldives 170
Comoros 171 Comoros 171
El Salvador 172 Zambia 172
DR Congo 173 Burundi 173
Malawi 174 Pakistan 174
Afghanistan 175 Ecuador 175
Sri Lanka 176 Bhutan 176
Nicaragua 177 Tanzania 177
Bolivia 178 Peru 178
Mozambique 179 Myanmar 179
Ecuador 180 India 180
Honduras 181 Sierra Leone 181
India 182 Brunei Darussalam 182
Bhutan 183 Indonesia 183
Burundi 184 Rwanda 184
Brunei Darussalam 185 Malawi 185
Pakistan 186 Mauritania 186
Marshall Islands 187 Liberia 187
Yemen 188 Cambodia 188
Cambodia 189 Marshall Islands 189
Myanmar 190 Phillippines 190
Peru 191 Madagascar 191
Indonesia 192 Bangladesh 192
Maldives 193 Yemen 193
Philippines 194
Nepal 194
Lao PDR 195
Guatemala 195
Madagascar 196
Mozambique 196
Timor-Leste 197
Papua New Guinea 197
Nepal 198
Solomon Islands 198
Bangladesh 199
Lao PDR 199
Guatemala 200
Timor-Leste 200
0 50 100 150 200
0 50 100 150 200
Mean height in cm
Mean height in cm
Source: https://www.ncdrisc.org/children-adolescent-bmi-height-media-link/height-mean-ranking.html
142 The rationale for Universal Child Benefits in South Asia
There is some concrete evidence on the impacts of low incomes and undernutrition on
educational outcomes among South Asia’s children. In Bangladesh and Pakistan, for
example, stunting and being underweight are associated with lower learning development.18
There is therefore an urgent need to address the challenge of low incomes in order to give
children in South Asia better life outcomes.
2.1.3 Child education and the home learning environment
In addition to enjoying adequate nutrition, children in South Asia need to develop the skills
they require for their future participation in the labour market. In addition to the impacts on
cognitive development resulting from poor nutrition, low incomes can impact on children’s
ability to gain these skills in at least two further ways: their families may not be able to
afford to send them to school; or, their home environment may not be conducive to
learning.
Across most of South Asia, primary school participation is high, although there are still some
children missing out: for example, in India, 6.4 per cent of boys aged 6-13 years are out of
school while the figure is 20 per cent in Nepal.19 A greater challenge comes when children
are of secondary school age. As Figure 2-11 indicates, in Afghanistan, India, Nepal and
Pakistan, the majority of teenagers are not in secondary school, while the proportions are
also relatively high in most other countries and likely to be higher among older children. In
these same countries there is also a gender bias, with girls less likely to be in secondary
school. One reason for not attending school is likely to be low incomes, which could be
addressed, in part, by a UCB. Further, if girls are able to receive cash as teenagers, they are
less likely to enter into early marriage, since they are more likely to be able to afford to stay
in school.
18
Kang et al. (2018).
19
IIPS & ICF (2017); MOH Nepal et al. (2017).
152 The rationale for Universal Child Benefits in South Asia
Figure 2-11: Percentage of secondary school-age children not attending school across
South Asia, by gender
80%
Boys Girls
70%
60%
50%
40%
30%
20%
10%
0%
Afghanistan Bangladesh Bhutan India Maldives Nepal Pakistan Sri Lanka
13-18 years 11-15 years 13-14 years 15-17 years 13-17 years 11-15 years 10-14 years 10-15 years
Source: NIPORT et al. (2016); National Statistics Bureau of Bhutan (2017); CSO et al. (2017); IIPS & ICF (2017); MOH Nepal et
al. (2017); MOH Sri Lanka & ICF International (2017); MOH Maldives & ICF (2018); and, NIPS & ICF (2019).
Families living on low incomes may prioritise the wellbeing and development of one child
over the other due to their inability to afford adequate opportunities for all children, which
may explain some of the bias against girls. According to Alkire et al. (2019), 11 per cent of
school age children in South Asia are affected by intrahousehold inequality in school
attendance, meaning that one school age child is attending school but the other one is not.
This is a major challenge in Afghanistan (34 per cent), Pakistan (22 per cent) and Bangladesh
(12 per cent).
While it is important to ensure that children can finish secondary school, this is insufficient if
educational outcomes are to be maximised. International evidence indicates that up to 86
per cent of the variation in educational achievement among children is explained by out-of-
school factors.20 Further, many of these factors are determined by family incomes, with
children from low income families less likely to perform as well at school as children from
well-off families (of which there are very few in South Asia).
One of the main factors influencing educational outcomes in children is their home
environment. The higher the income of a family, the more likely that the home environment
20
Goldhader et al. (1999); Hirsch (2007).
162 The rationale for Universal Child Benefits in South Asia
is positive for children. Yet, since most families in South Asia are living on low and insecure
incomes, the challenge experienced by families in providing a good home environment is
felt by most children in the region.
One common experience resulting from low incomes is the limited time that parents have
available to spend with their children, due to being obliged to work longer hours to make
ends meet. As a result, they are less able to offer their children support with their cognitive
development and education, such as by playing with them or helping with their homework.
Another challenge is that low income families find it more difficult to purchase games, toys
and books for their children, further hindering their development. For example, even in two
of the wealthier countries in the region, a high proportion of children have very few books at
home: 41 per cent of children in the Maldives have less than three books at home and 60
per cent of children in Sri Lanka have five books or less. The situation is likely to be worse in
poorer countries. As Figure 2-12 indicates, the challenge of children having few books cuts
across the welfare distribution, yet again suggesting that low incomes are widespread, even
within the region’s richer countries.
Figure 2-12: Percentage of children below the age of 5 years in the Maldives with less
21
than three books and, in Sri Lanka, with five books or less.
Percentage of children below age 5 in the Maldives Percentage of children between the age of 2-4 years in
with less than three children's or picture books Sri Lanka with five books or less
100% 100%
Percentage of children age 2 to 4 years
Percentage of children below age 5
80% 80%
81.6
60% 60% 66.7
56.7
50.3 52
40% 46.2 40%
38.5 40.3
36.3
30.2
20% 20%
0% 0%
Lowest Second Middle Fourth Highest Lowest Second Middle Fourth Highest
Source: MOH Maldives & ICF (2018) and MOH Sri Lanka & ICF International (2017).
Income stress in families can contribute to domestic violence, which also impacts on child
wellbeing and development.22 Domestic violence can impede children’s cognitive, sensory
and language development, while making it more likely that they will experience sleep
21
In Sri Lanka, the information is for children aged 2-4 years.
22
WHO (2002).
172 The rationale for Universal Child Benefits in South Asia
problems, emotional distress and depression.23 Further, children living in families where
violence is prevalent are, again, likely to have home environments that are less conducive to
studying, which may affect their school performance. As indicated by Figure 2-13, a high
proportion of women in the region, who are between 15-49 years and have been married at
least once, have experienced domestic violence (physical, emotional or sexual), ranging
from 17 per cent in Sri Lanka to 56 per cent in Afghanistan. The impacts on child wellbeing
and development may well be significant, affecting many children across the region.
Figure 2-13: Proportion of women aged 15-49 years who have been married at least once
and have experienced domestic violence (physical, emotional or sexual)
60%
56
Proportion of ever-married women aged 15-49
50%
40%
years
33 34
30%
26
24
20%
17
10%
0%
Afghanistan India Maldives Nepal Pakistan Sri Lanka
Source: CSO et al. (2017); IIPS & ICF (2017); MOH Nepal et al. (2017); MOH Sri Lanka & ICF International (2017); MOH
Maldives & ICF (2018); and NIPS & ICF (2019). Note: Data is unavailable for Bangladesh and Bhutan.
2.1.4 Disability among children
Globally, children with disabilities face some of the most severe vulnerabilities. Families
with disabled children can experience significant additional costs for health, education,
transport, assistive devices and other items. In India, for example, families have between 20
to 58 per cent additional costs when someone in their household has a disability.24 In
addition, family members and caregivers likely experience a reduction in income due to an
inability to work resulting from the time they spend caring for their disabled children. In
23
Osofsky (1999).
24
Schjoedt et al. (Forthcoming)
182 The rationale for Universal Child Benefits in South Asia
other cases, children with disabilities can be left without a carer while family members are
forced to leave the home to find work. At times, following the birth of a child, fathers may
abandon the child’s mother, which can result in a significant downward spiral, as illustrated
by Figure 2-14. One result of families struggling financially can be children not attending
school (which is further exacerbated by discrimination and poor accessibility): for example,
in India, 75 per cent of five year old children with disabilities are out of school, as are 25 per
cent of all disabled children aged between five and 19 years.25 While children with
disabilities would definitely gain from a UCB, they also need access to a Child Disability
Benefit while caregivers who have given up work should receive a Carers’ Benefit.
Figure 2-14: The downward spiral of children with disabilities living in extreme poverty
Source: Development Pathways.
2.1.5 Impacts of the COVID-19 crisis on children
The health and economic crisis caused by the global COVID-19 pandemic has left children in
South Asia – as elsewhere in the world – in an even more vulnerable state. Research
undertaken by UNICEF indicates that, in Bangladesh, families with children are likely to have
lost an average of 19 per cent of their income, while the figure is 27 per cent in Sri Lanka.26
As Figure 2-15 shows, the highest falls in income are likely to be among better-off
households in Bangladesh and those struggling on middle incomes in Sri Lanka. However,
25
UNESCO (2019).
26
Kidd et al (2020a; 2020b).
192 The rationale for Universal Child Benefits in South Asia
even though the poorest families with children are experiencing lower income losses, given
that they were already in severe difficulties before the pandemic, their children will be at
particular risk. Across the welfare distribution, children will have experienced a deterioration
in their diets, missing out on nutrients that are essential for their cognitive and physical
development. Urban populations are at greater risk of food insecurity since they are unable
to access home produce to supplement their diets.27
Figure 2-15: Impacts of COVID-19 on the incomes of households with children in
Bangladesh and Sri Lanka
Bangladesh Sri Lanka
Bottom Top Bottom Decile Decile Decile Decile Decile Decile Decile Decile Top
10% 2nd 3rd 4th 5th 6th 7th 8th 9th 10% 10% 2 3 4 5 6 7 8 9 10%
0 0
-5 -5
Percentage change in income
Percentage change in income
-10 -10
-15 -15
-15
-17 -16
-20 -20
-19 -19
-20 -20
-21 -21
-22
-25 -23 -25
-24
-25
-30 -30 -27 -28
-30 -29
-31 -31 -31
-35 -35
Source: Kidd et al (2020a; 2020b).
The increase in stress levels caused by the COVID-19 crisis due to falls in income and
confinement in the home will have negatively impacted on children’s home environments.
Studies conducted since the start of the pandemic have already raised concerns regarding
higher levels of domestic violence. In Sri Lanka, a child helpline reported that between 16th
March and 7th April 2020, a total of 121 cases of cruelty were reported, which is 40 per cent
28
above the average number for a similar period. In Nepal, police reports have indicated an
increase in attempted child suicides among girls, while a child helpline in Bangladesh
intervened in six cases of potential suicide in a single week.29 Further, the financial strain on
families is likely to lead to an increase in child labour, while other families may allow young
daughters to be married in order to improve their financial situation.
27
UNICEF (2020).
28
UNICEF (2020).
29
UNICEF (2020).
202 The rationale for Universal Child Benefits in South Asia
UNICEF (2020) estimates that, in a worst-case scenario, the COVID-19 crisis could push an
additional 120 million children into multidimensional poverty over the course of six months,
on top of the 240 million children across South Asia who were already living in
multidimensional poverty prior to the crisis. The pandemic could also cause an increase in
child mortality as a result of its indirect consequences. Research undertaken by the John
Hopkins Bloomberg School of Public Health has warned that an additional 2,400 children in
South Asia could die every day as a result of being unable to access essential health
services, such as maternal, new-born and child-health services. The highest rates of child
mortality would occur in India and Pakistan, followed by Bangladesh and Afghanistan.30
2.2 The potential demographic dividend in South Asia
Over the next few decades, most countries in South Asia should be able to enjoy a potential
demographic dividend which will drive further economic growth. A demographic dividend
derives from a decrease in the national dependency ratio as the proportion of children in the
population shrinks while that of older people remains relatively low. This means that there
should be an expansion in the potential labour force relative to the size of the child and older
populations, as baby boomers reach working age; society will be able to transfer resources
from children to the working age population, meaning that there can be higher investment
in infrastructure, job training and new technologies; and, there should be an increase in
women’s participation in the labour force as they experience a reduction in their caring
responsibilities. Further, with the expansion in the working age population, societies can
save more – for example, through contributions to pension funds – which can be used for
investments.31
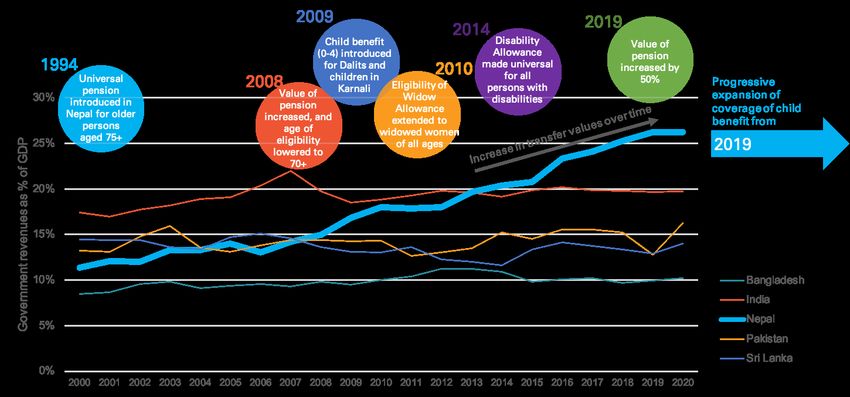
As Figure 2-16 demonstrates, dependency ratios are falling across most of South Asia,
meaning that they are in a position to benefit from the demographic dividend. The only
exceptions are the Maldives and Sri Lanka – which are both ageing societies – although
dependency ratios will still remain relatively low for a few decades so that it is still possible
for them to enjoy the tail end of the demographic dividend.
30
UNICEF (2020).
31
Bloom et al (2011).
212 The rationale for Universal Child Benefits in South Asia
Figure 2-16: Dependency ratio, measuring the proportion of dependants (children age 0-19
years and older people aged 65 and above) per 100 persons of working age (20-64 years)
over time, by country
Afghanistan Bangladesh Bhutan India
Maldives Nepal Pakistan Sri Lanka
200
Population aged 0-19 and 65+ per
180
100 population aged 20-64
160
140
120
100
80
60
40
20
0
1980 1985 1990 1995 2000 2005 2010 2015 2020 2025 2030 2035 2040 2045 2050
Source: Based on UN DESA Population Projections.
Yet, the ability of countries to take advantage of the demographic dividend is contingent on
them benefiting from a skilled workforce. If they cannot, then the demographic dividend
could turn into a curse, with large numbers of unskilled young people unable to find
productive employment. High levels of unemployment, underemployment and low incomes
would continue to be the norm, resulting in families being unable to invest in their own
children, while undermining economic growth and social cohesion. These countries would
be in danger of being left behind in the global markets.
To avoid this scenario, the countries of South Asia urgently need to support today’s
children. As discussed earlier, this means investing in health and education services, while
also addressing the widespread low family incomes that inhibit children from reaching their
full potential. An essential element of a society-wide strategy would be the introduction of a
UCB.
2.3 Inequality across South Asia
Levels of inequality vary across South Asia. Figure 2-17 shows the most recent Gini
coefficients for each country derived from national household survey data sets. Afghanistan,
Bhutan, India and Sri Lanka have Gini coefficients above 0.35, which are in line with
countries regarded internationally as relatively unequal, such as the United States and
United Kingdom. In some countries, inequality is increasing. In India, in 2005, the richest
decile of the population had 45.5 per cent of national income while the bottom half had 18.4
222 The rationale for Universal Child Benefits in South Asia
per cent.32 Yet, by 2014, the richest decile had increased their share to 56.1 per cent while it
had fallen among the bottom half to only 14.7 per cent. High inequality can impact on social
cohesion within countries, with the majority of the population feeling left behind, in
particular in countries where billionaires are proliferating. High inequality can also
compromise sustainable economic growth: the Gini coefficients in South Asia are well
above the threshold of 0.27 beyond which IMF economists have determined that inequality
harms economic growth.33 If countries wish to avoid the damage that can be caused by high
inequality – including the danger of leaving many children behind – greater consideration will
have to be given to more effective means of redistributing wealth, including through social
security.
Figure 2-17: Latest Gini coefficients across South Asian countries
0.45
0.40
0.35 0.39 0.40
0.37 0.36
0.30 0.33 0.33
0.32 0.31
Gini index
0.25
0.20
0.15
0.10
0.05
0.00
Afghanistan Bangladesh Bhutan India Maldives Nepal Pakistan Sri Lanka
Sources: World Bank Povcalnet, available at: http://iresearch.worldbank.org/PovcalNet/; analysis of the Afghanistan Living
Conditions Survey of 2016/17.
A UCB is an effective tool for tackling inequality. Indeed, universal social security schemes
have been used very effectively to reduce inequality in high income countries and could
achieve the same outcome in countries across South Asia. While it is commonly believed
that poverty-targeted benefits are more effective than universal benefits in tackling
inequality, this is not the case. A key reason is because universal benefits attract much
higher levels of investment than poverty-targeted programmes – due to their greater
popularity – so many more families access support. Further, universal benefits require
higher levels of tax, which falls disproportionately on the richer members of society. When
both taxation and spending are considered, the impacts of universal benefits on inequality
are significantly higher than those of poverty-targeted programmes.34
32
Source: World Inequality Database at https://wid.world.
33
Grigoli & Robles (2017).
34
See Kidd (2018a) for a more in-depth explanation.
23You can also read