Culture and Student Achievement: The Intertwined Roles of Patience and Risk-Taking - Rationality and Competition
←
→
Page content transcription
If your browser does not render page correctly, please read the page content below
Culture and Student Achievement: The
Intertwined Roles of Patience and Risk-Taking

                    Eric A. Hanushek (Stanford University)
                         Lavinia Kinne (ifo Institute)
                      Philipp Lergetporer (ifo Institute)
                 Ludger Woessmann (LMU Munich & ifo Institute)

                         Discussion Paper No. 249
                                       July 8, 2020

       Collaborative Research Center Transregio 190 | www.rationality-and-competition.de
           Ludwig-Maximilians-Universität München | Humboldt-Universität zu Berlin
    Spokesperson: Prof. Dr. Klaus M. Schmidt, University of Munich, 80539 Munich, Germany
                    +49 (89) 2180 3405 | info@rationality-and-competition.de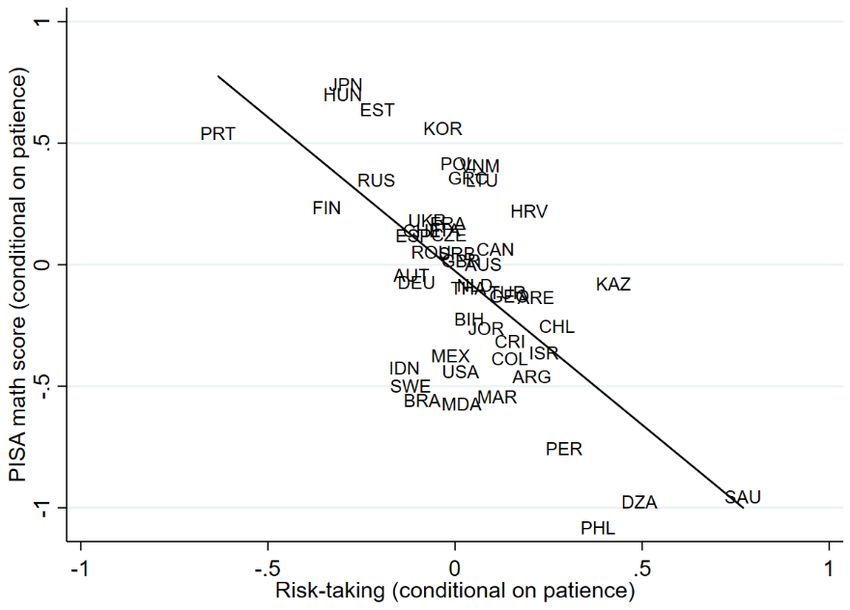
Culture and Student Achievement:
         The Intertwined Roles of Patience and Risk-Taking*
         Eric A. Hanushek, Lavinia Kinne, Philipp Lergetporer, and Ludger Woessmann †

                                                   Abstract
Patience and risk-taking – two cultural traits that steer intertemporal decision-making – are
fundamental to human capital investment decisions. To understand how they contribute to
international differences in student achievement, we combine PISA tests with the Global
Preference Survey. We find that opposing effects of patience (positive) and risk-taking (negative)
together account for two-thirds of the cross-country variation in student achievement. In an
identification strategy addressing unobserved residence-country features, we find similar results
when assigning migrant students their country-of-origin cultural traits in models with residence-
country fixed effects. Associations of culture with family and school inputs suggest that both may
act as channels.

                 Keywords: culture, patience, risk-taking, preferences, intertemporal
                    decision-making, international student achievement, PISA
                                        JEL classification: I21, Z10
                                                June 26, 2020

     *
       We gratefully acknowledge comments from David Figlio, Nikki Shure, and seminar participants at the ifo
Center for the Economics of Education in Munich. This work was supported by the Smith Richardson Foundation.
The contribution by Woessmann is part of German Science Foundation project CRC TRR 190.
     †
       Hanushek: Hoover Institution, Stanford University, CESifo, IZA, and NBER, hanushek@stanford.edu.
Kinne: ifo Institute at the University of Munich, kinne@ifo.de. Lergetporer: ifo Institute at the University of
Munich, CESifo, lergetporer@ifo.de. Woessmann: University of Munich, ifo Institute, CESifo, and IZA,
woessmann@ifo.de.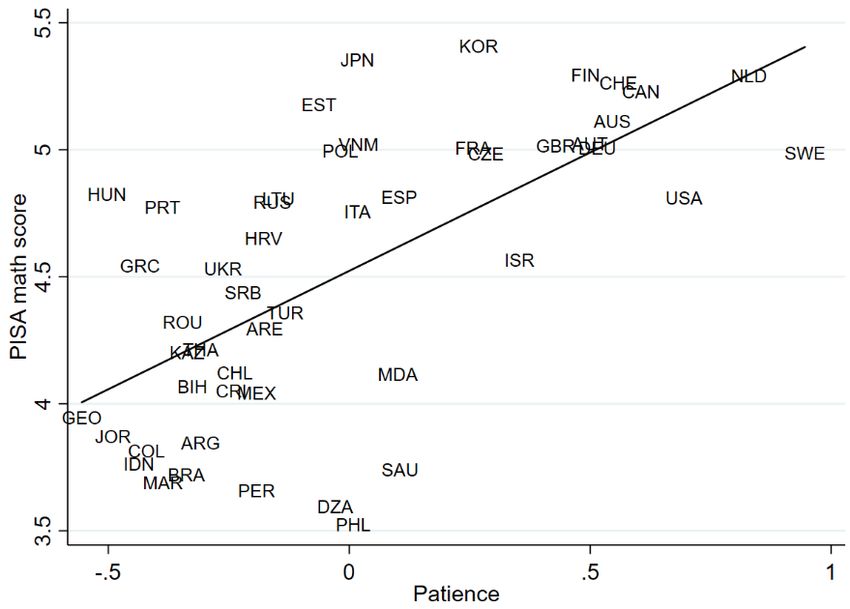
1. Introduction
     Each release of international student assessment data such as the PISA test brings both
professional and popular discussions of the causes of national score differences. 1 Score
differences attract widespread attention not only because of the national ranking aspect but also
because they provide indices of skills that are important for both future individual earnings and
national economic growth. 2 Yet the underlying reasons for national differences in performance
are not well understood. One often discussed but seldom analyzed factor is cultural differences.
This paper, relying on newly available measures of time preferences and attitudes about risk
across countries, establishes a clear case for an important linkage of culture and educational
performance and finds that international differences in patience and risk-taking are strongly
related to international differences in student achievement.
     Past research gives a mixed picture of the sources of test-score differences across countries. 3
Commonly available measures of educational resources such as aggregate spending, class size,
and teachers’ experience and education explain little of existing score variation. 4 On the other
hand, institutional characteristics of school systems including test-based accountability, local
autonomy, and private-school competition provide some explanation of score differences.
Additionally, the role of parents and families is consistently strong, although quite variable
across countries. Taken together, these aggregate factors provide a clear stylized picture of the
relative roles of families, resources, and school institutions as proximate inputs into the
international variation in test scores. Yet, the deeper structural determinants of international
differences in societal choices of schooling inputs and in the productivity with which they are
converted into educational outcomes remains poorly understood.
     We focus on the potential role of cultural differences across societies as constituting
fundamental determinants of student achievement differences. Our conceptual framework
combines the usually separated literatures about optimal human capital investment and about

     1
        The Programme for International Student Assessment (PISA) of the Organisation for Economic Co-operation
and Development (OECD) provides test scores of random samples of 15-year-old students on a three-year cycle
since 2000. Its latest installment in 2018 covers 75 countries (and four sub-country regions, see OECD (2019)).
      2
        Achievement assessments are strongly related to both individual earnings (Hanushek et al. (2015, 2017)) and
international growth differences in the aggregate (Hanushek and Woessmann (2012, 2015)).
      3
        Details behind the following overall summary statements from the existing research can be found in
Hanushek and Woessmann (2011) and Woessmann (2016b).
      4
        One recent study finds that a portion of the test-score differences across countries can be attributed to teacher
cognitive skills (Hanushek, Piopiunik, and Wiederhold (2019)).

                                                              1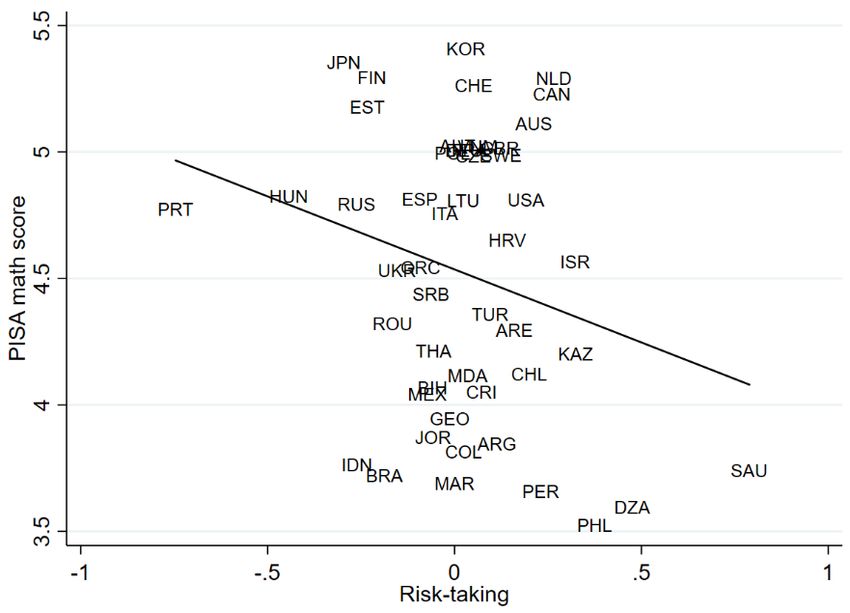
education production functions in order to highlight the central nature of preferences underlying
intertemporal decision-making. At their heart, educational choices and human capital investment
decisions are inextricably linked to intertemporal outcomes. Moreover, while investment
decisions are generally viewed from the individual perspective, many decisions on educational
inputs – in particular about resources and school institutions – are taken at the group level rather
than the individual level, making it hard to disentangle impacts of individual preferences from
the cultural aspect of group preferences.
    Two components of cultural traits are central to the relative valuation of net payoffs that
accrue in the present versus in the future: time preferences (patience) and risk preferences (risk-
taking). Human capital investment decisions take time to effectuate and even longer before any
returns are realized. Just as the rewards for schooling investments require patience on the part of
the investor, national differences in patience may filter through into national differences in
educational outcomes. Decisions to invest in human capital also involve considerable risk, and
different channels ranging from chances of successfully completing schooling to variations in
wages and employment in the future predict opposing effects of risk attitudes. Interestingly,
because of the focus of optimal investment studies on labor-market outcomes, their analysis of
risk has completely ignored how risk might enter into the production process itself. If we focus
on the schooling process, elements emphasized in the crime literature (e.g., Freeman (1999))
come into play: A culture of risk aversion may discourage students from getting into trouble,
thus spurring their effort in studying and carrying through to their educational performance.
Importantly, the intertemporal nature of human capital investment, its inherent riskiness, and the
interrelatedness of the two preference components imply that one cannot consider the impact of
patience without simultaneously considering risk-taking, and vice versa.
    Our empirical investigation of these cultural linkages is made possible by the recent
innovations in international preference measurement in Falk et al. (2018). Their Global
Preference Survey (GPS) employs experimental means to validate survey instruments that can be
used to collect systematic data on international differences in several preference parameters. As
such, the GPS establishes scientifically-grounded measures of culture that provide a means to
test hypotheses central to models of human capital investment.
    We combine the GPS data with PISA data on the educational achievement of close to two
million students observed in seven waves from 2000-2018 across 49 countries. These data allow

                                                    2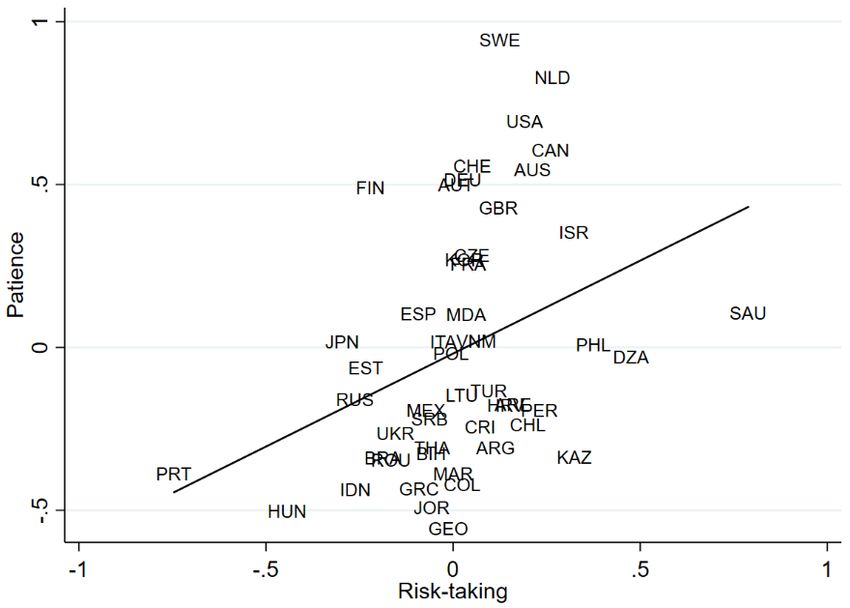
us to estimate international education production functions at the student level that bring out how
country differences in cultural traits affect the skills acquired by students.
    Our baseline analysis finds a strong and competing relationship between the two
intertemporal cultural traits and students’ educational achievement. Patience has a strong positive
and risk-taking a strong negative association with test scores. The substantial positive correlation
between the two implies that looking at these cultural values individually gives very misleading
results and that it is important to condition on the one when interested in the effect of the other.
    Together, the two aggregate intertemporal cultural components account for two-thirds of the
variation in country average scores. Thus, a significant portion of the cross-country variation in
student achievement may be closely related to fundamental cultural differences that play out in
human capital investment decisions. Consistent with a leading role of national cultures, the
associations of cultural measures with individual achievement are much stronger for native
students than for migrant students who moved into the school system from another culture.
Moreover, these findings are stable across separate subjects (math, science, and reading) and
subsamples (OECD and non-OECD).
    To explore the causal structure of these cross-country associations, we turn to an
identification strategy that focuses on the migrant students in the PISA data. Across 48 residence
countries, we observe the country of origin of over 80,000 migrant students from 58 countries of
origin with data on culture. Following Figlio et al. (2019), we assign migrant students the culture
of their country of origin and study the performance of migrant children from different cultures
observed in the same residence country. We include fixed effects for each residence country in
order to separate the effects of cultural factors from potentially correlated effects of the education
systems, economies, or other common features of the residence country.
    Students from home-country cultures with an aggregate one standard deviation higher
patience perform about 90 percent of a standard deviation better in math, whereas students from
home-country cultures with one standard deviation higher risk-taking perform about 30 percent
of a standard deviation worse. Consistent with an intergenerational persistence of home-country
culture, results are larger for migrant students who speak the language of their home country
rather than of their current residence country at home. While this migrant analysis cannot rule
out all potential biases in the cross-sectional analysis, robustness across different country
samples, subjects, alternative cultural measures, definitions of the migrant population, different

                                                     3
amounts of student test-taking effort, and several adjustments for the selectivity of migration
shows that our results are insensitive to the most obvious threats to identification.
In order to investigate various channels through which cultural traits might influence student
achievement, we link culture to the proximate inputs of the education production function in a
final descriptive analysis. Patience is significantly positively correlated with aggregate indicators
of family inputs, school inputs, and residual achievement differences (which likely combine
productivity differences with unobserved inputs) across countries. Risk-taking is negatively
correlated with family and residual inputs. Results are consistent with culture working through
various input channels, with a particularly important role for family and residual inputs.
Our analysis of student assessment scores follows the recent literature investigating the
influence of cultural factors on economic behavior and outcomes (see Guiso, Sapienza, and
Zingales (2006) and Alesina and Giuliano (2015) for reviews). With our migrant student
analysis, we also contribute to this literatures’ focus on intergenerational transmission (e.g., Bisin
and Verdier (2011); Alesina and Giuliano (2014); Chetty et al. (2017)). Past study of
international student achievement has treated culture largely as a source of possible bias in
estimating the effects of different proximate inputs in a cross-country setting (e.g., Hanushek and
Woessmann (2011); Woessmann (2016b)). Here we show the value of directly addressing the
potentially more fundamental role of cultural traits as underlying causes of achievement score
differences in their own right, explaining previously unanalyzed elements of the nature of
societal human capital investment decisions and the resulting human capital formation.
One central feature of our analysis is combining the two artificially separated strands of
human capital literature: optimal investment decisions by individuals and the educational
production process for skill development. The human capital investment literature following
Mincer (1958), Becker (1964), Ben-Porath (1967), and others has measured human capital by
individuals’ years of schooling, equating skill development directly to the time costs of the
investment. Human capital investments are portrayed as an individual intertemporal optimizing
decision involving varying time commitments over the life cycle. The education production
function literature on the other hand focuses on individuals’ qualitative skill differences,
generally looking at individuals with the same investment of school years but with different
investment inputs by the individuals and by public entities (e.g., Hanushek (1986)). With some
variations, the relevant skills are related to inputs of the individual and family and of the public
4through various aspects of schooling. We believe that these two lines of research are in essence
looking at the same issue – how human capital investment decisions translate into differences in
economically relevant skills. It is possible to gain insights into the deeper forces affecting skill
differences of individuals and nations by treating these lines of research jointly.
We contribute to the literature on preferences and behavior which emphasizes the roles of
time preferences (e.g., Sutter et al. (2013); Golsteyn, Grönqvist, and Lindahl (2014); Figlio et al.
(2019)), risk preferences (e.g., Levhari and Weiss (1974)), and their interrelatedness (e.g.,
Halevy (2008); Andreoni and Sprenger (2012); Castillo, Jordan, and Petrie (2019)). Our analysis
also relates to work on long-run comparative development (e.g., Galor and Özak (2016);
Dohmen et al. (2019)) and immigrants (e.g., Abramitzky and Boustan (2017)).
The next section provides a conceptual framework that discusses how cultural traits related
to intertemporal choices enter the human capital production model. Section 3 describes the data
on human capital outcomes (PISA scores) and on cultural differences in time and risk
preferences (GPS data). Section 4 develops the baseline estimates of the relationship of culture
and human capital across nations. Section 5 delves deeper into the causal structure using the
analysis of migrant outcomes. Section 6 explores the association of culture with proximate input
factors as possible channels of the culture-achievement relationship. Section 7 concludes.
2. Conceptual Framework
Our analysis of international differences in test scores is motivated by a desire to understand
how different national cultures contribute to variations in human capital across nations. We start
by depicting educational choices in a human capital investment model with intertemporal
preferences, incorporating several prior lines of inquiry into human capital investments (section
2.1). We then focus on the production of skills in order to understand how cultural traits affect
the individual and public choices of inputs into the education production function and the
ultimate set of skills (section 2.2). Finally, we provide a deeper discussion of how patience and
risk-taking enter separately and jointly into intertemporal decision-making (section 2.3).
2.1 Education as Intertemporal Choice
Educational decisions are fundamentally an intertemporal choice: initial investments of time,
effort, and resources are set against expected future gains. Early human capital models thus
directly related educational returns and investments to the rate at which future earnings are
5discounted (Mincer (1958, 1974); Becker (1964)). Further development of modern human capital
theory naturally moved to optimal investment decisions of individuals, focusing on the
maximization of lifetime earnings and stressing the time dimension of investments (Ben-Porath
(1967, 1970); Heckman (1976); Rosen (1976)). The focus on a representative individual with
perfect foresight precluded any deeper consideration of individual differences in intertemporal
preferences. Given the intertemporal optimization decision, however, the two preference
components related to balancing the present and the future – time and risk preferences – are
crucial in understanding individual educational choices.
Surprisingly little explicit attention has been given to individual willingness to postpone
gratification captured in patience, even though it is obviously a key element in the educational
investment decision and thus in the earnings distribution. Detailed consideration of risk, by
contrast, has entered human capital modeling at least since the contributions by Weiss (1972)
and Levhari and Weiss (1974).
The models of optimal human capital investment almost always focus on decisions about the
quantity of education, which becomes the measure of individual skills. This focus has been
natural given the availability of data and the consistency with the view of human capital
investment as one of time. The perspective has been extraordinarily successful: The basic
lifetime earnings model of Mincer (1974) has made years of schooling virtually synonymous
with human capital in a wide range of empirical studies. Yet, school quantity is an imperfect
measure of the underlying skill development that prescribes the optimality of downstream
quantitative decisions in models of skill formation (Cunha, Heckman, and Schennach (2010))
and that has future payoffs on the labor market (Hanushek and Woessmann (2008)).
2.2 Human Capital Investment, Educational Production, and Culture
Direct investigation of the production of skills has developed mostly separately from the
study of optimal human capital investment (Hanushek (1986)). Research into skill development
during the production stage focuses on what is actually learned, generally measured by
achievement tests (rather than the time spent in school). 5 This research almost exclusively
considers issues of technical efficiency of input usage and of the productivity of different inputs
5
Our focus on achievement scores does not imply a different interest from the school attainment work. We
view the intermediate measures of adolescents’ achievement as a good index of the ultimate skills of completed
human capital investments. As an alternative, the Programme for International Assessment of Adult Competencies
(PIAAC) measures the cognitive skills of adults, but analysis is hampered by limited country coverage.
6– without relation to human capital investment behavior. 6 But in reality, the education production
function depicts how chosen inputs relate to human capital, as the observed proximate inputs to
skill development are themselves the result of human capital investment decisions.
Further, even though the canonical human capital production model depicts skills as a
function of family and school inputs, it is difficult to presume that these measured outcomes
perfectly reflect the optimizing decisions of parents. The process of skill acquisition involves
numerous actors – including the students themselves, their peers and friends, families,
neighborhoods, teachers, school principals, and so on. Each presumably is optimizing over a
different value function that may include different intertemporal preference parameters. Because
of different assessments of the long-run value from human capital investments and different
valuation of present versus future costs and payoffs, children may for example choose effort
levels according to a preference for playing football or computer games over studying math in a
way that diverges from what parents deem optimal in their maximization calculus. 7
Importantly, many of the relevant educational investment decisions are actually made at the
group level. How much to invest in school resources is usually publicly chosen at the municipal,
state, or country level. Similarly, the institutional structures of school systems – features such as
school accountability, autonomy, and choice which have been shown to matter greatly for
student outcomes (Hanushek and Woessmann (2011); Woessmann (2016b)) – are decided upon
at the group level, and in most countries at the national level. As a consequence, aggregate
societal intertemporal preferences will affect many parts of the education production process,
making the set of preferences shared by the group important.
Therefore, in this paper we change the perspective from individual preferences to group
culture. Guiso, Sapienza, and Zingales (2006), p. 23, define culture as “those customary beliefs
and values that ethnic, religious, and social groups transmit fairly unchanged from generation to
generation.” While different theoretical and empirical concepts and definitions exist (Alesina and
Giuliano (2015)), relevant cultural values encompass the set of preferences shared by the group –
including the intertemporal preferences that we deem important for educational choices. 8
6
There are exceptions, for example, when the choices of parental investments are related to other inputs in the
production function (Kim (2001); Todd and Wolpin (2003)).
7
Children may also be less willing or able to solve the dynamic optimization problem, leading to behavioral
biases that prevent them from pursuing their own long-run well-being (Lavecchia, Liu, and Oreopoulos (2016)).
8
The concept of culture is related to the concepts of values, preferences, and personality traits and sometimes
even subsumed in noncognitive skills, and the interrelations and distinctions between the concepts often remain
7A key element of the existing cultural analyses is an emphasis on values that are transmitted
persistently across generations (Bisin and Verdier (2011); Alesina and Giuliano (2014)). This
persistent transmission motivates our empirical strategy below that looks at measures of culture
in the home countries of migrants. Empirically, looking at migrants living in the same residence
country allows us to distinguish cultural factors from other features of the residence country such
as institutions and economies (Carroll, Rhee, and Rhee (1994); Giuliano (2007); Fernández and
Fogli (2009); Figlio et al. (2019)).
Recognition of intergenerational transmission also suggests some care in the specification of
empirical models because common family factors may reflect cultural features. Analyses of
educational production functions – whether within or across countries – commonly include
measures of parental education (e.g., Hanushek (1986); Hanushek and Woessmann (2011)). But
if national cultures influence human capital investment, parents’ realized educational patterns
may proxy the culture of their country. As such, they may partially be bad controls in the study
of culture because they absorb part of the influence of cultural factors.
More generally, a country’s culture may affect all inputs in the education production process
– on both the family and the school side – as well as the overall productivity with which these
inputs are transformed into educational outcomes. This conceptualization implies that analyses of
the effect of culture on student achievement should use very parsimonious specifications of the
vector of control variables contained in the education production function.
2.3 Patience, Risk-Taking, and their Interrelatedness
While culture can encompass a wide variety of common traits, our interest in intertemporal
decisions related to educational investments leads us to focus on two specific components: time
preferences and risk preferences.
Time Preferences. The central role of the discount rate in models of optimal investment in
human capital implies that time preferences are a key element of choices about whether to invest
additional time, effort, and resources in improving educational outcomes. Preferences for payoffs
in different time periods are reflected in patience, the trait of having a low rate of time
discounting. For example, students must consider whether to give up play time with friends
vague. See Almlund et al. (2011) for an extensive discussion of the relationship between personality traits and
preferences.
8today – the opportunity cost of studying in the afternoon – for higher rewards in the future, such
as graduating from school with better grades or the opportunity to receive better-paying jobs. 9
It is remarkable that empirical studies only recently have begun to link validated measures
of time preferences among students directly to educational outcomes. For example, Sutter et al.
(2013) show that experimentally elicited measures of patience among Austrian children are
significantly related to field behavior, including reduced violations of schools’ code of conduct. 10
Using longitudinal Swedish data, Golsteyn, Grönqvist, and Lindahl (2014) find that adolescents’
time preferences are associated with human capital investments and lifetime outcomes. Castillo,
Jordan, and Petrie (2019) show that experimentally elicited measures of discount rates among
students in a school district in the U.S. State of Georgia are significantly related to high school
graduation. Combining the Hofstede (1991) cultural measure with migrant students in Florida
schools as well as with the PISA data, Figlio et al. (2019) show that students from cultures with
greater long-term orientation perform better on several measures of educational achievement. 11
At the macro level, Galor and Özak (2016) and Dohmen et al. (2019) show that time preferences
are importantly related to economic and educational outcomes in the long run. 12
Risk Preferences. Beginning with the empirical study of occupational choices by Weiss
(1972) and the theoretical analysis in Levhari and Weiss (1974), a stream of studies of human
capital investments explicitly introduced various components of uncertainty and risk. In a very
general way, Levhari and Weiss (1974) consider a range of risky elements that occur at the time
of investment decisions including future supply and demand conditions as well as knowledge of
one’s own ability, of how time and money convert into human capital, and of the quality of
schools along the investment path. They show that it is not possible a priori to determine how
9
As such, patience is closely related to similar concepts employed in the study of traits among children, such
as the willingness to defer gratification as measured, e.g., by the famous “marshmallow test” (e.g., Mischel, Shoda,
and Rodriguez (1989)), self-control (Moffitt et al. (2011)), or perseverance and grit (e.g., Duckworth et al. (2007)).
10
Alan and Ertac (2018) and Alan, Boneva, and Ertac (2019) show that measures of patience and grit are
malleable to classroom interventions.
11
Mendez (2015) shows the potential relevance of culture for student achievement using a principal
component from eleven different value questions in the World Values Survey (WVS) with migrant students in seven
host countries in PISA, but the approach does not delve into specific cultural traits. Cordero et al. (2018) include
WVS measures in efficiency measurement of school systems in PISA.
12
While formulated from a different perspective, a recent literature suggests that student behavioral differences
related to effort, care, motivation, and perseverance may impact country test scores (e.g., Borghans and Schils
(2012); Balart, Oosterveen, and Webbink (2018); Akyol, Krishna, and Wang (2018); Gneezy et al. (2019); Zamarro,
Hitt, and Mendez (2019)). These behavioral differences may in turn reflect underlying cultural differences. We
return to the role of student test-taking effort in robustness analyses below.
9risk affects human capital investment incentives, a conclusion reiterated in the extensive review
by Benzoni and Chyruk (2015). In line with the indeterminate nature of the impact of risk, higher
earnings variance in higher-educated jobs may give rise to a positive association between risk-
taking preferences and investment in higher education (e.g., Hartog and Diaz-Serrano (2007,
2014)), whereas lower unemployment risk of higher-educated jobs (e.g., Woessmann (2016a))
may give rise to the opposite association. Focusing on student behavior and drawing on insights
from the economics of crime, Castillo, Jordan, and Petrie (2019) argue that risk-lovingness may
deter educational effort by favoring misbehavior in adolescence if there is uncertainty about
getting caught by teachers or parents.
Existing empirical evidence on the association between risk and human capital investment is
closely related to the specific components of risk considered in individual studies. Using U.S.
data, Brown, Fang, and Gomes (2012) suggest that greater risk aversion leads to more
investment in high-school education compared to less than high school but less investment in
college compared to high school. Analyzing both wage and employment uncertainty, Groot and
Oosterbeek (1992) find different results on returns by type of schooling (vocational or college) in
the U.S. and the Netherlands, while Koerselman and Uusitalo (2014) find little differential effect
of lifetime income variability on different schooling choices in Finland. Palacios-Huerta (2003)
compares human capital risks to financial assets risk and detects wide variation in risk-adjusted
rates of return. Using direct measures of children’s risk preferences, Sutter et al. (2013) find little
evidence of associations with field behavior, whereas Castillo, Jordan, and Petrie (2019) show a
negative association of risk-taking preferences with high-school graduation. 13
The Interrelatedness of Time and Risk Preferences. While much of the prior literature has
considered time and risk preferences separately, behavioral economics has emphasized their
inherent interrelatedness: since only the present can be certain and the future always contains an
element of uncertainty, it is inescapable that the two preference components are intertwined
(Halevy (2008); Andreoni and Sprenger (2012)). 14
An important implication of this interrelatedness is the need to control for the one preference
component when studying the effect of the other. In fact, because many of the studies of risk-
13
There is also evidence of associations of patience and risk with intelligence among adults, again with mixed
evidence on risk (Dohmen et al. (2010, 2018); Potrafke (2019)).
14
Their particular formulation has been questioned, but the basic concept seems clear. See the exchange in
Cheung (2015), Epper and Fehr-Duda (2015), Miao and Zhong (2015), and Andreoni and Sprenger (2015).
10taking do not control for patience, this interrelationship may help explain the reasons for the
divergent empirical effects of risk on investment. Even more, given the a priori indeterminate
direction of the effect of risk-taking in the human capital production function, the direction of
bias when estimating the effect of patience without considering risk-taking is also unclear.
3. Data
Combined international data on student achievement from the Programme for International
Student Assessment (PISA, section 3.1) and on preferences from the Global Preference Survey
(GPS, section 3.2) support our investigation of how cultural traits relate to student learning.
3.1 The Programme for International Student Assessment (PISA)
The Organisation for Economic Co-operation and Development (OECD) has conducted the
PISA international student achievement test since 2000. PISA assesses achievement in math,
science, and reading of representative random samples of 15-year-old students – independent of
grade level or educational track attended – on a three-year cycle (OECD (2019)). 15 PISA
provides repeated cross-sectional data that are representative in each country-by-wave cell, and
only reports data for countries that meet the OECD’s high sampling and data-quality standards.
Over the seven waves of PISA testing, 2000-2018, a total of 86 countries participated in the
PISA assessment at least once. Our baseline cross-country analysis considers the subset of 49
countries that are also covered by the GPS (see column 3 of Appendix Table A1 for a list of
countries). In total, our baseline analysis uses achievement data from 1,992,276 students from
263 country-by-wave observations.
In our migrant analysis, we can include migrant students in any residence country as long as
PISA identifies the country of origin and GPS data are available for that country. The entire 2000
PISA wave drops out of this analysis as it does not provide information on students’ country of
origin. Still, the country-of-origin perspective of this approach allows us to increase the total
number of countries considered, covering 80,398 migrant students (and up to 145,506 in a wider
definition) from 58 countries of origin (column 5 of Appendix Table A1) observed in 48
residence countries (column 4). As the samples of countries that can be included differs between
15
The sampling in most countries proceeds in two steps. First, a random sample of schools that teach 15-year-
old students is drawn using sampling probabilities that assure representativeness. Second, 35 students aged 15 years
are randomly sampled in each school.
11baseline analysis, residence countries in the migrant analysis, and countries of origin in the
migrant analysis, the different parts of our analysis use data from a total of 86 countries, 71 of
which participated in PISA and 64 of which have GPS data (columns 1 and 2). 16
To create comprehensive measures of students’ competencies, PISA has students complete a
broad array of tasks of varying difficulty in assessments that last for up to two hours. The testing
mode was paper and pencil until 2012 and changed to computer-based testing in 2015. PISA
achievement in math, science, and reading were standardized to a mean of 500 test-score points
and a standard deviation of 100 test-score points for OECD-country students in wave 2000 (and
rescaled on the same metric again in 2003 in math and in 2006 in science). We divide PISA
scores by 100 throughout to express achievement in percent of a standard deviation. As a rule of
thumb for interpreting PISA scores, about a quarter to a third of a standard deviation corresponds
to the learning gains of one year of schooling (Woessmann (2016b)). Appendix Table A2 shows
descriptive statistics of country-level PISA achievement in the three subjects.
In addition to achievement data, PISA elicits background information on student and family
characteristics using student questionnaires, as well as contextual information on school
resources and the institutional environment using school questionnaires completed by school
principals. From these rich background data, we select core control variables for our regression
analysis. At the student level, these are gender, age, migration status (first and second
generation), parental education (six categories), parental occupation (four categories), books at
home (four categories), computer for school work at home (dummy), and other language than the
test language spoken at home (dummy). School-level controls include school location (three
categories), school size, share of fully certified teachers, and shortage of educational material
(dummy). At the country level, we include GDP per capita, share of privately managed schools,
share of government funding of schools, central exit exams (dummy), and a school-autonomy
index. The share of missing values for these covariates is generally very low, averaging 5
percent. We impute missing values of control variables using the respective country-by-wave
16
The complex structure of country inclusion is explained in greater detail in the note to Appendix Table A1.
In the migrant analysis, countries can be included as residence countries even if there are no GPS measures for them
(as long as they participated in PISA and have migrant children from countries of origin that participated in the
GPS) and as countries of origin even if there are no PISA measures for them (as long as they participated in GPS
and have “sent” students as migrants to PISA-participating countries).
12mean and include imputation indicators (one dummy per control variable that equals one if the
respective variable is missing and zero otherwise) in our regression analysis. 17
3.2 The Global Preference Survey (GPS)
The newly available Global Preference Survey (GPS) provides validated, high-quality data
on several preference parameters collected from representative samples in 76 countries (Falk et
al. (2018)). It was conducted within the framework of the 2012 wave of the international Gallup
World Poll, an annual survey on social and economic topics. Using probability-based sampling,
the GPS covers a representative sample of around 1,000 respondents in each country. In our
analysis, we collapse the GPS data at the country level to retrieve one representative measure for
each preference parameter per country. In total, we use GPS data from 64 countries in our
analysis (column 2 of Appendix Table A1) – 49 countries in the baseline cross-country analysis
(column 3) and 58 as countries of origin in the migrant analysis (column 5).
The GPS uses twelve survey items to measure preferences in six domains: patience and risk-
taking (the two preference components underlying intertemporal decision-making that are our
main focus here) plus positive reciprocity, negative reciprocity, altruism, and trust. The survey
items were selected in an ex-ante validation exercise based on their ability to predict incentivized
choices in a controlled laboratory setting. 18 For most preference domains, this exercise led to the
selection of a combination of one qualitative survey question and one hypothetical choice
scenario. For instance, the qualitative survey item to measure patience elicits respondents’
answer to the following question on an 11-point Likert scale: “How willing are you to give up
something that is beneficial for you today in order to benefit more from that in the future?” The
hypothetical choice scenario for patience entails a series of binary decisions between 100 Euro
today or a higher amount in 12 months: “Suppose you were given the choice between receiving a
payment today or a payment in 12 months. We will now present to you five situations. The
payment today is the same in each of these situations. The payment in 12 months is different in
every situation. For each of these situations we would like to know which one you would choose.
Please assume there is no inflation, i.e., future prices are the same as today’s prices. Please
17
In the few cases where a covariate is missing for an entire wave in a given country, we impute by averaging
over the country’s other PISA waves. Dropping these country-by-wave observations as a robustness check does not
affect our results (results available upon request).
18
In the validation exercise, students at the University of Bonn took different incentivized decisions and
answered numerous survey questions for each preference domain (Falk et al. (2016)).
13consider the following: Would you rather receive amount x today or y in 12 months?” The
validation exercise was used to select similar survey questions for the other preference domains
(see Falk et al. (2018) for details). 19 For each domain, the selected survey items are then
combined into a single preference measure using weights from the validation procedure. The
GPS dataset does not provide responses to individual items, so we use the available combined
preference measures in our analysis.
Larger values of patience mean the individual is more likely to accept deferred gratification.
Larger values of risk-taking mean that the individual is more likely to take risky outcomes
compared to certain outcomes. The GPS dataset contains one z-standardized variable for each
preference domain. Standardization is conducted at the individual level so that each preference
has mean zero and standard deviation one in the individual-level world sample. For the purpose
of our analysis, we z-standardize each individual preference measure in our respective analytical
sample and collapse standardized preference measures at the country level. Appendix Table A2
presents descriptive statistics of the resulting data.
Consistent with the interrelation emphasized in the behavioral literature, patience and risk-
taking are strongly positively correlated in the GPS data. Figure 1 depicts the cross-country
association between the two preference components in the 49-country sample of our baseline
analysis, where the significant correlation is 0.358. Appendix Table A3 shows country-level
correlations for all preference measures. While patience is not significantly correlated with the
other four GPS preference domains (although there are marginal correlations with negative
reciprocity and trust), there is a significant correlation of risk-taking with negative reciprocity.
The GPS has several important advantages over alternative international datasets with
proxies for cultural traits, because it provides scientifically validated measures of the two
preference components underlying intertemporal decision-making from representative samples
for a large set of countries. The closest alternatives are the World Values Survey (WVS) and the
Hofstede (1991) data, both of which provide survey data on attitudes, beliefs, and personality
19
Exceptions are trust and negative reciprocity, which are measured using one and three qualitative survey
questions, respectively. For risk-taking, the qualitative 11-point-scale question is: “In general, how willing are you
to take risks?” The quantitative staircase measure is based on the question: “Please imagine the following situation.
You can choose between a sure payment of a particular amount of money, or a draw, where you would have an
equal chance of getting amount x or getting nothing. We will present to you five different situations. What would you
prefer: a draw with a 50% chance of receiving amount x, and the same 50% chance of receiving nothing, or the
amount of y as a sure payment?”
14traits across countries. While the WVS is based on representative samples, the Hofstede data are
mainly based on IBM employees and are not representative. Importantly, in contrast to the GPS,
the validity of the proxies for patience, risk-taking, and other cultural domains from these
surveys is unknown. 20 Reinforcing the high quality of the GPS data, Falk et al. (2018) show that
the GPS patience measure is more predictive of comparative economic development than the
measures of long-term orientation from the other two datasets. Interestingly, the correlations of
the GPS measures of patience and risk-taking with their respective proxies in the WVS and
Hofstede datasets are limited: The correlations of GPS patience with the WVS and Hofstede
long-term orientation measures are -0.060 and 0.247, respectively, and statistically insignificant
(Appendix Table A3). The correlations of GPS risk-taking with WVS risk-taking and Hofstede
uncertainty avoidance are only slightly stronger at 0.239 and -0.302, respectively. For our
robustness analyses, however, we investigate the WVS and Hofstede data as alternative measures
for patience and risk-taking (see sections 4.3 and 5.3).
4. Culture and International Differences in Student Achievement
Our analysis begins with a description of the association of student achievement with
patience and risk-taking across countries. We introduce the empirical model of an international
education production function (section 4.1) and report our baseline results (section 4.2) and
various robustness analyses (section 4.3). These descriptive results guide our subsequent analysis
of the causal structure of the cross-country associations in section 5.
4.1 Empirical Model
Our empirical approach contrasts with most empirical investigations of educational
production functions that include a long list of possible variables in order to soak up potential
impacts of families, schools, institutions, and culture. Being interested in more fundamental
determinants of differences in educational achievement across countries, we use the
20
For instance, the best proxy for patience in the WVS is an item on “long-term orientation” that asks “Here is
a list of qualities that children can be encouraged to learn at home. Which, if any, do you consider to be especially
important?” and is coded 1 if the respondent selects the item “thrift, saving money and things”, and 0 otherwise. The
Hofstede dataset contains proxies for long-term orientation and uncertainty avoidance that are composed of a
collection of four qualitative survey items each, several of which appear somewhat unrelated to the concepts that
they mean to measure. For example, long-term orientation includes an item on “How proud are you to be a citizen of
your country?” and uncertainty avoidance includes an item on “All in all, how would you describe your health these
days?” (see footnote 7 in Falk et al. (2018) for details).
15parsimonious specification of an education production function that models the output of
education as centrally determined by cultural traits:
= + + + + (1)
where achievement T of student i in country c at time t is a function of the two intertemporal
cultural traits of the country, a parsimonious vector of baseline controls B (student gender, age,
and migration status), and an error term ict. Fixed effects for test waves t account for average
changes over time along with any idiosyncrasies of the individual tests. Our coefficients of
interest are 1 and 2 which characterize the relationship between the two cultural traits of a
country’s society – patience and risk-taking – and student achievement.
To account for the country-level nature of the main treatment variables, we cluster standard
errors at the country level throughout. All regressions are weighted by students’ sampling
probabilities within countries and give equal weight to each country.
Because culture is a multifaceted concept, it is important to ensure that the associations are
not driven by other cultural features. Appendix Table A3 indicates little interrelatedness of the
two intertemporal cultural traits with other cultural domains. Nonetheless, in some specifications
we control for the additional cultural factors of the GPS data.
Estimates of education production functions usually contain measures for proximate inputs –
family inputs, school resources, and institutional features. To the extent that these proximate
inputs are themselves the outcomes of intertemporal choice decisions, they would be bad
controls in a model depicting the overall effect of intertemporal cultural traits on student
achievement. Including proximate input factors in our model, however, provides a descriptive
evaluation of the importance of these input channels and shows the robustness of the culture-
achievement association to consideration of variation in input factors that stem from other
sources. Therefore, we also report specifications that include a rich set of control variables for
proximate input factors that would generally be included in education production functions:
= + + + + + + + (2)
which additionally includes measures of the inputs from student’s families F, schools S, and
institutional structures of school systems I.
164.2 Results of the Baseline Analysis
Our baseline analysis of the association of student achievement with cultural traits across
countries is shown in Table 1. The first panel uses math achievement on the 2015 PISA test – the
first PISA wave after the elicitation of the GPS data in 2012 – in the cross-country regression
analysis of equation (1).
Results indicate important and intertwined roles of patience and risk-taking in international
student achievement. When entered individually, there is a strong and significant positive
association of student achievement with patience (column 1) and a weaker and insignificant
negative association with risk-taking (column 2). Strikingly, both associations become much
stronger (in absolute terms) and statistically highly significant when the two cultural traits are
considered together (column 3), highlighting the importance of accounting for their
interrelatedness. A one standard deviation (s.d.) increase in patience is associated with more than
a one s.d. increase in student achievement, whereas the same increase in risk-taking is associated
with more than a one s.d. decline in student achievement. Conditioning on the other cultural trait
is particularly relevant in the case of risk-taking: That part of the variation in risk-taking that is
unrelated to patience has a strong negative association with student achievement.
The results on the two intertemporal cultural traits are hardly affected when taking measures
of other cultural traits into account (column 4). In fact, none of the other four GPS measures –
positive reciprocity, negative reciprocity, altruism, and trust – is quantitatively or statistically
significantly associated with student achievement across countries. Thus, the cultural
components directly linked to intertemporal decision-making, rather than other preference
domains, appear most relevant for educational achievement.
Pooling the achievement data of all PISA waves (2000-2018) is justified because culture by
definition is focused on traits that are fairly unchanged over the long run. Moreover, the vast
majority of country variation in PISA scores is between countries rather than over time. Pooling
extends the country sample and provides more precise measures of long-run educational
achievement. Going from the 2015 wave to the pooled seven-wave sample expands the country
coverage from 41 to 49 countries and the student sample from just over 300,000 to nearly 2
million. Interestingly, results in the expanded sample (columns 5 and 6) are qualitatively the
same as in the 2015 PISA wave, indicating that the pooled analysis is not affected by the relative
timing of the observation of cultural and achievement data.
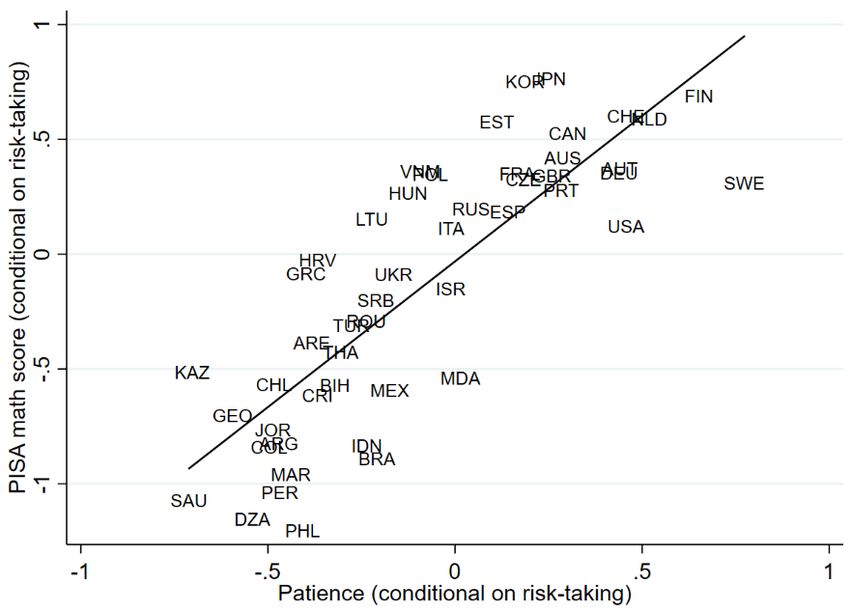
17The interrelationship of the intertemporal cultural traits and achievement is depicted
graphically in Figure 2. The upper panel shows simple bivariate scatterplots between average
PISA math scores (pooled across all waves) and the GPS measures of patience (left) and risk-
taking (right) at the country level. There is a strong positive association of student achievement
with patience and a weaker and less precise negative one with risk-taking. At the country level,
the R2s of the underlying regressions suggest that patience alone accounts for 40.9 percent of the
cross-country variance in achievement, whereas risk-taking alone accounts for only 6.2 percent
of the variance. Both associations become much stronger and more precise when conditioning on
the respective other cultural trait in the lower panel. 21 The two cultural traits together account for
two-thirds of the variance in average student achievement across countries (R2 = 0.672).
Interestingly, this is substantially larger than the sum of explained variance accounted by the two
measures separately, underscoring the interplay of the two cultural traits. The figures also show
that the overall associations are not driven by any strong outliers.
The coefficient estimates on the two cultural traits remain large and statistically highly
significant, but are reduced in size, when adding controls for proximate inputs to the model
(columns 7-8 of Table 1). As discussed above, the extended set of controls for family, school,
and institutional inputs (described in the table notes) are likely bad controls because they too are
outcomes of the deeper cultural traits. The reduction of the coefficients on patience by 39 percent
and on risk-taking by 33 percent (when comparing columns 5 and 8) in this descriptive analysis
indicates that a substantial part of the overall effects of the two cultural traits may work through
the channels of these proximate inputs. We provide a closer analysis of the association of the
different input factors with the two cultural traits in section 6 below.
If culture is driving the achievement results, one would expect the residence-country culture
to be less important for migrants whose parents are less steeped in that culture and whose
exposure to the new culture is less. When we look separately at native students and migrants, we
find a much stronger role of residence-country culture for native students than for migrant
students. Table 2 shows that among native students, a one s.d. increase in patience is associated
21
The added-variable plot in the lower left panel is created by first regressing both variables (math
achievement and patience) on risk-taking. The residuals of the two regressions are then plotted against each other.
These residuals represent the part of the variation in both variables that cannot be accounted for by risk-taking,
assuring that risk-taking does not drive the depicted association. This exercise is numerically equivalent to
regressing math achievement on patience and including risk-taking as a control variable. The equivalent procedure is
used in the lower right panel.
18with 1.30 s.d. higher achievement, and the same increase in risk-taking is associated with 1.32
s.d. lower achievement (column 1). By contrast, among students with a migrant background the
association is much lower (0.70 s.d.) for patience and only marginally significant (at 0.37 s.d.)
for risk-taking (column 2). 22
The difference in results between students with and without migration background is in line
with a leading role of culture as a deep determinant of student achievement rather than other
unobserved schooling factors of the country. It also motivates our migrant analysis below that
considers the cultural traits of the countries of origin from which the migrant students migrated.
4.3 Robustness Analysis
Country subsamples. To test whether our main results differ by level of development,
columns 3 and 4 of Table 2 present separate regressions for OECD countries and non-OECD
countries, respectively (measured as ever belonged to OECD). The qualitative pattern of our
findings is very similar and does not differ significantly between the two subsamples.
In additional subsample analyses, we re-estimated the pooled models in Table 1 (columns 5,
6, and 8) excluding one wave or one country at a time. Qualitative results are insensitive to this
alteration. The coefficients on patience and risk-taking remain significant in all these regressions
(not shown).
Additional subjects. Results are also very similar for achievement in science and reading
rather than math (columns 5 and 6 of Table 2). In science, a one s.d. increase in patience (risk-
taking) is associated with a test-score increase (decrease) by 1.12 s.d. (1.17 s.d.). In reading, the
corresponding coefficient is 1.11 s.d. (1.13 s.d.). Thus, the reported associations are universal in
the sense that they do not depend on a particular subject.
Accounting for test-taking effort. One interpretational concern with low-stakes
achievement tests such as PISA is that they might not only measure students’ cognitive skills but
also their effort on the test itself which in turn may depend on students’ conscientiousness,
intrinsic motivation, and other related skills (e.g., Borghans and Schils (2012); Akyol, Krishna,
and Wang (2018); Gneezy et al. (2019)). Among a number of measures of students’ test-taking
effort derived for the 2009 PISA wave, Zamarro, Hitt, and Mendez (2019) find that the extent of
item nonresponse (the share of unanswered questions) in the student background questionnaire
22
Students are classified as migrants if both parents were born abroad. The migrant analysis in section 5 shows
that our findings are insensitive to alternative definitions of the migrant population.
19You can also read