EMERGING AND FRONTIER MARKETS 2014 - 2015 - INSERT CLIENT LOGO

Page created by Daniel Cruz
 
CONTINUE READING
EMERGING AND FRONTIER MARKETS 2014 - 2015 - INSERT CLIENT LOGO
2014 - 2015

EMERGING AND
FRONTIER MARKETS
ASSESSING RISK AND OPPORTUNITY

A Corporate Occupier & Investor Services Publication

                                                       INSERT CLIENT LOGO
                                                                            2014 EMERGING AND FRONTIER MARKETS   1
EMERGING AND FRONTIER MARKETS 2014 - 2015 - INSERT CLIENT LOGO
There is no doubt that today’s global property markets
present both great opportunity and significant risk.
Established and mature markets are providing safety and
security for labor and capital, but many of the economies
in these markets are growing slower than expected and
competition is at an all time high.

To that end, emerging and frontier markets present
some of the most significant opportunities for real
estate. In this publication, CIS’s second global report
on emerging and frontier property markets, Cushman
& Wakefield compares the risk and opportunity in 42
of the most sought after secondary locations so that
property operators can gain a better understanding of
which markets provide the best opportunity for their
organizations. Our hope is that you find this information
useful in your forward-looking real estate strategies.

                                                            The coming months will
                                                            bring challenges, but the
                                                            business opportunities
                                                            in most markets will
                                                            outweigh the risks.
John Santora
President, Chief Executive Officer
Corporate Occupier & Investor Services
Cushman & Wakefield, Inc.

                                                                2014 EMERGING AND FRONTIER MARKETS   2
EMERGING AND FRONTIER MARKETS 2014 - 2015 - INSERT CLIENT LOGO
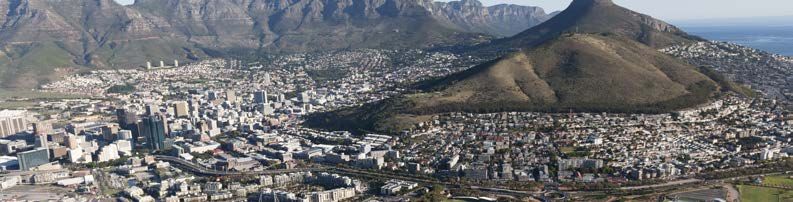
OVERVIEW AND RESULTS
Cushman & Wakefield has evaluated the risks of acquiring           RESULTS                                                             TOP 10 MOST EFFICIENT AND
office space in the most sought after emerging and frontier                                                                            TRANSPARENT MARKETS
markets. Our second edition of this report provides overviews      The top ten easiest and most transparent markets in which
of the office market and relevant property indicators for 42       to acquire real estate are presented to the right.
                                                                                                                                         RANK       COUNTRY             REGION
countries and collates this data into an occupancy “Risk Index”.   As the results demonstrate, locations within Africa occupy
This year’s report does not include an overview of the BRIC        the upper reaches of the index, with Botswana in first place             1       Botswana            Africa
economies (Brazil, Russia, India and China), as these countries    followed by fellow Sub-Saharan countries, South Africa and
are generally no longer considered “emerging” and many of          Zambia in second and third place, respectively. Indonesia ranks          2       South Africa        Africa
the major BRIC cities have long been established in the global     fifth, and is the highest placed country from Asia Pacific, with
property market.                                                                                                                            3       Zambia              Africa
                                                                   Peru in eighth as the top representative from Latin America.
The index utilizes best-in-class published data regarding          The leading country in the index, Botswana, scores well in               4       Ghana               Africa
operating conditions – such as transparency and corruption         a number of factors. Botswana is perceived as one of the
– in addition to economic and political stability. Cushman                                                                                  5       Indonesia           Asia Pacific
                                                                   more secure countries within Africa, and this is borne out via
& Wakefield also undertook a survey using ‘best in class’          the results of the index, scoring well across the majority of
property operators in each region. This survey posed pertinent                                                                              6       Algeria             Africa
                                                                   parameters and is comfortably the leading country within the
questions to determine the operating environment and the           Index. Both South Africa and Zambia score well in terms of the           7       Tunisia             Africa
ease and speed of acquiring office space in these markets. Each    ease of securing property and in comparison to the rest of the
country has been scored against one another on a like-for-like     continent, these countries possess two of the more developed             8       Peru                Americas
basis, with the results from the survey and third-party data       property markets in the region.
being appropriately weighted and indexed.                                                                                                   9       UAE                 Middle East
                                                                   In Latin America, the top three locations are Peru (8th overall),
                                                                   Mexico (15th overall) and Uruguay (18th overall). Peru                  10       Oman                Middle East
                                                                   scores impressively in the majority of the operating condition
                                                                   parameters. Mexico’s performance is inconsistent, ranking high      Source: Cushman and Wakefield 2014
                                                                   in some categories, for example, Market Transparency, and           A list of all 42 countries and their rankings can
                                                                   poorly in others, such as Registering Property and Political        be found on page 10.
                                                                   Stability. Uruguay is one of the more stable countries within
                                                                   Latin America, reflected by a healthy score within a number of
                                                                   the operating consideration parameters, such as Corruption
                                                                   and Political Stability.
                                                                   Indonesia is one of the more transparent markets within Asia
                                                                   and is the best performing country in that region. Following
                                                                   Indonesia is Thailand which placed 11th overall, courtesy of
                                                                   impressive scoring within a number of operating conditions
                                                                   parameters and is the second highest placed Asia Pacific
                                                                   country. The Philippines is third within Asia Pacific and 14th
                                                                   overall, and scores well in a number of the property related
                                                                   parameters with bureaucracy levels making business relatively
                                                                   easy to undertake.

                                  DUBAI MARINA, UAE
                                                                                                                                            2014 EMERGING AND FRONTIER MARKETS             3
EMERGING AND FRONTIER MARKETS 2014 - 2015 - INSERT CLIENT LOGO
ASSESSING RISK AND OPPORTUNITY
INTEREST REMAINS STRONG                                           OPERATING RISKS REMAIN HIGH                                        Corruption Risk
                                                                                                                                     The reputation of business partners, service
When the US Federal Reserve tapered its bond buying               The risks of operating real estate in emerging and frontier        providers, and other vendors remains
program in the beginning of 2014, global equity investors         markets remain high. The following key factors are at the          critical. The greater the threat of bribery,
pulled capital from many emerging and frontier markets in         forefront for any entity planning to lease, own, or operate        uncertainly, or unethical business practices
fear of rising rates and increased risk. However, Treasury        property in emerging and frontier markets:                         means operators will not be as confident in
bond yields have remained low and asset prices in emerging        Transparency Risk                                                  the decisions they are making, which in turn
and frontier markets have stabilized, and even increased          The reliability and accessibility of information surrounding the   will stifle investment and slow the pace of
in some cases. With the economies in mature markets               “rights” of property owners and lessees remains critical to        transactions.
continuing to grow well below their long-term averages,           evaluating business opportunities. Operators must assess the       Health/Safety Risk
occupiers and investors remain committed to expansion in          reliability of the information they are using to make decisions    Keeping employees safe and secure in their
emerging and frontier markets.                                    and be confident their rights are clearly defined.                 locations is critical. Assurance that employees
                                                                                                                                     have access to water and necessary amenities, as
While the recent global unrest in the Ukraine,                    Geo-Political Risk
Venezuela, and now Iraq has served to heighten awareness                                                                             well as adequate roads and infrastructure to get
                                                                  The recent political developments in Ukraine, Iraq, and
of the risks that exist in developing economies, there is still                                                                      them to and from properties is also significant.
                                                                  Venezuela have increased the risk of prolonged conflict and
                                                                                                                                     Operators need to know how they will keep
significant growth and opportunity across many of these           unrest. Operators must consider the stability of a country’s
                                                                                                                                     workers safe from crime, natural disaster, and
markets. Multi-nationals see strong population growth, an         government, how the rule of law is defended, and the threat of
                                                                                                                                     terrorism.
increasingly educated and affluent labor force, and more          unrest before making any decision.
transparent governments as driving factors for expansion.
Property investors see an undersupply of adequate real
estate to meet corporate demand and are actively developing
21st century buildings in many central business district
(CBD) locations.

Corporate real estate (CRE) departments within
multinationals are undertaking workplace strategies focused
on higher density per square foot (psf) and hoteling to lower
their real estate costs in slow growing mature markets and
using the savings to fund expansion into higher growing
emerging markets. The countries with increasing geo-political
risks have fallen out of favor with most occupiers (at least
temporarily). However, more and more emerging and frontier
countries are being considered for corporate expansion and
investment than are not.

                                                                                                                                                        MANILA, PHILIPPINES

                                                                                                                                          2014 EMERGING AND FRONTIER MARKETS        4
EMERGING AND FRONTIER MARKETS 2014 - 2015 - INSERT CLIENT LOGO
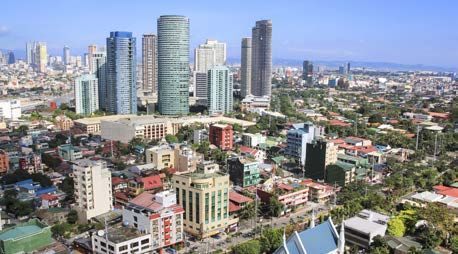
GLOBAL SECURITY RISK
THE YEAR AHEAD PRESENTS SIGNIFICANT SECURITY RISKS FOR EMERGING MARKETS

Recent political unrest in the Middle-East and across the         terrorism also exists within these countries. According to the
world has increased the security risks related to both            CIA, one of the major risks in Mexico is kidnapping, where
corporate assets and also employees, especially in the            this crime ranks highest in world.
emerging and frontier markets. A changing world order
also continues to alter the threats companies face. Existing      CORPORATION SPECIFIC RISKS
political systems in many countries are under pressure            Properties associated with more controversial industries (i.e.,
                                                                                                                                                    RAYMOND W. KELLY
and states with poor governance and cultural tensions are         oil, gas, exploration) are at higher risk than those associated
                                                                                                                                                    President
susceptible to terrorism and other crimes, such as piracy,        with more benign industries (i.e., consumer products or                           Risk Management Services, CIS
kidnapping and bombing. Advances in technology and                telecom). Political anger towards a corporation’s country
telecommunications are also changing societies and opening-       of origin (i.e., the US in many cases) can also make assets
                                                                  more susceptible to bombing, piracy, and theft. Security
up new markets. This is a positive change, but one that also
introduces new threats. Cyber security is a critical issue        when travelling to and from properties, and even while at          The right security
and as companies become more global they leave a digital          home, should also be considered for key employees and their
                                                                  families to prevent kidnapping.
                                                                                                                                     plan addresses on-site
footprint that can make them accessible to anyone from
anywhere. For all these reasons operators of property must        PROPERTY AND SECURITY PLANS
                                                                                                                                     and off-site security,
redesign and continually review their approach to many of         Any organization locating in an emerging or frontier market        business continuity,
these markets.                                                    must establish a comprehensive property and employee
                                                                  security plan. Adequate security plans must address the physical
                                                                                                                                     crisis management, and
MAJOR RISKS
From a terrorism perspective four countries in the Index,         asset, the employees, and the company’s digital and other          recovery assistance.
Nigeria, Thailand, The Philippines, and India are already         information. The right plan and protocols begin with pre-
considered to be higher risk and due to deteriorating political   occupancy planning and addresses on-site and off-site security,
situations in Kenya, Libya and Lebanon, a heightened risk of      business continuity, crisis management, and recovery assistance.

                                                                                    WORLD TRADE CENTER, BAHRAIN
                                                                                              MANAGED BY CUSHMAN & WAKEFIELD           2014 EMERGING AND FRONTIER MARKETS    5
EMERGING AND FRONTIER MARKETS 2014 - 2015 - INSERT CLIENT LOGO
LATIN AMERICA
   Despite its recent stumble, Brazil remains a key driver         Of the remaining “established” property markets, Bogota’s           Peru, Chile and
   of the LATAM economy and its influence in the region            CBD ranks highest in terms of cost, with prime rental
   reaches far and wide. For more than a decade, the world         rates of approximately $32 USD/sq.m/year. The remaining             Colombia are bright
   has been witness to the often double-digit growth and           major property markets are Mexico City, Lima, and Buenos            spots for LATAM,
   influence of the Brazilian economy and the rise of the São      Aires. Bolivia, El Salvador, Nicaragua, Panama, and Uruguay
   Paulo and Rio De Janeiro property markets to be among           round-out the list of countries most commonly sought                but on the whole
   the most expensive in the world. Brazil’s economy today,        by occupiers and investors.Yet, these markets are truly
   while still growing, is suffering from malaise brought about    considered “frontier”. Their governments and economies
                                                                                                                                       inflation is the
   by inconsistent economic policy, rising inflation, and an       remain unstable, and aside from those corporations in               biggest economic
   oversupply of office space that is proving hard to absorb.      search of commodities and natural resources, real estate
   While Brazil’s economy will likely get a boost from the 2014    activity is still limited.
                                                                                                                                       concern for the
   World Cup and the 2016 Olympics, many corporations are
                                                                   LATAM markets are heavily dependent on the region’s
                                                                                                                                       region.
   now investing in other economies in the region.
                                                                   largest trading partner, China. The future of growth in the
   Rising inflation appears to be the biggest issue facing LATAM   region depends in large part on how China’s economy
   economies. Peru, Chile, and Colombia are the bright spots       performs. Commodities have contributed a large part to the
   in the region, all having sound government finances, strong     region’s growth, along with manufacturing and production.
   capital flows, and stable economic policies. GDP growth         With commodity prices down 25% from 2011, the real issue
   for Peru has slowed, but led the region at 5.8% in 2013. In     for LATAM may be that it is entering a period of prolonged
   a forecast provided by Oxford Economics for 13 emerging         slow growth. Property market conditions vary from market-
   market economies around the world, Peru ranked fifth,           to-market, but even in mature markets the quality of
   followed closely by Chile (7th) and Colombia (8th).             office stock is mixed. Ownership also remains an issue for
                                                                   occupiers. Professional landlords do have a presence, but
   São Paulo and Rio De Janeiro are still the most expensive
                                                                   many assets are still owned by local families or individuals,
   office markets in LATAM, with prime rental rates of
                                                                   making the transaction process slow, and at times uncertain.
   approximately 90 and 100 USD/Sq.m/month, respectively.

MEXICO CITY, MEXICO                                                                                                                2014 EMERGING AND FRONTIER MARKETS   6
EMERGING AND FRONTIER MARKETS 2014 - 2015 - INSERT CLIENT LOGO
AFRICA AND THE MIDDLE EAST
  Over the past 12 months, the Africa and Middle East             abundance and quality of office space is still clearly evident.       The unrest in the
  region has continued to face a number of challenges with        From those locations such as the United Arab Emirates and
  geopolitical difficulties and economic uncertainty apparent     South Africa who possess the most developed property                  Middle East has had
  in some locations. However, GDP growth within Africa is         sectors to those more emergent countries where quality                a negative effect on
  expected to be over 4% in 2014 and increasing to 5% in          and availability of space remain scarce, each market has its
  2015 according to figures from the International Monetary       own characteristics. However, demand for space within                 economic growth in
  Fund (IMF). Therefore, despite the ongoing global economic      Africa has continued to grow over the past year with an
  uncertainty, the outlook for the Africa over the next year      increasing number of international companies seeking to
                                                                                                                                        some parts of the
  or so is one of strengthening regional growth. The Middle       operate within the region and requiring good quality space            region, and occupier
  East region has seen a divergence in performance in terms       to operate from.
  of growth since the initial Arab Spring in 2011, with those
                                                                                                                                        demand has eased as
                                                                  The Middle East continues to see unrest and this has
  affected by geopolitical unrest witnessing weak economic
                                                                  had a negative effect on economic growth in some parts
                                                                                                                                        a result.
  growth with the more wealthy countries seeing strong
                                                                  the region and occupier demand has eased as a result.
  increases on the back of robust oil prices and various fiscal
                                                                  Furthermore, a number of countries within the region are
  stimulus.
                                                                  scheduled to have either parliamentary or presidential
  Infrastructure quality remains a key barrier to entry for       elections in 2014 and the subsequent reaction will go
  a number of sectors, such as those from the services and        some way to determine the political stability of the region.
  the industrial divisions. Furthermore, significant spending     However, the more stable countries situated away from
  is required to accelerate development and with public           unrest have seen requirements for office space continue
  spending levels unlikely to bridge the immediate gap, public/   to move up. After a recent downturn in prime rents in
  private partnerships are anticipated to become more             line with the depths of the global economic slowdown,
  prevalent in order to increase the rate of progression.         growth was more positive in 2013 and the more developed
                                                                  markets are expected to see rents hold up over the
  Property markets across the region have continued to
                                                                  remainder of the year as occupier demand is anticipated to
  develop over the year, although a distinct variety in the
                                                                  remain robust.

CAPETOWN, SOUTH AFRICA                                                                                                              2014 EMERGING AND FRONTIER MARKETS   7
ASIA PACIFIC
   In its latest World Economic Outlook, the IMF projects            and Pune following closely behind as Tier 2 cities. Ongoing           With labor costs
   growth in Asia’s emerging economies to hit 6.7%, well above       developments such as Gujarat International Finance Tec-City I
   the 4.9% forecasted average for all emerging markets.With         in Ahmedabad and SmartCity Kochi could help to unleash the            rising in China,
   labor costs rising in China, many of the developing economies     potential of each city.With increasing business activity across       several developing
   in Southeast Asia will see increased foreign investment.          the IT-ITeS sector in cities like Kochi,Trivandrum, Chandigarh,
   Overall, the region is expected to benefit from the significant   Jaipur, and Indore, significant increases in their office stock       markets in the
   infrastructure programs and economic initiatives that most        have occurred over the last five years- although the size of
   governments are undertaking.                                      these real estate markets are still comparatively small.
                                                                                                                                           region will see
   Outside of India and China, the leading economies in              China’s economic performance in the last two decades has
                                                                                                                                           increased foreign
   Asia are Thailand, Bangladesh, and Sri Lanka.While not            traditionally been linked to its Tier 1 cities such as Shanghai       investment.
   “emerging” in their own right, India and China possess Tier       and Beijing. In recent years, however, opportunities in these
   2 and Tier 3 cities that are beginning to grow significantly.     cities have become scarce.While there is no formal definition
   A number of companies catering to the manufacturing and           for the different “tiers” in China, it is generally regarded
   service sectors have been steadily establishing a presence        that Beijing, Shanghai, and the coastal cities Guangzhou and
   in these cities, which offer lower cost talent, cheaper land,     Shenzhen are Tier 1 cities.Tier 2 cities include destinations
   and lower operating costs, among other things. Due to the         such as Dalian, Chengdu,Wuhan,Tianjin, with the Tier 3 cities
   increasing population, rising employment opportunities and        being Kunming, Nanning and Changzhou.
   improvements in infrastructure, many Tier 2 and 3 cities
                                                                     Continued social and economic reforms are expected to
   are seeing strong interest from individual investors, while
                                                                     positively transform the overall investment and business
   established investors from Tier 1 cities have begun developing
                                                                     landscapes in China’s secondary cities.This is evidenced by the
   prime office space to serve the increasing demand.
                                                                     increasing presence of major retailers, such as Wal-Mart in
   India has 54 cities with a population of more than one            secondary cities.
   million, of which five (Bengaluru, Chennai, Delhi, Kolkata
   and Mumbai) are considered Tier 1 cities, with Hyderabad

JAKARTA, INDONESIA                                                                                                                     2014 EMERGING AND FRONTIER MARKETS   8
RISK RANKING AND COUNTRY PROFILES

  INSTRUCTIONS:
  To access country page,
  click on country name below.

CUSHMAN & WAKEFIELD EMERGING AND FRONTIER MARKET RISK RANKING (1 = lowest risk, 42 = highest risk)
RANK COUNTRY                                RANK COUNTRY                                RANK COUNTRY                                RANK COUNTRY                                RANK COUNTRY

  1    BOTSWANA                              10    OMAN                                  19    NICARAGUA                             28    QATAR                                  37    HONDURAS
  2    SOUTH AFRICA                          11    THAILAND                              20    BANGLADESH                            29    BAHRAIN                                38    ZIMBABWE
  3    ZAMBIA                                12    MOROCCO                               21    COTE D’IVOIRE                         30    EL SALVADOR                            39    DEM. REP. OF CONGO
  4    GHANA                                 13    EGYPT                                 22    UGANDA                                31    TANZANIA                               40    MYANMAR
  5    INDONESIA                             14    PHILIPPINES                           23    KENYA                                 32    JORDAN                                 41    ANGOLA
  6    ALGERIA                               15    MEXICO                                24    SAUDI ARABIA                          33    NIGERIA                                42    LIBYA
  7    TUNISIA                               16    SENEGAL                               25    VIETNAM                               34    ARGENTINA
  8    PERU                                  17    SRI LANKA                             26    COLOMBIA                              35    BOLIVIA
  9    UNITED ARAB EMIRATES                  18    URUGUAY                               27    PANAMA                                36    LEBANON
                                                                                                                                                                      2014 EMERGING AND FRONTIER MARKETS                 9
Note: The above ranking applies to the risk of operating real estate in these markets, which center on transparency, political risk, and corruption, among others. This ranking is not an indication of investment risk.
AFRICA & MIDDLE EAST
                                         EMERGING AND FRONTIER MARKET - 2014
            BOTSWANA                     BOTSWANA                                                                                                                             B ACK TO MAP

               1
                                         PROPERTY MARKET OVERVIEW                                                              MARKET DYNAMICS
                                         The principal office market within Botswana is in the capital city, Gaborone.
                                         Recently, the large scale developments in the construction of the new
                                         CBD have continued. This has resulted in considerable oversupply within                            Transparency
                                         the market, especially for secondary space. The economy has started to
             C&W                         stabilise after a period of fluctuation and the effect of the austerity measures        Ease of Owning Property
      EMERGING MARKETS                   are slowly easing. Furthermore, the characteristics of a two tier market
                                                                                                                                 Ease of Leasing Property
        RISK RANKING                     are becoming more apparent, with demand from multinational occupiers
  (1 = LOWEST RISK, 42 = HIGHEST RISK)   remaining robust. Consequently, well located and high quality space remains           Speed of Lease Transaction
                                         sought after with pressure growing on prime rents, whereas secondary space
                                         continues to be difficult to let.                                                           Level of Bureaucracy

                                                                                                                                                            0         1   2     3         4      5
                                         2014 OUTLOOK                                                                                                       POOR                          EXCELLENT

                                         The outlook for the office sector in Gaborone is for the market to become
                                         increasingly polarised between prime and secondary space. As economic                 PRIMARY LANDLORD TYPE
                                         growth stabilizes, this will help to improve business confidence, and with
                                         Botswana being one of Africa’s most stable countries, the outlook is positive.
                                         However, activity will focus primarily on prime space, with the proliferation of      Local operators although emergent investment sector
                                         secondary space likely to remain largely vacant.

                                                                                                                               TRADING COSTS

                                                                                                                               TRANSFER TAX             5%
                                                                                                                               NOTARY                   1 - 3%
COUNTRY DATA
                                                                                                                               LEGAL                    1 - 2%
TOP CITIES BY POPULATION                                                                                                       AGENCY                   8.33 - 10%

Gaborone           225,000                                                                                                     VAT                      12%

Francistown        100,000
                                          KEY MARKETS
MAIN INDUSTRIES                           CITY                            SUBMARKET           MEASUREMENT             RENT             RENT                     RENTAL RENTAL OUTLOOK
                                                                                                                      Q1 2013          Q1 2014                  CHANGE FOR 2014
Diamond mining, minerals,
agriculture                               Gaborone                        N/A                 USD/sq.m/year           174.00           162.00                   -7%       Stable / Down

                                                                                                                                                     2014 EMERGING AND FRONTIER MARKETS               10
AFRICA & MIDDLE EAST
                                         EMERGING AND FRONTIER MARKET - 2014
          SOUTH AFRICA                    SOUTH AFRICA                                                                                                                             B ACK TO MAP

               2
                                         PROPERTY MARKET OVERVIEW                                                                   MARKET DYNAMICS
                                         The South African property market is the most developed within Africa,
                                         focussed around the key cities of Johannesburg (Sandton), Durban and
                                         Cape Town. The key business and commercial centre in South Africa is                                    Transparency
                                         Johannesburg, where demand from corporate occupiers is highest. Across
              C&W                        the country, the office market has continued its slow recovery, with demand                  Ease of Owning Property
       EMERGING MARKETS                  rising and vacancy rates easing, although overall availability remains relatively
                                                                                                                                      Ease of Leasing Property
         RISK RANKING                    high. This decline is availability is the first since 2011, with the current level of
  (1 = LOWEST RISK, 42 = HIGHEST RISK)   excess supply curtailing any rental growth which is only marginally positive in            Speed of Lease Transaction
                                         nominal terms.
                                                                                                                                          Level of Bureaucracy

                                         2014 OUTLOOK                                                                                                            0         1   2        3   4      5
                                                                                                                                                                 POOR                       EXCELLENT
                                         The market outlook for the South African office market is dependent on
                                         economic performance and business confidence. Recent economic growth
                                         has been sluggish and the outlook is for similar levels of growth over the next            PRIMARY LANDLORD TYPE
                                         year or so. Consequently, demand from multinational occupiers is expected
                                         to be steady, with the focus on well located high quality space. Although,
                                                                                                                                    International Investors with regional and local operators.
                                         vacancy rates for prime space may come under pressure if occupier demand
                                         eases significantly over the next year.

                                                                                                                                    TRADING COSTS

                                                                                                                                    TRANSFER TAX             0 - 8%
                                                                                                                                    NOTARY                   Fixed Fees
COUNTRY DATA
                                                                                                                                    LEGAL                    1 - 2%
TOP CITIES BY POPULATION
                                                                                                                                    AGENCY                   15%
Johannesburg        4,400,000
                                                                                                                                    VAT                      14%
Cape Town           3,740,000
                                          KEY MARKETS
Durban              3,442,000
                                          CITY                              SUBMARKET             MEASUREMENT              RENT             RENT                     RENTAL RENTAL OUTLOOK
MAIN INDUSTRIES
                                                                                                                           Q1 2013          Q1 2014                  CHANGE FOR 2014
Mining, automobile assembly,              Cape Town                         CBD                   ZAR/sq.m/month           85.00            100.00                   18%       Stable
metalworking, machinery, textiles,
                                          Johannesburg                      CBD                   ZAR/sq.m/month           65.00            75.00                    15%       Stable
iron and steel, chemicals, fertilizer,
foodstuffs, commercial ship repair        Sandton                           CBD                   ZAR/sq.m/month           125.00           180.00                   44%       Stable
                                                                                                                                                          2014 EMERGING AND FRONTIER MARKETS            11
AFRICA & MIDDLE EAST
                                         EMERGING AND FRONTIER MARKET - 2014
              ZAMBIA                      ZAMBIA                                                                                                                            B ACK TO MAP

               3
                                         PROPERTY MARKET OVERVIEW                                                           MARKET DYNAMICS
                                         The key office market in Zambia is the capital city and commercial centre,
                                         Lusaka. The property market in Zambia is one of the more developed within
                                         Africa, although the majority of stock remains of secondary quality. The Lon-                   Transparency
                                         gacres and between the Great East Road and the Mass Media area remain the
               C&W                       most sought after for occupiers. Recently, there has been rising demand from         Ease of Owning Property
        EMERGING MARKETS                 both the financial services and communications sector and a number of the
                                                                                                                              Ease of Leasing Property
          RISK RANKING                   newly completely buildings are steadily being let. However, economic growth
  (1 = LOWEST RISK, 42 = HIGHEST RISK)   has waned recently, and the depreciation in the value of the Kwacha has put        Speed of Lease Transaction
                                         pressure on rental values in real terms.
                                                                                                                                  Level of Bureaucracy

                                         2014 OUTLOOK                                                                                                    0          1   2     3         4      5
                                                                                                                                                         POOR                           EXCELLENT
                                         Zambia is heavily dependent on the copper industry and consequently the
                                         country is exposed to external commodity market fluctuations and economic
                                         growth has not been as strong as initially anticipated. However, there remains     PRIMARY LANDLORD TYPE
                                         a high potential for growth over the next few years, should copper values
                                         rise on a sustained basis. There are a number of new developments underway
                                                                                                                            Mixed institutional and private individuals.
                                         within Lusaka, and once these are delivered rental values are expected to
                                         remain stable over the short term.

                                                                                                                            TRADING COSTS

                                                                                                                            TRANSFER TAX             5%
                                                                                                                            NOTARY                   N/A
COUNTRY DATA
                                                                                                                            LEGAL                    1 - 2%
TOP CITIES BY POPULATION
                                                                                                                            AGENCY                   8.33 - 12%
Lusaka             1,260,000
                                                                                                                            VAT                      16%
Kitwe              467,000
                                          KEY MARKETS
Ndola              441,000
                                          CITY                           SUBMARKET          MEASUREMENT            RENT             RENT                     RENTAL RENTAL OUTLOOK
MAIN INDUSTRIES
                                                                                                                   Q1 2013          Q1 2014                  CHANGE FOR 2014
Mainly copper mining and                  Lusaka                         N/A                USD/sq.m/year          240.00           216.00                   -10%       Stable / Down
processing, emerald mining,
construction, foodstuffs, beverages,
chemicals, textiles, fertilizer,
horticulture                                                                                                                                      2014 EMERGING AND FRONTIER MARKETS                12
AFRICA & MIDDLE EAST
                                         EMERGING AND FRONTIER MARKET - 2014
              GHANA                       GHANA                                                                                                                              B ACK TO MAP

               4
                                         PROPERTY MARKET OVERVIEW                                                              MARKET DYNAMICS
                                         The office market in Accra is one of the more developed within Africa, and
                                         also serves as the business and administrative centre of Ghana. The tradi-
                                         tional CBD is based around the High Street within Accra, although this areas                       Transparency
                                         suffers from severe traffic congestion. As a result, there have been a number
               C&W                       of new developments in the city but they have been predominately located in             Ease of Owning Property
        EMERGING MARKETS                 more suburban areas close to the international airport, where larger floor-
                                                                                                                                 Ease of Leasing Property
          RISK RANKING                   plates can be obtained. The large One Airport Square development, a mixed
  (1 = LOWEST RISK, 42 = HIGHEST RISK)   use scheme of 20,000sq.m is scheduled for completion in late 2014. Both               Speed of Lease Transaction
                                         domestic and international occupiers have been active of the past year as the
                                         economy continues to diversify.                                                             Level of Bureaucracy

                                                                                                                                                            0        1   2        3   4      5
                                         2014 OUTLOOK                                                                                                       POOR                      EXCELLENT

                                         The market in Accra is expected to remain stable over the remainder of the
                                         year. The recent depreciation of the Ghana Cedi has resulted in investment            PRIMARY LANDLORD TYPE
                                         levels slowing and this sector is currently undergoing a period of stagnation. If
                                         the currency continues to lose value then these conditions will have a detri-
                                         mental effect on the economy and may slow occupier demand.                            Some foreign institutions, local institutions (SSNIT) and
                                                                                                                               private landlords.

                                                                                                                               TRADING COSTS

                                                                                                                               TRANSFER TAX             .025 - 1%
                                                                                                                               NOTARY                   N/A
COUNTRY DATA
                                                                                                                               LEGAL                    3 - 10%
TOP CITIES BY POPULATION                                                                                                       AGENCY                   8.33 - 12%

Kumasi                      3,780,000                                                                                          VAT                      15%

Accra                       2,995,800
                                          KEY MARKETS
Sekondi-Takoradi            1,895,000     CITY                            SUBMARKET            MEASUREMENT            RENT             RENT                     RENTAL RENTAL OUTLOOK
                                                                                                                      Q1 2013          Q1 2014                  CHANGE FOR 2014
MAIN INDUSTRIES
                                          Accra                           N/A                  USD/sq.m/year          420.00           444.00                   6%       Stable
Petroleum becoming more
important, plus mining, lumbering,
light manufacturing, aluminum
                                                                                                                                                     2014 EMERGING AND FRONTIER MARKETS           13
smelting, food processing, cement;
ASIA PACIFIC
                                         EMERGING AND FRONTIER MARKET - 2014
            INDONESIA                    INDONESIA                                                                                                                             B ACK TO MAP

               5
                                         PROPERTY MARKET OVERVIEW
                                         While the Indonesian office market is in a “wait-and-see” mode until after its
                                                                                                                                MARKET DYNAMICS
                                         2014 general elections, demand for space has been positive and in-line with
                                         the country’s growing economy. Occupancy costs over the last three years                            Transparency
                                         have increased significantly due to a limited availability of supply. Strata-title
                C&W                      transactions have remained active, with demand continuing to be driven by                Ease of Owning Property
         EMERGING MARKETS                end-users, together with some investors converting US Dollar savings into
                                                                                                                                  Ease of Leasing Property
           RISK RANKING                  investments at Rupiah pricing.
  (1 = LOWEST RISK, 42 = HIGHEST RISK)                                                                                          Speed of Lease Transaction
                                         2014 OUTLOOK                                                                                 Level of Bureaucracy
                                         Absorption of 200,000–350,000 square meters (sq.m.) per annum is forecast
                                         for the next two years, with overall occupancy for Jakarta’s CBD set to re-                                         0         1   2        3   4      5
                                         main at about 90%. Rents are expected to show lower growth in 2014-2015                                             POOR                       EXCELLENT

                                         in the face of the higher supply, continuing increments in electricity costs
                                         and the impact to building operational costs. The return to a supply-demand            PRIMARY LANDLORD TYPE
                                         balance in 2014-2015 may well offer near-term rental-growth relief to office
                                         occupiers. Average strata prices are still projected to see further increase but
                                         at a much slower rate than that recorded in the last two years.                        Majority are local operators and few are sophisticated
                                                                                                                                Investors

                                                                                                                                TRADING COSTS

                                                                                                                                TRANSFER TAX             N/A
                                                                                                                                NOTARY                   N/A
COUNTRY DATA
                                                                                                                                LEGAL                    N/A
TOP CITIES BY POPULATION                                                                                                        AGENCY                   5%

Jakarta             9,607,800                                                                                                   VAT                      10%

Bandong             2,394,900
                                          KEY MARKETS
Bekasi              2,334,900             CITY                  SUBMARKET                       MEASUREMENT             RENT            RENT                     RENTAL RENTAL OUTLOOK
                                                                                                                        Q1 2013         Q1 2014                  CHANGE FOR 2014
MAIN INDUSTRIES
                                          Jakarta               CBD - Grade A Premium           USD/sq.m/month          44.13           48.65                    10%       Stable
Natural Resources: Oil&Gas,               Jakarta               CBD Thamrin - Grade A           USD/sq.m/month          42.53           45.72                    8%        Stable
mining, palm oil; Banking & finance;      Jakarta               CBD Sudirman - Grade A          USD/sq.m/month          37.41           39.80                    6%        Stable
Manufacturing
                                                                                                                                                      2014 EMERGING AND FRONTIER MARKETS            14
AFRICA & MIDDLE EAST
                                         EMERGING AND FRONTIER MARKET - 2014
              ALGERIA                    ALGERIA                                                                                                                             B ACK TO MAP

               6
                                         PROPERTY MARKET OVERVIEW                                                          MARKET DYNAMICS
                                         The capital city, Algiers, is the primary commercial and business location
                                         within Algeria. The oil and gas sector is the dominant constituent within the
                                         economy and occupier demand has remained focussed around these sectors.                           Transparency
                                         The key submarkets within Algiers are Hydra, Pins Maritime and Bab Ezzouar.
                C&W                      The market has been generally quiet over the past year, although there has             Ease of Owning Property
         EMERGING MARKETS                been some corporate built-to-suit activity in areas close to the airport where
                                                                                                                                Ease of Leasing Property
           RISK RANKING                  infrastructure levels and building quality are highest within Algiers.
  (1 = LOWEST RISK, 42 = HIGHEST RISK)                                                                                        Speed of Lease Transaction

                                         2014 OUTLOOK                                                                               Level of Bureaucracy
                                         The expectation for the year ahead is for market conditions to remain
                                         largely unchanged, with tenants seeking better quality space via consolidation                                    0         1   2        3   4      5
                                         or relocation to more suburban submarkets where more abundant space                                               POOR                       EXCELLENT

                                         is available and congestion is lower than in the CBD. Although the current
                                         political climate is a factor that may alter market conditions if the situation   PRIMARY LANDLORD TYPE
                                         were to worsen. However, with market conditions expected to be
                                         unchanged rental values are anticipated to remain stable across the
                                                                                                                           Local Private Operators
                                         remainder of the year.

                                                                                                                           TRADING COSTS

                                                                                                                           TRANSFER TAX                5 - 10%
                                                                                                                           NOTARY                      1 - 3%
COUNTRY DATA
                                                                                                                           LEGAL                       1 - 3%
TOP CITIES BY POPULATION                                                                                                   AGENCY                      8.3%

Algiers            2,700,000                                                                                               VAT                         17%

Oran               1,165,000
                                          KEY MARKETS
Setif              856,000                CITY                 SUBMARKET                      MEASUREMENT            RENT             RENT                     RENTAL RENTAL OUTLOOK
                                                                                                                     Q1 2013          Q1 2014                  CHANGE FOR 2014
MAIN INDUSTRIES
                                          Algiers              N/A                            USD/sq.m/year          384.00           465.00                   21%       Stable
Petroleum, natural gas, light
industries, mining, electrical,
petrochemical, food processing
                                                                                                                                                    2014 EMERGING AND FRONTIER MARKETS            15
AFRICA & MIDDLE EAST
                                         EMERGING AND FRONTIER MARKET - 2014
              TUNISIA                    TUNISIA                                                                                                                              B ACK TO MAP

               7
                                         PROPERTY MARKET OVERVIEW                                                            MARKET DYNAMICS
                                         Tunis, the capital city of Tunisia, is the business and administrative centre of
                                         the country. Since the revolution in 2011, the country has undergone a politi-
                                         cal transition, and this was reflected in a slowdown in activity as businesses                      Transparency
                                         adopted a ‘wait and see’ approach to expansion plans. Over the past year
               C&W                       or so and as the political climate has slowly stabilised, occupier demand has            Ease of Owning Property
        EMERGING MARKETS                 risen and the limited supply within the market has been put under pressure
                                                                                                                                  Ease of Leasing Property
          RISK RANKING                   and rents have risen as a result. The scheme in Les Berges du Lac has seen
  (1 = LOWEST RISK, 42 = HIGHEST RISK)   notable demand from multinational corporations as a result of the quality of           Speed of Lease Transaction
                                         space available but also the proximity to the international airport. The Centre
                                         Urbain Nord is providing larger floor-plates for those occupiers with larger                 Level of Bureaucracy
                                         requirements.
                                                                                                                                                             0        1   2      3      4      5
                                                                                                                                                             POOR                       EXCELLENT

                                         2014 OUTLOOK
                                         With occupier demand expected to remain steady over the remainder of the            PRIMARY LANDLORD TYPE
                                         year, it is anticipated that rental levels will remain under pressure and further
                                         rises are likely to occur. However, in the longer term and as the new space
                                                                                                                             Mostly private individuals
                                         arrives on to the market the pressure on rental values should ease.

                                                                                                                             TRADING COSTS

                                                                                                                             TRANSFER TAX                5%
                                                                                                                             NOTARY                      1%
COUNTRY DATA
                                                                                                                             LEGAL                       1 - 2%
TOP CITIES BY POPULATION                                                                                                     AGENCY                      8.33%

Tunis              728,000                                                                                                   VAT                         18%

Sfax               271,000
                                          KEY MARKETS
Sousse             173,000                CITY                 SUBMARKET                       MEASUREMENT             RENT             RENT                     RENTAL RENTAL OUTLOOK
                                                                                                                       Q1 2013          Q1 2014                  CHANGE FOR 2014
MAIN INDUSTRIES
                                          Tunis                N/A                             USD/sq.m/year           120.00           126.60                   6%       Stable / Up
Petroleum, mining (particularly
phosphate and iron ore), tourism,
textiles, footwear, agribusiness,
                                                                                                                                                      2014 EMERGING AND FRONTIER MARKETS            16
beverages
CENTRAL & SOUTH AMERICA
                                         EMERGING AND FRONTIER MARKET - 2014
                 PERU                    PERU                                                                                                                               B ACK TO MAP

               8
                                         PROPERTY MARKET OVERVIEW                                                           MARKET DYNAMICS
                                         Through the first quarter of 2014, a significant amount of new office projects
                                         were completed and a host of new premium projects started. Developers
                                         are beginning to venture into new submarkets in-and-around Lima that are                        Transparency
                                         less congested and possess more land in which to build. Absorption of office
              C&W                        space has been active compared to the previous year as more multination-             Ease of Owning Property
       EMERGING MARKETS                  als have shown interest in setting up offices in Lima. The Surco submarket is
                                                                                                                              Ease of Leasing Property
         RISK RANKING                    growing rapidly and has a number of premier class A projects under construc-
  (1 = LOWEST RISK, 42 = HIGHEST RISK)   tion. While Magdalena is a district that is also seeing strong interest and has    Speed of Lease Transaction
                                         several of its own class A projects underway.
                                                                                                                                  Level of Bureaucracy

                                         2014 OUTLOOK                                                                                                    0         1   2      3      4      5
                                                                                                                                                         POOR                        EXCELLENT
                                         Peru’s Ministry of Economy and Finance projects that the country’s economy
                                         will generate GDP growth above 5% through the first three months of 2014,
                                         and that this pace will continue throughout the remainder of the year. New         PRIMARY LANDLORD TYPE
                                         stock added to the market is up over 300% from 12 months ago, with more
                                         being planned for 2015 and beyond. Almost 100% of this has taken place in
                                                                                                                            Sophisticated investors and local operators
                                         LIMA’s class A market, where rental rates are up 12.8% year-over-year to
                                         $21.44 USD/sq.m/month.

                                                                                                                            TRADING COSTS

                                                                                                                            TRANSFER TAX             3%
                                                                                                                            NOTARY                   US $300 average + tax
COUNTRY DATA
                                                                                                                            LEGAL                    US $300 average per hour + taxes
TOP CITIES BY POPULATION
                                                                                                                            AGENCY                   1 month
Lima                 9,735,600
                                                                                                                            VAT                      7%
Trujillo             935,100
                                          KEY MARKETS
Arequipa             910,000
                                          CITY                SUBMARKET                      MEASUREMENT            RENT            RENT                     RENTAL RENTAL OUTLOOK
MAIN INDUSTRIES                                                                                                     Q1 2013         Q1 2014                  CHANGE FOR 2014
Construction and Construction             Lima                San Isidro                     USD/sq.m/month         21.00           23.32                    11%       Up
Materials Industries.Textile Industry,
                                          Lima                San Isidro Golf                USD/sq.m/month         22.50           22.46                    0%        Stable / Up
Food Industry, Chemical and
Pharmaceutical Products Industry,         Lima                Surco                          USD/sq.m/month         18.00           21.69                    21%       Up
Fishing Industry, Mining                                                                                                                          2014 EMERGING AND FRONTIER MARKETS             17
AFRICA & MIDDLE EAST
                                         EMERGING AND FRONTIER MARKET - 2014
                 UAE                     UAE                                                                                                                                 B ACK TO MAP

               9
                                         PROPERTY MARKET OVERVIEW
                                         Dubai has seen considerable improvement since 2012, with activity levels and
                                                                                                                             MARKET DYNAMICS
                                         business confidence rising. Rental values moved up across most submarkets in
                                         2013, with the highest rises seen at the lower end of the market in areas such                     Transparency
                                         as Business Bay and Jumeirah Lake Towers. The mature free zone locations
               C&W                       remain popular with international companies. In Abu Dhabi, the market is                Ease of Owning Property
        EMERGING MARKETS                 more subdued than in Dubai. A number of international occupiers have chosen
                                                                                                                                 Ease of Leasing Property
          RISK RANKING                   to locate regional headquarters in Dubai and then operate a smaller satellite
  (1 = LOWEST RISK, 42 = HIGHEST RISK)   operation in Abu Dhabi. There have been a number of recent developments               Speed of Lease Transaction
                                         completed in Abu Dhabi and these have soaked up the latent demand and as a
                                         result rents are largely unchanged over the year.                                           Level of Bureaucracy

                                                                                                                                                            0        1   2        3   4      5
                                         2014 OUTLOOK                                                                                                       POOR                      EXCELLENT

                                         The outlook for the year is for rents to continue to rise in Dubai, especially in
                                         those submarkets where demand is high. In November 2013 Dubai securing              PRIMARY LANDLORD TYPE
                                         Expo2020 and this has stimulated new activity that had previously been
                                         postponed, although these are predominately residential. The Abu Dhabi market
                                         is anticipated to be more stable with limited new space expected. However,          Quasi Govt Authorities, private companies, developers, and
                                         occupier demand should ease as most government departments have already             individuals
                                         relocated.

                                                                                                                             TRADING COSTS

                                                                                                                             TRANSFER TAX               N/A
                                                                                                                             NOTARY                     N/A
COUNTRY DATA
                                                                                                                             LEGAL                      N/A
TOP CITIES BY POPULATION                                                                                                     AGENCY                     N/A

Dubai              1,170,000                                                                                                 VAT                        N/A

Abu Dhabi          552,000
                                          KEY MARKETS
Sharjah            519,000                CITY                 SUBMARKET                       MEASUREMENT            RENT             RENT                     RENTAL RENTAL OUTLOOK
                                                                                                                      Q1 2013          Q1 2014                  CHANGE FOR 2014
MAIN INDUSTRIES
                                          Dubai                DIFC free zone                  AED/sq.ft/year         265.00           285.00                   8%       Stable
Dubai - Tourism, Trade, Property
                                          Abu Dhabi            CBD                             AED/sq.m/year          2,000.00         2,000.00                 0%       Stable
Abu Dhabi - Central Government,
Oil & Gas
                                                                                                                                                     2014 EMERGING AND FRONTIER MARKETS           18
AFRICA & MIDDLE EAST
                                         EMERGING AND FRONTIER MARKET - 2014
               OMAN                      OMAN                                                                                                                                B ACK TO MAP

          10
                                         PROPERTY MARKET OVERVIEW                                                             MARKET DYNAMICS
                                         The capital city of Muscat is home to the main office submarkets in Oman,
                                         with both Shatti al Qurum and Qurum the most sought after locations.
                                         The amount of good quality space has stabilised after rising in recent                             Transparency
                                         years. Occupier demand has been steady over the past year particularly in
               C&W                       relation to high quality space. Whereas, much of the smaller, poorer quality           Ease of Owning Property
        EMERGING MARKETS                 buildings have witnessed little interest and landlord incentives have remained
                                                                                                                                 Ease of Leasing Property
          RISK RANKING                   competitive in order to attract tenants. Demand remains orientated from the
  (1 = LOWEST RISK, 42 = HIGHEST RISK)   oil and gas sectors, although ongoing diversification of the economy continues       Speed of Lease Transaction
                                         and government investment in infrastructure has improved connectivity
                                         within the Sultanate.                                                                      Level of Bureaucracy

                                                                                                                                                            0        1   2        3   4      5
                                         2014 OUTLOOK                                                                                                       POOR                      EXCELLENT

                                         The outlook for the year ahead is for rental levels to remain largely static.
                                         There is additional well located, high quality space expected to arrive onto         PRIMARY LANDLORD TYPE
                                         market by the end of 2014 although occupier demand is anticipated to
                                         hold up in line with improvements in the domestic and regional economy.
                                                                                                                              Local Operators
                                         Consequently, this should prevent rents moving down over the remainder
                                         of the year. Rental levels are anticipated to decline further for poorer quality
                                         space, especially if located in more secondary locations.

                                                                                                                              TRADING COSTS

                                                                                                                              TRANSFER TAX              3%
                                                                                                                              NOTARY                    N/A
COUNTRY DATA
                                                                                                                              LEGAL                     1%
TOP CITIES BY POPULATION                                                                                                      AGENCY                    3 - 5%

Muscat             750,000                                                                                                    VAT                       N/A

Seeb               235,000
                                          KEY MARKETS
MAIN INDUSTRIES                           CITY                 SUBMARKET                       MEASUREMENT             RENT            RENT                     RENTAL RENTAL OUTLOOK
                                                                                                                       Q1 2013         Q1 2014                  CHANGE FOR 2014
Finance, oil and gas, legal,
Construction and real estate,             Muscat               N/A                             OMR/sq.m/month          7.00            7.00                     0%       Stable
telecoms,

                                                                                                                                                     2014 EMERGING AND FRONTIER MARKETS           19
ASIA PACIFIC
                                         EMERGING AND FRONTIER MARKET - 2014
             THAILAND                    THAILAND                                                                                                                                 B ACK TO MAP

           11
                                         PROPERTY MARKET OVERVIEW                                                               MARKET DYNAMICS
                                         Bangkok’s office market remains landlord favorable with the highest rental
                                         rents centralized in the city. Rental rates have continually increased due to
                                         strong demand and limited supply. Thanks to the easy access and extension of                           Transparency
                                         the BTS and MRT lines-as most of Bangkok’s office buildings are connected to
             C&W                         the stations-daily commute is not affected, hence occupancy rates and rental                Ease of Owning Property
      EMERGING MARKETS                   rates continue to increase. Moreover, with the ASEAN Economic Community
                                                                                                                                     Ease of Leasing Property
        RISK RANKING                     (AEC) coming into effect in 2015, developers have been refreshing their cur-
  (1 = LOWEST RISK, 42 = HIGHEST RISK)   rent and future projects to attract tenants.                                              Speed of Lease Transaction

                                                                                                                                         Level of Bureaucracy
                                         2014 OUTLOOK
                                         Thailand’s political issues have resurfaced since the fourth quarter of 2013,                                          0        1   2      3     4      5
                                         even though they have not materially impacted the market. If the situation is                                          POOR                      EXCELLENT

                                         not resolved quickly, it may cause new space-occupying decisions to delay dur-
                                         ing the year. Conversely, if the political dispute is resolved, the office market in   PRIMARY LANDLORD TYPE
                                         Bangkok will unquestionably grow in a swift pace due to the various advan-
                                         tages stated earlier. It is expected that approximately 300,000 sq.m. of office
                                         space in non-CBD areas and approximately 44,500 sq.m. of office space in the           Local operator, Local investor
                                         CBD will be added in 2014-2015, offering occupiers more choice.

                                                                                                                                TRADING COSTS

                                                                                                                                TRANSFER TAX                2.5%
                                                                                                                                NOTARY                      N/A
COUNTRY DATA
                                                                                                                                LEGAL                       N/A
TOP CITIES BY POPULATION                                                                                                        AGENCY                      3%

Bangkok             5,659,000                                                                                                   VAT                         7%

Nonthaburi          260,600
                                          KEY MARKETS
Pak Krat            168,800               CITY                  SUBMARKET                        MEASUREMENT              RENT             RENT                     RENTAL RENTAL OUTLOOK
                                                                                                                          Q1 2013          Q1 2014                  CHANGE FOR 2014
MAIN INDUSTRIES                           Bangkok               Rama IV                          USD/sq.m/month           837.50           900.00                   7%       Up

Agriculture, Automoblie, IT               Bangkok               Wireless                         USD/sq.m/month           806.25           837.50                   4%       Up
equipment                                 Bangkok               Ploenchit & Rama I               USD/sq.m/month           753.00           788.89                   5%       Up
                                                                                                                                                         2014 EMERGING AND FRONTIER MARKETS           20
AFRICA & MIDDLE EAST
                                         EMERGING AND FRONTIER MARKET - 2014
             MOROCCO                     MOROCCO                                                                                                                               B ACK TO MAP

          12
                                         PROPERTY MARKET OVERVIEW                                                           MARKET DYNAMICS
                                         The capital city of Morocco is Rabat and the majority of Government agen-
                                         cies are located here. However, the key commercial centre and home to the
                                         primary office market is Casablanca. The office market is Casablanca is fairly                      Transparency
                                         well developed with the city centre and Sidi Maarouf the principal submar-
              C&W                        kets, although there are a number of locations throughout the city that are              Ease of Owning Property
       EMERGING MARKETS                  also emerging. Over the past year, Casablanca has witnessed steady demand
                                                                                                                                  Ease of Leasing Property
         RISK RANKING                    from international occupiers and supply levels have been consistent, and as a
  (1 = LOWEST RISK, 42 = HIGHEST RISK)   result the market has remained fairly balanced between demand and supply.              Speed of Lease Transaction
                                         Although towards the end of the year rental levels for prime space moved up.
                                                                                                                                      Level of Bureaucracy

                                         2014 OUTLOOK                                                                                                        0         1   2        3   4      5
                                                                                                                                                             POOR                       EXCELLENT
                                         The overall regional stability outlook has improved and the political situation
                                         within Morocco is also relatively calm. This will have a positive effect for the
                                         domestic economy where agriculture and tourism remain key constituents.            PRIMARY LANDLORD TYPE
                                         However, after a rise in rental values over the past year, rents are expected
                                         to remains stable over the next 12 months as the market is anticipated to
                                                                                                                            Local Operators.
                                         maintain the balance between supply and demand.

                                                                                                                            TRADING COSTS

                                                                                                                            TRANSFER TAX                 4%
                                                                                                                            NOTARY                       0.5 - 1%
COUNTRY DATA
                                                                                                                            LEGAL                        1 - 2%
TOP CITIES BY POPULATION                                                                                                    AGENCY                       8.33 - 12%

Casablanca         2,900,000                                                                                                VAT                          20%

Fes                920,000
                                          KEY MARKETS
Marrakesh          800,000                CITY                 SUBMARKET                       MEASUREMENT             RENT             RENT                     RENTAL RENTAL OUTLOOK
                                                                                                                       Q1 2013          Q1 2014                  CHANGE FOR 2014
MAIN INDUSTRIES
                                          Casablanca           N/A                             MAD/sq.m/month          432.00           480.00                   11%       Stable
Phosphate mining and processing,
food processing, leather goods,
textiles, construction, energy,
                                                                                                                                                      2014 EMERGING AND FRONTIER MARKETS            21
tourism
AFRICA & MIDDLE EAST
                                         EMERGING AND FRONTIER MARKET - 2014
               EGYPT                     EGYPT                                                                                                                                   B ACK TO MAP

          13
                                         PROPERTY MARKET OVERVIEW                                                             MARKET DYNAMICS
                                         Cairo is the primary commercial and administrative centre in Egypt and is
                                         home the key office market within the country. Since the revolution in 2011
                                         and the subsequent political instability, the economy has eased noticeably and                       Transparency
                                         as a result the office market has largely stagnated. Consequently, rents have
               C&W                       declined due to the resultant drop in occupier demand the current lack of                 Ease of Owning Property
        EMERGING MARKETS                 transactional evidence makes it difficult to accurately ascertain rental levels at
                                                                                                                                   Ease of Leasing Property
          RISK RANKING                   the moment. The most prominent office submarket in terms of good qual-
  (1 = LOWEST RISK, 42 = HIGHEST RISK)   ity space remain the Nile City Towers located in Downtown Cairo, although               Speed of Lease Transaction
                                         Pyramid Heights, New Cairo and 6th October City have also seen occupier
                                         interest mostly as a result of being located away from the city centre.                       Level of Bureaucracy

                                                                                                                                                              0          1   2     3         4      5
                                         2014 OUTLOOK                                                                                                         POOR                           EXCELLENT

                                         The outlook for the office market is Cairo is dependent on the elections in
                                         May 2014 and if there is an extended period of stability following its conclu-       PRIMARY LANDLORD TYPE
                                         sion then the market should start to improve and activity levels are antici-
                                         pated to rise. However, many occupiers and investors are adopting a ‘wait and
                                                                                                                              Institutional owners and Middle Eastern investors
                                         see’ attitude and are awaiting the result of the election and any subsequent
                                         reaction before committing to any plans.

                                                                                                                              TRADING COSTS

                                                                                                                              TRANSFER TAX                2.5%
                                                                                                                              NOTARY                      3.0%
COUNTRY DATA
                                                                                                                              LEGAL                       1 - 2%
TOP CITIES BY POPULATION                                                                                                      AGENCY                      8.33 - 12%

Cairo              8,400,000                                                                                                  VAT                         10%

Alexandria         4,100,000
                                          KEY MARKETS
Giza               2,600,000              CITY                 SUBMARKET                       MEASUREMENT              RENT             RENT                     RENTAL RENTAL OUTLOOK
                                                                                                                        Q1 2013          Q1 2014                  CHANGE FOR 2014
MAIN INDUSTRIES
                                          Cairo                CBD                             USD/sq.m/month           480.00           420.00                   -13%       Stable / Down
Textiles, food processing, tourism,
chemicals, pharmaceuticals,
hydrocarbons, construction, cement,
                                                                                                                                                       2014 EMERGING AND FRONTIER MARKETS                22
metals, light manufacturers
ASIA PACIFIC
                                         EMERGING AND FRONTIER MARKET - 2014
            PHILIPPINES                  PHILIPPINES                                                                                                                           B ACK TO MAP

           14
                                         PROPERTY MARKET OVERVIEW
                                         Absorption in the Philippines has been strong due to an overwhelming
                                                                                                                              MARKET DYNAMICS
                                         demand from the BPO sector. Tholon’s Top 100 Outsourcing Destinations re-
                                         port cites seven cities in the Philippines, with Metro Manila being second only                      Transparency
                                         to Bengaluru (in India). The country remains one of the least expensive, with
                C&W                      rents under 2 USD per square foot per month and vacancy at approximately                  Ease of Owning Property
         EMERGING MARKETS                2.6%. In the CBDs, additional supply has kept rent stable. A number of occupi-
                                                                                                                                   Ease of Leasing Property
           RISK RANKING                  ers from the financial services and insurance sectors have recently committed
  (1 = LOWEST RISK, 42 = HIGHEST RISK)   to the region as the consumer market becomes more attractive. A recent                  Speed of Lease Transaction
                                         portfolio sale of tenanted office buildings in Bonifacio Global City has peeked
                                         outside investor interest and highlighted the liquidity of the market.                        Level of Bureaucracy

                                                                                                                                                              0        1   2      3      4      5
                                         2014 OUTLOOK                                                                                                         POOR                       EXCELLENT

                                         While the Philippine economy will continue to grow, demand for office space
                                         will be driven by the outsourcing sector, especially from BPO services sourced       PRIMARY LANDLORD TYPE
                                         from the North American market. Another trend is the development of the
                                         strata-office market, where developers are trading leasing risk for sales risk. As
                                         the country improves its infrastructure network, a key strategy of the current       Sophisticated investor and Local operator
                                         government, development activity should continue beyond Manila.

                                                                                                                              TRADING COSTS

                                                                                                                              TRANSFER TAX                0.80%
                                                                                                                              NOTARY                      0.10%
COUNTRY DATA
                                                                                                                              LEGAL                       variable
TOP CITIES BY POPULATION                                                                                                      AGENCY                      3%

Quezon City        2,761,700                                                                                                  VAT                         12%

Manila             1,652,200
                                          KEY MARKETS
Caloocan           1,489,000              CITY                 SUBMARKET                        MEASUREMENT             RENT             RENT                     RENTAL RENTAL OUTLOOK
                                                                                                                        Q1 2013          Q1 2014                  CHANGE FOR 2014
MAIN INDUSTRIES                           Makati City          Makati CBD                       PHP/sq.m/month          950.00           1,031.00                 9%       Stable / Up

Banking and Finance, Manufacturing,       Taguig City          Fort Bonifacio                   PHP/sq.m/month          800.00           850.00                   6%       Stable / Up
Trade, Services (BPO), Real Estate        Quezon City          Quezon City                      PHP/sq.m/month          650.00           680.00                   5%       Stable / Up
                                                                                                                                                       2014 EMERGING AND FRONTIER MARKETS            23
CENTRAL & SOUTH AMERICA
                                         EMERGING AND FRONTIER MARKET - 2014
              MEXICO                     MEXICO                                                                                                                                B ACK TO MAP

          15
                                         PROPERTY MARKET OVERVIEW
                                         Mexico enacted substantial economic reforms in 2013 but has yet to reap
                                                                                                                               MARKET DYNAMICS
                                         the full results of these initiatives. GDP growth for the year should be in the
                                         2-2.5% range, still good but well below the potential for this growing econo-                      Transparency
                                         my. The country’s unemployment rate reached 4.8% in 2013, down 2% year-
             C&W                         over-year while inflation and exchange rates moderated, indicating a macro              Ease of Owning Property
      EMERGING MARKETS                   economic landscape that is stable. Mexico City’s submarkets have all seen
                                                                                                                                 Ease of Leasing Property
        RISK RANKING                     positive absorption, but CBD submarkets are still getting the lion’s share of
  (1 = LOWEST RISK, 42 = HIGHEST RISK)   the activity. The construction pipeline in Mexico City stands at an all-time high     Speed of Lease Transaction
                                         of 1.4 million square meters of commercial office space Asking prices for rent
                                         continue to rise moderately, driven to a large extent by the higher standards               Level of Bureaucracy
                                         of new buildings and the sizable absorption. Direct asking rent city-wide is up
                                         9.1% year-over-year, while leasing activity is up 6.4%.                                                            0        1   2       3     4      5
                                                                                                                                                            POOR                       EXCELLENT

                                         2014 OUTLOOK                                                                          PRIMARY LANDLORD TYPE
                                         The promise of new business opportunities brought about by macroeco-
                                         nomic change is prompting market participants to be alert to Mexico City’s
                                         true potential. Corruption, however, is still a significant drag on the Mexican       Mexican Developers, Investors, REITs to list of primary
                                         economy and slows down the pace of business transactions across most                  landlords
                                         industries.

                                                                                                                               TRADING COSTS

                                                                                                                               TRANSFER TAX             5%
                                                                                                                               NOTARY                   0.5%
COUNTRY DATA
                                                                                                                               LEGAL                    5%
TOP CITIES BY POPULATION                                                                                                       AGENCY                   5% sales, 5% leasing

Mexico City        20,500,000                                                                                                  VAT                      16%

Guadalajara        4,430,000
                                          KEY MARKETS
Monterrey          4,080,000              CITY                            SUBMARKET            MEASUREMENT             RENT            RENT                     RENTAL RENTAL OUTLOOK
                                                                                                                       Q1 2013         Q1 2014                  CHANGE FOR 2014
MAIN INDUSTRIES
                                          Mexico City (commercial)        N/A                  USD/sq.m/month          19.75           21.10                    7%       Stable / Up
Electronics, Food and Beverages,          Mexico City (industrial)        N/A                  USD/sq.m/month          4.00            4.00                     0%       Stable / Up
Tobacco and Chemicals, Automotive
                                                                                                                                                     2014 EMERGING AND FRONTIER MARKETS            24
AFRICA & MIDDLE EAST
                                         EMERGING AND FRONTIER MARKET - 2014
              SENEGAL                    SENEGAL                                                                                                                              B ACK TO MAP

           16
                                         PROPERTY MARKET OVERVIEW                                                            MARKET DYNAMICS
                                         The office market in Senegal is primarily located in the capital city, Dakar. The
                                         largest office submarket, Plateau, is located towards the south of the penin-
                                         sula, with a number of Government agencies being located in this part of the                        Transparency
                                         city. However, it is to the north of the peninsula where business are increas-
                C&W                      ingly moving, where rental levels are lower and congestion is less severe than           Ease of Owning Property
         EMERGING MARKETS                in the city centre. Consequently, most of the new supply offering high quality
                                                                                                                                  Ease of Leasing Property
           RISK RANKING                  space in Dakar is being built to the north, with financial services companies
  (1 = LOWEST RISK, 42 = HIGHEST RISK)   increasingly prevalent, highlighting the emergence of new submarkets in this           Speed of Lease Transaction
                                         part of the city.
                                                                                                                                      Level of Bureaucracy

                                         2014 OUTLOOK                                                                                                        0        1   2        3   4      5
                                                                                                                                                             POOR                      EXCELLENT
                                         At the current time, the market in Dakar is fairly evenly balanced between
                                         supply and demand and rents were unchanged over the past 12 months. In
                                         the months ahead a similar level of performance is expected, with the new           PRIMARY LANDLORD TYPE
                                         space scheduled for delivery in 2014 preventing rental levels moving up to sig-
                                         nificantly despite steady occupier demand for good quality space, principally
                                                                                                                             Mainly private individuals and some investor companies.
                                         from the financial services sector.

                                                                                                                             TRADING COSTS

                                                                                                                             TRANSFER TAX                10%
                                                                                                                             NOTARY                      0.75 - 4.5%
COUNTRY DATA
                                                                                                                             LEGAL                       1 - 2%
TOP CITIES BY POPULATION
                                                                                                                             AGENCY                      8.33 - 12%
Dakar              1,121,000
                                                                                                                             VAT                         18%
Pikine             915,000
                                          KEY MARKETS
Guediawaye         307,000
                                          CITY                            SUBMARKET            MEASUREMENT             RENT             RENT                     RENTAL RENTAL OUTLOOK
MAIN INDUSTRIES                                                                                                        Q1 2013          Q1 2014                  CHANGE FOR 2014
Agricultural and fish processing,         Dakar                           N/A                  USD/sq.m/year           264.00           264.00                   0%       Stable
phosphate mining, fertilizer
production, petroleum refining;
iron ore, zircon, and gold mining,
construction materials, ship                                                                                                                          2014 EMERGING AND FRONTIER MARKETS           25
construction and repair
ASIA PACIFIC
                                         EMERGING AND FRONTIER MARKET - 2014
             SRI LANKA                   SRI LANKA                                                                                                                            B ACK TO MAP

          17
                                         PROPERTY MARKET OVERVIEW                                                           MARKET DYNAMICS
                                         The office market in the capital city of Colombo is driven by the IT-ITeS,
                                         financial services and tourism sectors. The market has witnessed substantial
                                         absorption since 2010. A dearth of grade A space in the CBD continues to                        Transparency
                                         drive up occupancy costs and the strength of the prime market has impacted
             C&W                         grade B and C space as well. As a result, the cost of prime space in certain         Ease of Owning Property
      EMERGING MARKETS                   CBD locations has shot up by 15-20% on an annual basis over the last two
                                                                                                                              Ease of Leasing Property
        RISK RANKING                     years. On average, rent in the CBD has risen 6-10%, with suburban rents
  (1 = LOWEST RISK, 42 = HIGHEST RISK)   increasing 4-6%.                                                                   Speed of Lease Transaction

                                                                                                                                  Level of Bureaucracy
                                         2014 OUTLOOK
                                         A majority of upcoming space is still in planning stages, which indicates there                                 0       1     2        3     4      5
                                                                                                                                                         POOR                         EXCELLENT
                                         is no respite for occupiers in the short-term. Continued scarcity of office
                                         space over the next two-to-three years is likely to impact demand as well.
                                         Considering the potential for growth in the IT-ITeS and financial services         PRIMARY LANDLORD TYPE
                                         industries and the support provided by the government- in addition to the
                                         infrastructure developments underway- Colombo’s office market is poised for
                                                                                                                            Local Operator
                                         considerable growth over the next 5-10 years.

                                                                                                                            TRADING COSTS

                                                                                                                            TRANSFER TAX             N/A
                                                                                                                            NOTARY                   N/A
COUNTRY DATA
                                                                                                                            LEGAL                    N/A
TOP CITIES BY POPULATION
                                                                                                                            AGENCY                   N/A
Colombo                    753,000
                                                                                                                            VAT                      N/A
Dehinala-Mount             246,000
Lavina                                    KEY MARKETS
MAIN INDUSTRIES                           CITY           SUBMARKET             MEASUREMENT            RENT                 RENT                          RENTAL RENTAL OUTLOOK
                                                                                                      Q1 2013              Q1 2014                       CHANGE FOR 2014
Processing of agricultural
commodities; Telecommunications,          Colombo        CBD - Colombo 2 LKR/sq.ft/month              125.00 - 250.00      150.00 - 320.00               20-25%      Stable / Up
BFSI, Tourism, Shipping; clothing,        Colombo        CBD - Colombo 3 LKR/sq.ft/month              85.00 - 90.00        90.00 - 100.00                6-11%       Stable
textiles; cement, petroleum refining,     Colombo        CBD - Colombo 7 LKR/sq.ft/month              125.00 - 170.00      130.00 - 180.00               4-6%        Stable
information technology services
and construction                                                                                                                                  2014 EMERGING AND FRONTIER MARKETS              26
CENTRAL & SOUTH AMERICA
                                         EMERGING AND FRONTIER MARKET - 2014
             URUGUAY                     URUGUAY                                                                                                                                  B ACK TO MAP

          18
                                         PROPERTY MARKET OVERVIEW                                                              MARKET DYNAMICS
                                         Uruguay’s GDP grew by 4.4% last year, up from 3.7% in 2012 but below
                                         the 6.5% posted in 2011. While agriculture remains an important source of
                                         employment and exports, its contribution to GDP has declined to around                               Transparency
                                         10% or so. Farming is relatively mechanized and operates with low subsidies.
               C&W                       Uruguay’s small, open economy is vulnerable to downturns in regional export              Ease of Owning Property
        EMERGING MARKETS                 demand from Brazil and Argentina. The US is no longer the country’s largest
                                                                                                                                  Ease of Leasing Property
          RISK RANKING                   export market, but high quality beef and lamb sales there are expanding while
  (1 = LOWEST RISK, 42 = HIGHEST RISK)   trade and bilateral relations with China,Venezuela and Russia have grown               Speed of Lease Transaction
                                         significantly.
                                                                                                                                       Level of Bureaucracy

                                         2014 OUTLOOK                                                                                                         0      1     2        3     4      5
                                         This year, fairly benign labor and wage conditions should persist ahead of                                           POOR                        EXCELLENT

                                         general elections in October. The combination of tighter monetary policy
                                         required to dampen high inflation and sluggish demand in Argentina and Brazil         PRIMARY LANDLORD TYPE
                                         will slow 2014 GDP growth to 3.4%. Longer-term growth prospects will
                                         depend on progress in reducing dependence on agriculture. We expect this to
                                         take some time, especially as the government must maintain macroeconomic              Foreign Investors and Local Operators
                                         stability in the face of persistent high inflation. GDP growth is likely to average
                                         only about 4% over the next few years.

                                                                                                                               TRADING COSTS

                                                                                                                               TRANSFER TAX               2%
                                                                                                                               NOTARY                     1.5%
COUNTRY DATA
                                                                                                                               LEGAL                      1%
TOP CITIES BY POPULATION                                                                                                       AGENCY                     3%

Montevideo          1,319,100                                                                                                  VAT                        12%

Salto               104,028               KEY MARKETS
MAIN INDUSTRIES                           CITY            SUBMARKET              MEASUREMENT             RENT                  RENT                           RENTAL RENTAL OUTLOOK
                                                                                                         Q1 2013               Q1 2014                        CHANGE FOR 2014
Commodities and Services                  Montevideo N/A                         USD/sq.m/month          25.00                 26.00                          4%         Stable

                                                                                                                                                       2014 EMERGING AND FRONTIER MARKETS             27
You can also read