Source-to-Sea Analysis of Plastic Waste Management
←
→
Page content transcription
If your browser does not render page correctly, please read the page content below
January 2020

                                      Source-to-Sea Analysis of
                                    Plastic Waste Management
                                                   Vu Gia-Thu Bon River Basin

This document has been authored by David Hebart-Coleman, Ruth Mathews, Josh Weinberg, Kanika
Groeneweg-Thakar, SIWI. It has been produced as an outcome from the “Foundations for Source-to-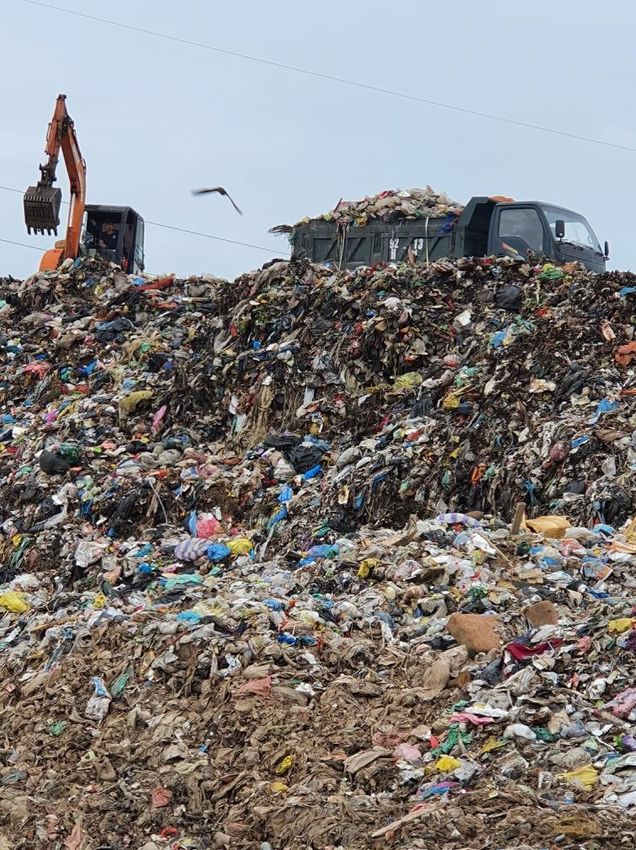
Plastic Waste Management in Vu Gia –
Thu Bon basin

    Quantitative and qualitative assessment characterizing plastic
    solid waste flows in the Vu Gia –Thu Bon basin from source-to-
    sea

Stockholm International Water Institute (SIWI)
Resource and Waste Advisory (RWA) Group

1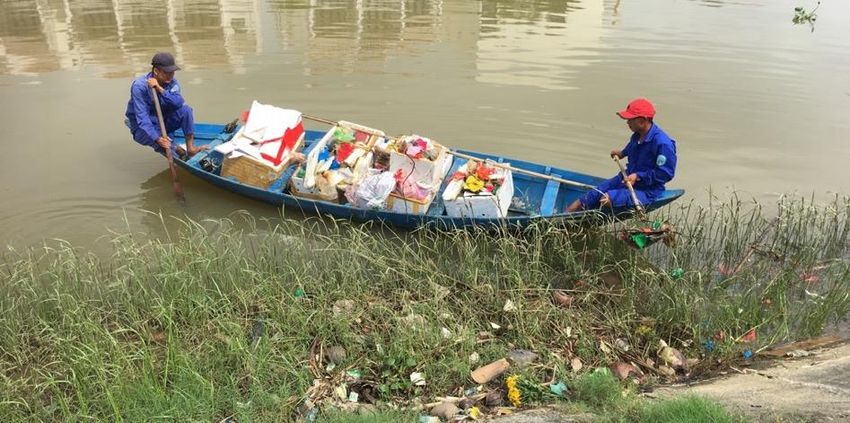
Contents

Contents .................................................................................................................................................. 2
Executive Summary ................................................................................................................................. 4
Introduction............................................................................................................................................. 7
Study objective and methodology ........................................................................................................ 12
    Study objective .................................................................................................................................. 12
    Methodology for implementation..................................................................................................... 13
Land-based sources of solid waste ........................................................................................................ 17
    Current situation of solid waste management.................................................................................. 17
    Waste composition within the study areas ....................................................................................... 23
    Estimation of waste generation ........................................................................................................ 26
    Management of plastic waste ........................................................................................................... 29
    Challenges in solid waste management in VGTB River Basin............................................................ 36
    Mapping of hotspots ......................................................................................................................... 37
Description of impacts of plastic pollution in VGTB River Basin ........................................................... 39
Stakeholders .......................................................................................................................................... 43
    Primary stakeholders......................................................................................................................... 43
    Targeted stakeholders ....................................................................................................................... 43
    Enabling stakeholders ....................................................................................................................... 45
    Supporting stakeholders ................................................................................................................... 47
    External stakeholders ........................................................................................................................ 48
Waste management policy landscape – strength and challenges in Viet Nam .................................... 49
Governance for preventing plastic leakage to waterbodies ................................................................. 51
Recommendations for the VGTB River Basin ........................................................................................ 56
    Priority actions .................................................................................................................................. 56
    Strategic and longer term interventions ........................................................................................... 58
Annexes ................................................................................................................................................. 61
    Annex 1:Estimation of Plastic Waste Value Chain Investment in Different Components/Activities 62
    Annex 2: List and of stakeholders interviewed ................................................................................. 63

Figures

Figure 1: Location of VGTB River Basin in Viet Nam Map ....................................................................... 8

2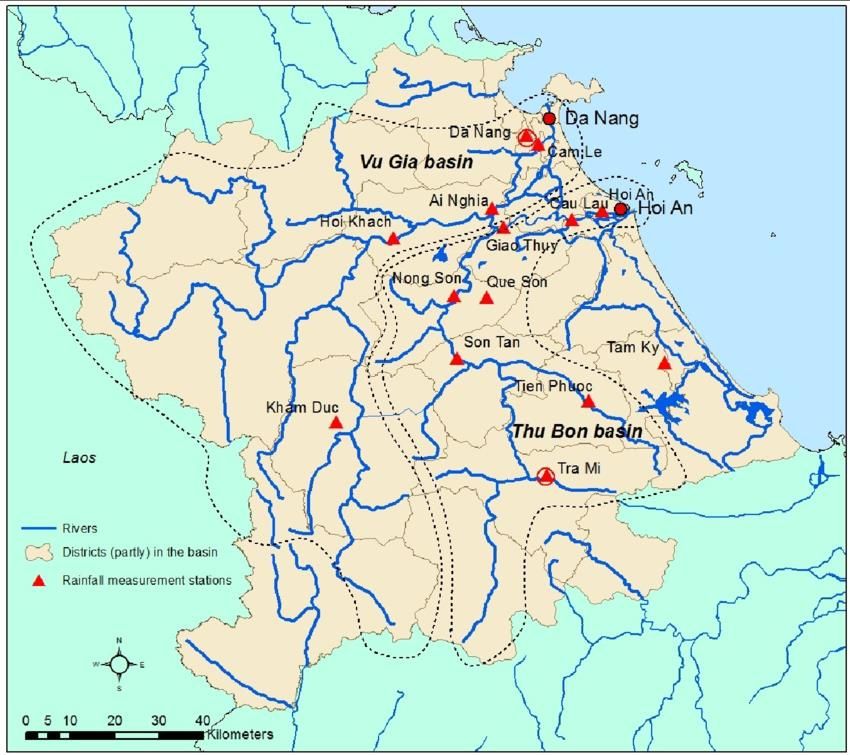
Figure 2: Map of VGTB River Basin (source: https://www.researchgate.net/figure/Overview-of-the-Vu-
Gia-Thu-Bon-basin_fig1_288516298 )..................................................................................................... 9
Figure 3: Administrative Map of Quang Nam Province (Source: Quang Nam,
https://vi.wikipedia.org/wiki/Qu%E1%BA%A3ng_Nam) ...................................................................... 10
Figure 4: Administrative map of Da Nang City ...................................................................................... 11
Figure 5: Six steps of Source to Sea Framework for Marine Litter Prevention and the objectives of this
study in Vu Gia-Thu Bon River Basin ..................................................................................................... 13
Figure 6: Cities/Districts selected for the Solid Waste Survey .............................................................. 15
Figure 7: Location of Khanh Son landfill in Da Nang ............................................................................. 18
Figure 8:Waste composition in Viet Nam, Source: The World Bank, March 2012 ............................... 24
Figure 9: Waste Composition in Hoi An City, Source: Hoi An CPC, 2018............................................... 26
Figure 10: Waste generation per cluster ............................................................................................... 28
Figure 11: Waste generation per cluster and source ............................................................................ 28
Figure 12: Flows of solid waste and plastic waste in VGTB River Basin in ton/day .............................. 31
Figure 13: Waste flow diagram urban cluster in ton/year .................................................................... 34
Figure 14: Waste flow diagram rural cluster (ton/year) ....................................................................... 35
Figure 15: Waste flow diagram coastal cluster (ton/year) .................................................................... 35
Figure 16: The source-to-sea stakeholder mapping framework. Source: SIWI (2019). Source-to-sea
framework for marine litter prevention: Preventing plastic leakage from river basins (p.19) ............. 43
Figure 17: Examples of awareness material for fisherman ................................................................... 57
Figure 18: Examples of pollution close to ports .................................................................................... 58

Tables

Table 1: Summary of solid waste management in VGTB River Basin.................................................... 19
Table 2: Waste composition in Da Nang City, Source: JICA Study on Solid Waste Management in Viet
Nam, March 2011 .................................................................................................................................. 23
Table 3: Waste composition in Viet Nam, Source: The World Bank, March 2012 ................................ 24
Table 4: Waste composition in Hoi An City, Source: Hoi An CPC, 2018 ................................................ 25
Table 5: Calculation factors of solid waste and plastic waste generation in VGTB River Basin ............ 27
Table 6: Calculation of plastic waste generation and unmanaged waste ............................................. 27
Table 7: Efforts of plastic waste reduction/recovery in VGTB River Basin............................................ 29
Table 8: Calculation of unmanaged plastic waste ................................................................................. 30
Table 9: Waste Flow Diagram: Plastic waste management in ton/year ............................................... 31
Table 10: Waste Flow Diagram: Mismanaged plastic waste in ton/year .............................................. 32
Table 11: Per capita equivalent of plastic pollution .............................................................................. 33
Table 12: List of hotspots in VGTB River Basin ...................................................................................... 37
Table 13: Impact of plastic pollution in the VGTB River Basin .............................................................. 41
Table 14: Targeted stakeholders in VGTB River Basin........................................................................... 44
Table 15: Summary of enabling stakeholders ...................................................................................... 45
Table 16: Overview of relevant policies, regulations and standards enacted in Viet Nam regarding
environmental protection and solid waste management ..................................................................... 49
Table 17: Strengths and challenges associated with governance framework for solid waste
management ......................................................................................................................................... 50
Table 18: Governance for preventing plastic marine litter - findings and pointers for action ............. 52

3
Executive Summary

The Source-to-Sea framework for Marine Litter Prevention provides a structured approach to assess
the situation of plastic pollution and generation of marine litter in a specific river system or basin and
design adequate, holistic and cross-sectorial interventions to minimize the problem. The framework
suggests six consecutive steps to achieve this. They are clustered into a three-step diagnostic and a
three-step planning and implementation phase. This report aims to apply the first three steps of the
framework for the Vu Gia – Thu Bon (VGTB) River Basin in central Viet Nam. The steps include:

    -   Characterize: Identify land-based sources of plastic pollution and understand their impacts
        from a source-to-sea perspective.

    -   Engage: Engage local and global stakeholders to gain control of plastic waste.

    -   Diagnose: Develop coherent governance, finance and management across sectors and at all
        scales.

The study consists of an assessment of the current situation of waste management and plastic
recycling in the VGTB River Basin based on desktop research, stakeholder interviews, a field survey of
plastic leakages from three different clusters within the basin in order to estimate the scale of the
problem and a characterisation of stakeholders and the governance system relevant to the issue of
plastic pollution. Plastic leakages are quantified with the Waste Flow Diagram (WFD) methodology, a
tool based on expert assessment that is being developed by University of Leeds, EAWAG and
Wasteaware for GIZ. The full methodology and guidance documents will be published in the first
quarter of 2020. This study summarizes results in findings and recommendations that can be used for
the planning phase within the source-to-sea approach.

The VGTB River Basin covers an area of 10,350 km2, within mainly Quang Nam Province and Da Nang
City and is located in central Viet Nam. Included are:

    •   Quang Nam Province: Urban areas (Hoi An City and Dien Ban town) and rural areas (Dai Loc,
        Duy Xuyen, Que Son, Nong Son, Hiep Duc, Tien Phuoc, Bac Tra Mi, Nam Tra Mi, Dong Giang
        and Tay Giang districts).
    •   Da Nang City: Urban districts (Cam Le, Hai Chau, Lien Chieu, Ngu Hanh Son, Son Tra and
        Thanh Khe) and rural district of Hoa Vang.

A full, statistically coherent sampling of plastic leakages for the whole basin was not possible within
the scope of the study, hence a proxy approach was used with sampling in representative clusters
and extrapolation from these. Characteristics of the clusters are:

    1. Urban centres:
       These are normally the areas with the highest waste generation (in waste per capita and
       total amounts), frequently close to rivers, and with available data for waste management
       services.
    2. Low density settlements and rural areas:
       Areas with lower waste generation (in waste per capita and total amounts), usually less
       waste management services and little to no data availability.

4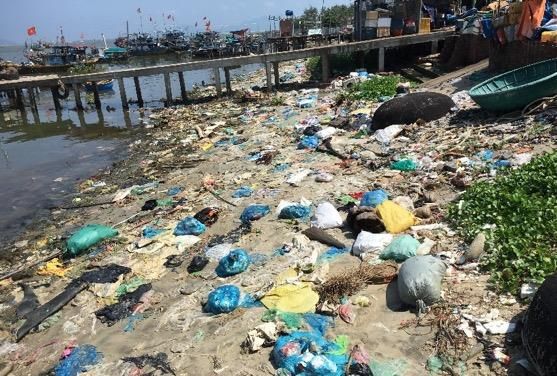
3. Coastal and/or touristic areas:
These are areas with proximity to the sea, higher risk of direct leakage and higher sensitivity
to impacts.
Waste management services for these three clusters can be described as good service levels in urban
areas and less coverage in rural areas. Plastic recovery activities are focussed on urban areas and
touristic centres as well as coastal communities to some extent. Waste generation in cities is almost
double as high (0.7 – 0.8 kg/capita and day) as in rural and coastal communities with 0.42 kg/capita
and day). Plastic content in municipal solid waste reaches up to 20% by weight in touristic cities (Hoi
An) but averages at a comparatively high 16% to 17% throughout the clusters.
The following table summarzises waste quantities and the amount of uncollected waste per cluster
from the samples taken in the field. It shows that a total of 38.6 metric tons per day of plastics are
not collected in the VGTB River Basin. That amount originates mainly from rural communities due to
their lower coverage in terms of waste collection.
Description Unit Urban Rural Coastal Total
Population inhabitants 1,208,245 699,196 251,697 2,159,138
Household waste generation ton/day 926 294 106 1,326
Commercial waste generation ton/day 225 44 16 285
Tourism waste generation ton/day 38 - - 38
Total municipal waste generation ton/day 1,189 338 122 1,649
Total plastic waste generation ton/day 206 55 20 281
Average waste service coverage % 95% 60% 63% 86%
Total uncollected waste ton/day 54 137 45 236
Total uncollected plastics ton/day 9.3 22.1 7.3 38.6
The WFD methodology was applied to determine how much plastic is leaking into the aquatic
environment from the respective clusters. The results are described in detail in Chapter 3.5 but can
be summarized that it shows each person in the VGTB River Basin releases between 0.6 (urban) and 4
(rural) kg of plastic waste that enters waterways per year. This is equivalent to 120 (urban), 2,000
(rural) and 1,500 (coastal) plastic bags released per person per year.
Major impacts to the tourism sector and in terms of economic losses as costs for clean-ups are
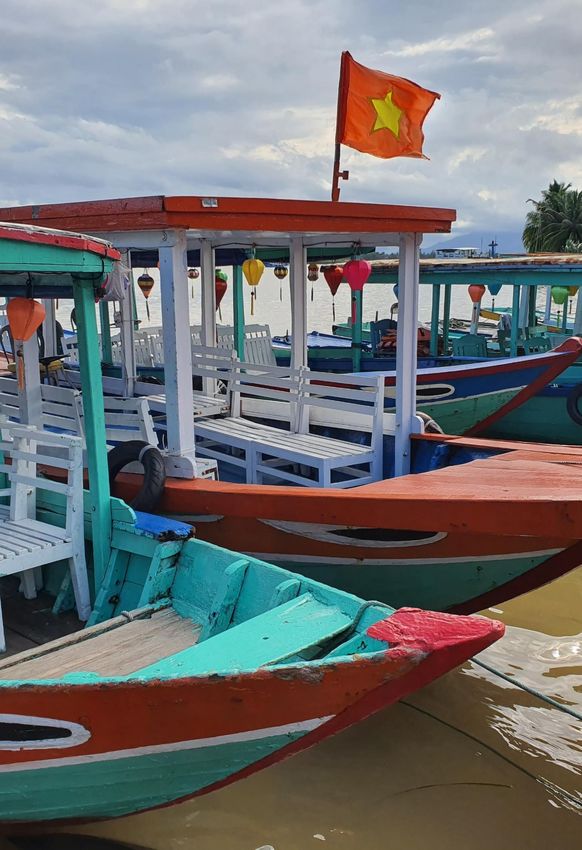
caused by this plastic pollution. Of particular concern is expanded polystyrene (EPS or commonly
called Styrofoam) used for food packaging and for fishing activities as it is a) prominently visible and
b) breaks into smaller, non-removable pieces very quickly. Touristic areas such as Hoi An have to
conduct daily beach cleanings to maintain their attractiveness to visitors.
Key stakeholders that have to be addressed to change their behaviour and impacts are the general
population, waste service providers (mainly URENCO), waste workers on local and rural level,
informal waste collectors and fishing communities and their port management. Several ministries are
involved in waste management and recycling services and are mostly represented through their
provincial departments. International agencies are continuously increasing their engagement in the
topic of plastic leakage and with a focus in Viet Nam, so that several initiatives and programmes
could be found in the VGTB River Basin. Coordination and collaboration between these actors is still
limited.
5
Priority actions that should be addressed in the short to medium term and are tackling rather quick
improvements, both on national as well as on local level. These include:

     -    Addressing single-use plastics: Action plan for reduction and substitution, limitations of use,
          incentives for producers and retailers to move away from single-use plastics, levies on bags,
          target hospitality and food packaging industry to move from single-use to zero waste.

     -    Improving solid waste management services, particularly for rural and coastal areas,
          particularly addressing hotspots such as tourism areas and fishing ports.

     -    Support recycling value chains by introducing plastic banks, support pilot projects and
          innovations, cooperate with tourism and packaging industry, discuss and introduce
          extended producer responsibility (EPR) systems for selected packaging.

     -    Create awareness on consumer, producer (and retailer) and political decision maker level.

A second set of recommendations is provided as an initial food for thought on the consecutive steps
within the source-to-sea approach. These are geared to:

    •    Sustainably secure service delivery and adequate technical standards for all (most) waste
         generators;

    •    Develop and promote value chains for all (most) types of plastics put on the market or
         consequently limit the output of plastics that have no value chain established; and

    •    Promote a societal development including all relevant stakeholders towards a more resource
         efficient and less wasteful economy, ultimately aiming for a comprehensive circular economy
         approach.

The recommendations include aspects that facilitate policy interventions, enable multi-stakeholder
processes, strengthen formal and informal recycling activities, provide capacity development on
technical and planning levels and promote sustainable financing and investments.

This study is a first attempt to address complex problems and interlinkages between various actors
for a larger area such as the VGTB River Basin with comparatively little level of effort. While the
provided data is not statistically comprehensive it paints a snapshot and overall idea of the situation
on the ground, the relevant actors and their interlinkages. It identifies core problems and options for
tackling them. Further research beyond the scope of the study is recommended to a) scope a
statistically sound assessment of plastic leakages and provide linkage with other methodologies; b)
quantify impacts (the study is limited to mostly qualitative descriptions, no internationally accepted
methodology is available yet to quantify impacts of plastic leakage); and c) enter a more detailed
analysis of stakeholder’s drivers, barriers and motivations to refine stakeholder engagement.

6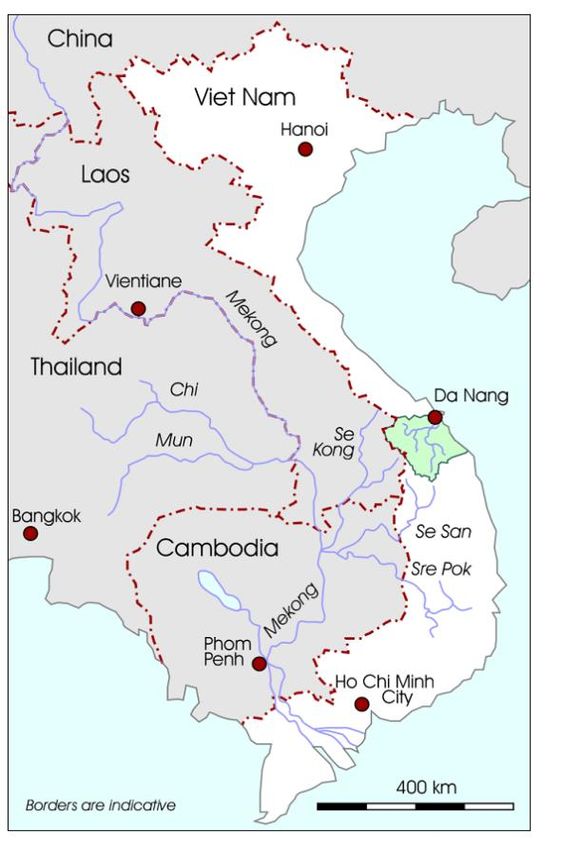
Introduction

Source-to-sea management considers the entire source-to-sea system – stressing upstream and
downstream environmental, social and economic linkages and stimulating coordination across
sectors and segments. Source-to-sea management focusses on six key flows. These six source-to-sea
flows – water, sediment, pollutants, biota, materials and ecosystem services – connect segments
along the source-to-sea continuum at different spatial scales. All flows have natural ranges of
variation that biodiversity and human activities have adapted to. Variation outside of these natural
ranges can disrupt individual species’ life cycles, impact human health, alter ecosystems and disrupt
social and economic systems.

This report addresses the first three steps of the source-to-sea approach as described in
Implementing the Source-to-Sea Approach: A Guide for Practitioners1. This includes the
characterization of a priority source-to-sea flow in the Vu Gia – Thu Bon (VGTB) River Basin Viet Nam
with focus on solid waste flows (and specifically plastics). The purpose of the study is to provide
insights into the sources, quantities and transport pathways for plastics to enter waterways and be
delivered to coastal and marine environments and the governance, behaviours, management and
finance that are contributing to plastic leakage. The study will be used to increase stakeholder
awareness and to provide a basis for decision makers in considering steps toward preventing plastic
pollution in the basin.

Vu Gia Thu Bon River basin consists of different Vietnamese provinces, namely Quang Nam, Da Nang,
Kon Tum and Quang Ngai and extends from 14°90´to 16°20´N and from 107°20´to 108°70´E. (source:
http://www.basin-info.net/river-basins/vu-gia-thu-bon-information-centre-vietnam/natural-
environment.

The River Basin covers an area of 10,350 km2, including mainly Quang Nam Province and Da Nang
City (Figure 1).

1
 Mathews, R. E., Tengberg, A., Sjödin, J., & Liss-Lymer, B. (2019). Implementing the source-to-sea approach: A
guide for practitioners. SIWI, Stockholm.
7
Quang Nam

Figure 1: Location of VGTB River Basin in Viet Nam Map

Areas of Vu Gia-Thu Bon (VGTB) River Basin in Quang Nam Province and Da Nang City (Figure 2)
include:

    •    Quang Nam Province: Urban area (Hoi An City and Dien Ban town) and rural area (Dai Loc,
         Duy Xuyen, Que Son, Nong Son, Hiep Duc, Tien Phuoc, Bac Tra Mi, Nam Tra Mi, Dong Giang
         and Tay Giangdistrict).
    •    Da Nang City: Urban districts (Cam Le, Hai Chau, Lien Chieu, Ngu Hanh Son, Son Tra and
         Thanh Khe) and Suburban district of Hoa Vang.

VGTB River Basin is one of the 9 largest river systems in Viet Nam. The rivers are short with steep
slopes (in the upstream) and consists of two main tributaries: 1) Vu Gia River, which is 204 km long
until Da Nang City and 2) Thu Bon River, originating from the common border of three provinces of
Quang Nam, Kon Tum and Quang Ngai, at an elevation of over 2,000 m and has a length until Giao
Thuy of 152 km.

8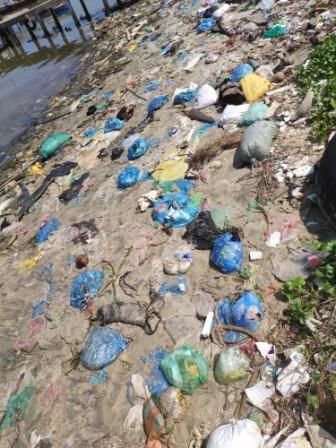
Figure 2: Map of VGTB River Basin (source: https://www.researchgate.net/figure/Overview-of-the-Vu-Gia-Thu-Bon-
basin_fig1_288516298 )

Quang Nam Province is a coastal province located in the central part of Viet Nam. The province
borders to the north with Da Nang City, to the east with South China Sea (125 km coastal line), to the
west with Kon Tum province and Lao Democratic Republic and to the south with Quang Ngai
Province. With natural area of 10,406 km2 the province is characterized by three river basins, i.e. Vu
Gia, Thu Bon and Tam Ky River basin.

The province, with population of 1,567,890 people (2019 census), is administratively divided into 02
cities (Tam Ky and Hoi An City), 01 town (Dien Ban), and 15 districts (Tay Giang, Dong Giang, Nam
Giang, Phuoc Son, Bac Tra Mi, Nam Tra Mi, Hiep Duc, Tien Phuoc, Nong Son, Duy Xuyen, Dai Loc,
Thang Binh, Que Son, Nui Thanh and Phu Ninh) (Figure 3).

9
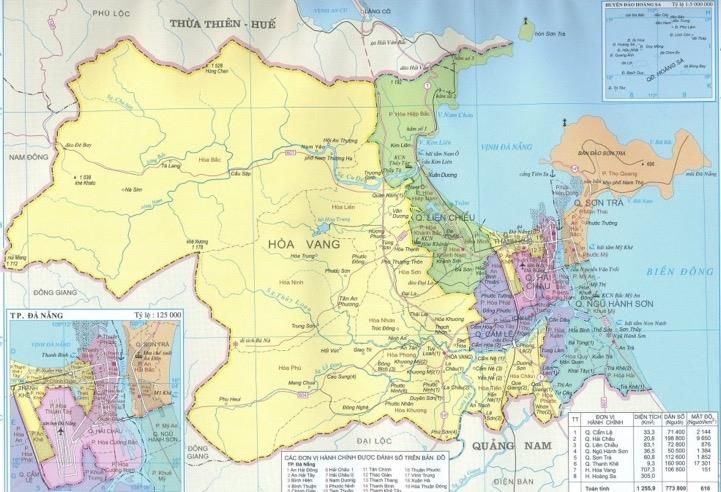
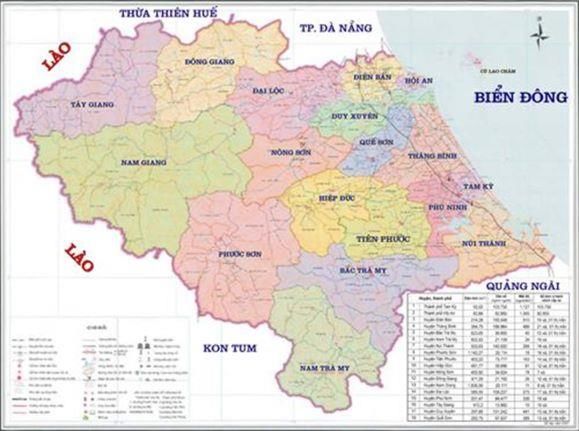
Delta

Figure 3: Administrative Map of Quang Nam Province (Source: Quang Nam,
https://vi.wikipedia.org/wiki/Qu%E1%BA%A3ng_Nam)

Hoi An, as a part of Quang Nam Province, is an Ancient Town, a National Cultural Heritage Site since
1985 and an UNESCO World Heritage City since 19992. The coastal city is one of the most famous
tourist destinations in central Viet Nam. In 2016, the city welcomed 2,624 million visitors, up 17.92 %
compared to 20153. In 20184, the city welcomed nearly 5 million tourists while about 6.5 million
tourists were in the entire Quang Nam Province.5

Da Nang, a coastal city in central part of Viet Nam, borders to the North with Thua Thien -Hue
Province, to the East with Eastern sea, to the West and South with Quang Nam Province (Figure 4).
The city includes 6 urban districts (Cam Le, Hai Chau, Lien Chieu, Ngu Hanh Son, Son Tra and Thanh
Khe district), 1 rural district (Hoa Vang, and 01 island district (Hoang Sa). Natural area of Da Nang City
is 1,285 km2. The city has population of 1,234,310 people according to the 2019 census.

2
  UNESCO World Heritage Sites in Hoi An. http://www.vietnam-guide.com/hoi-an/hoi-an-old-town.htm
Read more at: http://www.vietnam-guide.com/hoi-an/hoi-an-old-town.htm?cid=ch:OTH:001.

3
 A review for Hoian’s socio-economic of 2016 http://hoianancienttown.vn/en/news/Hoi-An-Overview/a-review-
for-hoian-s-socio-economic-of-2016-467.hwh
4
  Approximately 5 million tourists coming to Hoi An in 2018. December 19, 2018. http://baoquangnam.vn/chinh-
tri/201812/gan-5-trieu-luot-khach-den-hoi-an-nam-2018-829890/

5
 Quang Nam welcome more than 6.5 millions tourist in 2018 (dec.2018). https://baodautu.vn/quang-nam-don-
hon-65-trieu-luot-khach-trong-nam-2018-d92768.html
10
The coastal city of Da Nang is Viet Nam’s third largest city and is the main commercial and
educational centre in the central Viet Nam. The tourist sector is a vital component of Da Nang’s
economy. In 2018, the city welcomed about 7.66 million tourists.

Figure 4: Administrative map of Da Nang City

Socio-economy in the VGTB River Basin is diverse, including agriculture, forestry and fishery and
handicraft. The industrial and tourist sectors are strongly developing in recent years. In the
agricultural sector, rice is the dominant staple crops and is mainly planted in the lowland area.
Demand for water for domestic use and socio-economic development in the regions is huge which
indicates the importance of VGTB River system. Particularly the Vu Gia river is an important source of
hydropower with 8 large dams and 30 smaller installations with a total installed capacity of 714 MW
(2010). The maximum capacity of the VGTB River Basin is estimated to be around 1,500 MW. The
installations are mostly located on the mountainous upstream tributaries of the Vu Gia river.

11
Study objective and methodology

     Study objective
The qualitative and quantitative assessment characterizing solid waste flows (especially plastics) in
VGTB River Basin following the source to sea approach provides insights into sources of plastic
pollution, quantities and transport mechanisms towards waterways. It also analyses the underlying
governance, behavioural patterns as well as management and finance aspects that are contributing
to the plastic leakage.

The outputs of this study are intended to be used to strengthen understanding of the issue of land-
based plastic pollution in the Vu Gia – Thu Bon River Basin amongst local stakeholders. They will be
the basis for engaging with local authorities in developing a source-to-sea approach to managing
solid waste for improved social, economic and environmental outcomes.

The Source-to-Sea Framework for Marine Litter Prevention has a six step cycle6 but the objective of
this study is focussing on the first three steps as shown in Error! Reference source not found.5.

6
 Mathews, R.E. & Stretz, J., 2019. Source-to-Sea Framework for Marine Litter Prevention: Preventing Plastic
Leakage in River Basins
12
Figure 5: Six steps of Source to Sea Framework for Marine Litter Prevention and the objectives of this study in Vu Gia-Thu
Bon River Basin
The findings of this report inform on the amounts of municipal solid waste (MSW) generated and
collected, types and amounts of plastic waste generated and the paths they follow to their final
destination. It further evaluates impacts of plastic pollution, identifies key stakeholders (primary,
targeted, enabling, supporting and external) and challenges and opportunities in the governance
system. The proposals and recommendations presented in this report follow the Source-to-Sea
Framework for Marine Litter Prevention.
Methodology for implementation
This study is based on the primary data collected using the Source-to-Sea Framework for Marine
Litter Prevention. Source-to-sea management considers the entire source-to-sea system – stressing
upstream and downstream environmental, social and economic linkages and stimulating
coordination across sectors and segments. The primary data which is mostly qualitative has been
supplemented by secondary data from recent studies done post 2010.
The primary data have been collected during a field survey in VGTB River Basin from October 20 to
October 31, 2019. It was conducted to understand and observe the real status of solid waste
13management in VGTB7 River Basin, especially plastic waste flows in order to facilitate qualitative and
quantitative characterization of plastic solid waste flows in the River Basin.
NOTE: It is important to point out that the model is Within the scope of the study the whole
based on expert assessment during field surveys and basin could not be surveyed in close
not actual measurements. Also, the upscaling to the detail. The Consultant selected a number
whole river basin is indicative only and not statisticallyof representative areas in the VGTB River
robust. For a statistically reliable assessment of the Basin to conduct the field survey.
whole river basin more reliable and detailed data on Findings from the field surveys together
waste generation rates, settlement structures and with results of reviewing available
particularly the spatial distribution of residents would secondary data was used to estimate
have to be taken into consideration. The required level plastic waste flows in the surveyed areas.
of effort could not be executed within the scope of this The data are then upscaled to the entire
study. basin. The model used is based on the
GIZ initiated methodology of the Waste
8
Flow Diagram . This model is still under development but is currently the only available tool to
estimate plastic waste flows based on field observations and the potential for plastics leaking into
water systems from insufficient municipal waste management services. It is designed for use on the
municipal level. A second available tool, the plastic pollution calculator9 is providing a significantly
more detailed estimate but requires a much more substantial data set to operate.
In order to select the representative areas for the field survey, the study area (VGTB River Basin) is
classified into clusters. Each cluster will include areas/districts/towns having particular
characteristics. For VGTB River Basin, following clusters are defined:
• Urban centres:
These are normally the areas with the highest waste generation (in waste per capita and
total amounts), frequently close to rivers, and with available data for waste management
services.
• Low density settlements and rural areas:
These generally have ower waste generation (in waste per capita and total amounts), usually
less waste management services, little to no data availability.
• Coastal and/or touristic areas:
These are areas with proximity to the sea, higher risk of direct leakage and higher sensitivity
to impacts.
The clustering also considers upstream – downstream relationships where relevant as well as
potential sinks within the water system such as dams or other water retaining installations. Specific
point sources (e.g. plastics industries, dockyards) can be located throughout the river basin and will
be evaluated separately. As a result of the clustering, areas (Figure 6)selected for the survey include:
• Urban Centres: Tam Ky, Hoi An and Da Nang City; and
8
The concept and methodology are presented in: Renaud, P., Stretz, J., Latuheru, J., &Kerbachi, R. (2018). Marine
Litter Prevention - Reducing plastic waste leakage into waterways and oceans through circular economy and
sustainable waste management. Eschborn: Deutsche Gesellschaft für Internationale Zusammenarbeit (GIZ)
GmbH
9
https://www.iswa.org/home/news/news-detail/article/iswa-contributes-to-decrease-plastics-ending-up-in-
the-ocean-in-bali/109/
14• Rural areas: Duy Xuyen, Dai Loc, and Nui Thanh districts
Tam Ky City and Nui Thanh district are not located in VGTB River Basin. However, the team has
conducted the survey in the areas because of the followings:
- Tam Ky City is the capital city of Quang Nam Province where most of the provincial
governmental offices are located. Involvement of the city’s stakeholders in the survey
process will improve their understanding of mechanisms of plastic pollution. This also helps
the provincial government to understand the importance of waste management (especially
plastic waste) as a part of integrated water management that needs to be coordinated by
VGTB River Basin Joint Coordination Committee.
- Nui Thanh district10, although it does not belong VGTB River basin, is the district where two
provincial landfills (Tam Xuan 2 landfill and Tam Nghia landfill) are located (waste from other
districts in the province is disposed of in these landfills; Nui Thanh district is also connected
to VGTB River system by Truong Giang River (that connects Tam Ky River Basin with Thu Bon
River Basin). The team was informed by Nui Thanh district that Tam Hai Commune (an Island
of the district) is the place that yearly receives hundred tons of waste flowing from other
areas, by currents, to the commune’s seashore.
Dai Loc District Da Nang City
Hoi An City
Duy Xuyen
District
Tam Ky City
Nui Thanh
District
Figure 6: Cities/Districts selected for the Solid Waste Survey
The clustering then allows to determine characteristic potential for plastic leakage for the different
areas. In the simplified approach used here the results from field observations are then simply
upscaled to the whole population attributed to each of these clusters. The available secondary data
allowed for a rather detailed clustering. It has to be noted however that this data could not be
verified within the scope of the study.
Given the size of the VGTB River Basin and its numerous disposal sites and varying waste
management characteristics a consolidated approach as used in the Lake Hawassa study was
logistically not possible to implement. In addition, the limitations of the available secondary data on
waste generation, composition and in particular on formal and informal separation and recycling
10
The survey of Nui Thanh District is recommended by DONRE
15activities would have required a widespread primary data collection exercise. The approach here therefore attempts to generate some meaningful estimates despite the limited data availability. 16
Land-based sources of solid waste

     Current situation of solid waste management
Solid waste management (SWM) involves the generation, storage, collection, transportation and
disposal/treatment of wastes which are generated from households, tourist activities, commercial
premises, institutions, industries and other sources within municipal boundaries.

Solid waste management in Quang Nam Province
SWM in Quang Nam Province is assigned as follows:

     -   Quang Nam Urban Environmental Company (URENCO) is responsible for provision of waste
         services to Tam Ky City and nine districts (Phu Ninh, Tien Phuoc, Hiep Duc; Que Son, Thanh
         Binh, Duy Xuyen; Dien Ban, Dai Loc and Nui Thanh districts). The collected waste is disposed
         of at three provincial landfills (Tam Xuan 2, Tam Nghia and Dai Nghia Landfill) managed by
         Quang Nam URENCO;
     -   Hoi An Public Works JSC is responsible for SWM in Hoi An City, including management of the
         composting plant and Cam Ha landfill; and
     -   SWM is self – organized by the communes/district towns in seven mountainous districts. This
         is due to the large geographical area, complex topography, and low population density in the
         area.

In total, in the province there are twelve disposal sites with varying levels of management at
provincial and city/district levels. See Figure 3 for the location of the main sites of landfills.

According to Quang Nam URENCO, solid waste daily collected in VGTB River Basin (Dai Loc, Duy
Xuyen, Tien Phuoc, Hiep Duc and Que Son District Tra Mi, Nam Tra Mi, Dong Giang, Tay Giang, Nam
Giang and Nong Son district) is about 348 metric tons/day.

Solid waste management in Hoi An City
According to Hoi An City Peoples’ Committee (CPC), Hoi An Public Works JSC is the company
responsible for solid waste management in Hoi An City. Waste generation in the city increased
considerably in recent years, especially the plastic fraction. If in 2013, the amount of waste collected
in the city was about 65.5 tons/day, the waste amount collected in 2018 was 92 tons/day and in
2019 was about 100 tons/day. Waste collected in the city is either composted (organic fraction) at
the composting plant or disposed of at Cam Ha or provincial landfills.

17
Solid waste management in Da Nang City According to Da Nang Department of Natural Resources and Environment (DONRE), solid waste amount collected daily in Da Nang City is more than 1,100 tons/day11. The waste collection rate in 2018 was about 93-96 % of the generated waste in the urban area and about 70-75 % in the suburban areas. The collected wastes are disposed of at Khanh Son Landfill- the only landfill in Da Nang City.12 Average waste generation rate increased from 8-10 % annually for the period 2007-2017. From 2017- 2018, the annual waste generation rate increased 16 -17 % per year, i.e. almost doubled compared to the period of 2007-201713. The city’s waste management infrastructure includes 133 waste-bin transfer points, 5 transfer stations (Le Thanh Nghi, Cho Dau Moi, Nguyen Duc Trung, Hoa An and Hoa Tho), and Khanh Son landfill. The Khanh Son landfill is estimated to be filled by end of 2019 or beginning 2020.14 The following map (Figure 7) shows the location of Khanh Son landfill. It is not bordering or in close vicinity of open water bodies. Figure 7: Location of Khanh Son landfill in Da Nang The landfill, constructed with support from the World Bank, operates since 2007 and has an area of 48.3 ha. It receives about 1,200 tons/day (1,100 tons of domestic waste and about 100 tons from other sources, such as industrial waste). Located next to the landfill a waste incineration plant with a 11 Da Nang “struggle” to treat municipal waste. http://dangcongsan.vn/xa-hoi/da-nang-gong-minh-xu-ly-chat- thai-ran-sinh-hoat-530911.html 12 Da Nang and challenges in MSW management (2018). https://enternews.vn/da-nang-va-thach-thuc-quan-ly- chat-thai-ran-do-thi-141530.html 13 Da Nang: solid waste … https://www.thiennhien.net/2019/03/01/da-nang-rac-thai-ran-chiem-ty-le-16-17/ 14 Da Nang addresses environment pollution at the only landfill of the City (Feb. 2019). https://bnews.vn/da- nang-xu-ly-o-nhiem-moi-truong-bai-rac-duy-nhat-cua-thanh-pho/130329.html 18
designed capacity of 650 tons/day. The plant was constructed by Viet Environment JSC. In 2009, the
first phase of the plant (capacity of 250 tons/day) was put into operation but stopped after 6 months
as it did not meet the technical and environmental standards. The plant occupies an area of 10 ha
(allocated by the CPC) out of the above-mentioned 48.3 ha.

The CPC plans to upgrade Khanh Son landfill to become a waste treatment complex, hosting a waste
treatment facility with a capacity of 1,000 tons/day, in addition to the above-mentioned incineration
plant. Presently, the 1,000 tons of waste/day treatment plant is being tendered by the CPC. The 650
tons/day incineration plant of Viet Environment JSC is being revised (the EIA report is in the
consultation process), using WTE technology in a joint venture with Everbright International (Hong
Kong). A cell (No. 6) for waste disposal will be built (around 6 ha) to allow for waste disposal until
completion of the waste treatment plants.

Solid waste generation sources
Main sources of solid waste in VG-TB River basin include:

     -    Household (HH) waste (urban and rural areas);
     -    Solid waste from tourist activities;
     -    Industrial, commercial and institutional waste, and
     -    Solid waste from agricultural activities;
     -    Others like street sweeping, drain silt, litter etc.

Since solid waste generated from agricultural activities such as empty bottles, plastic packages from
pesticides or plant protection chemicals is considered a small amount and the waste is stored in
concrete containers and then collected by local authority, the risks of this type of waste leaking into
environment is low. The study therefore does not include this type of waste.

A summary of solid waste management (i.e. collection, transportation and disposal) in VGTB River
Basin is presented in Table 1 below.
Table 1: Summary of solid waste management in VGTB River Basin

 No      Clusters      Districts/        Components of           Collection   Means/ Location
                       City/ town        SWM                     frequency

 1       Quang Nam Province

 1.1 Rural             Delta rural       Primary                 1-2 times/
     areas             districts: Dai    collection              weeks
                       Loc, Duy                                  (domestic
                       Xuyen, Tien                               waste)
                       Phuoc, Hiep
                       Duc and Que
                       Son District

19
No Clusters Districts/ Components of Collection Means/ Location
City/ town SWM frequency
Transfer points
Secondary
collection
Waste disposal
(Tam Xuan 2,
Tam Nghia and
Dai Hiep
Landfills)
Mountainous Primary Self-
Districts: Bac collection organized
Tra Mi, Nam
Transfer points
Tra Mi, Dong
Giang, Tay Secondary
Giang, Nam collection
Giang and
Nong Son
15
Waste disposal District dumping sites/landfills
15
http://baoquangnam.vn/xa-hoi/201909/xa-hoi-hoa-cong-tac-thu-gom-rac-thai-o-nong-son-
874188/index.htm
20No Clusters Districts/ Components of Collection Means/ Location
City/ town SWM frequency
1.2 Urban Hoi An City, Primary Daily
Area collection
Dien Ban
Town
Transfer points
Secondary
collection
Waste disposal
at Cam Ha
Landfill and
composting
plant
1.3 Coastal Hoi An City, Primary Daily for
area Dien Ban collection Hoi An
See 1.2 for Hoi An City and
Town, Duy
Transfer
Xuyen
stations
District Twice/
See 1.1 for Dien Ban Town and Duy
Secondary
week for Xuyen District
collection
Dien Ban
Waste disposal town and
Duy Xuyen
District
2 Da Nang City
21No Clusters Districts/ Components of Collection Means/ Location
City/ town SWM frequency
2.1 Urban Da Nang Primary Daily
Districts collection
Transfer
stations/points
Secondary
collection
Waste
disposal: Khanh
Son Landfill
2.2 Rural area Hoa Vang Primary
District collection
Daily in
(by communes) district
town
Twice/ 16
16
http://moitruongdothidanang.com.vn/news/view/hoa-vang-chu-trong-bao-ve-moi-truong-nong-thon-moi.html
22No Clusters Districts/ Components of Collection Means/ Location
City/ town SWM frequency
Transfer week for
stations communes
17
Secondary See 2.1
collection: by
Dang Nang
URENCO)
Waste
disposal: Khanh
Son Landfill
Waste composition within the study areas
In Viet Nam in general and in Quang Nam Province as well as Da Nang City in particular, data about
waste composition is often unavailable.
Most of the available data on waste compositions are outdated or have not been analysed
systematically or regularly. Following Table 2, Table 3 and
Table 4) are available data on waste compositions done in VG-TB River Basin and in Viet Nam.
Table 2: Waste composition in Da Nang City, Source: JICA Study on Solid Waste Management in Viet Nam, March 2011
Waste type Percentage (%)
Organic matters 68.47
Paper 5.07
Textile 1.55
Wood 2.79
Plastic 11.36
Leather and rubber 0.23
Metal 1.45
17
https://baodanang.vn/channel/5403/201510/xay-dung-huyen-moi-truong-hoa-vang-nhieu-thach-thuc-
2448061/
23Glass 0.14
Porcelains 0.79
Soil and sand 6.75
Hazardous substances 0.02
Mud 1.35
Miscellaneous 0.03
Total 100
Table 3: Waste composition in Viet Nam, Source: The World Bank, March 2012
Waste type Percentage (%)
Organic matters 60
Paper 2
Plastic 16
Metal 6
Glass 7
Miscellaneous 9
Total 100
Figure 8: Waste composition in Viet Nam, Source: The World Bank, March 2012
Another analysis of waste composition done in Da Nang City in 2015 is from Centre of Environmental
Protection Research (Da Nang University). The analysed waste composition was however done for a
very short-time and therefore it’s difficult to represent waste composition for Da Nang City.
24Hoi An City did recently analyse municipal waste composition which is presented in Table 4 and
Figure 9 below.
Table 4: Waste composition in Hoi An City, Source: Hoi An CPC, 2018
# Items Compositions Percentage (%)
1 Organic waste (for Food waste 16.6
composting)
2 Garden waste 29.1
3 Tissues 2.8
4 Tea/coffee residuals 0.8
5 Recyclable Carton 2.7
materials
6 Newspaper, books, journalists 0.7
7 Alumni cans 0.2
8 Iron cans 0.3
9 Plastics 1.7
10 Pet bottles 0.7
11 Mix Waste (for Waste from sea foods 2.8
disposal)
12 Textile 9.4
13 Rubbers, industrial leather 0.6
14 Wood 0.2
15 Glass, ceramics 3.1
16 Stone, sand 4.9
17 Nylon, straws, plastic cups 23.4
18 Others 0.0
Total 100.0
25Figure 9: Waste Composition in Hoi An City, Source: Hoi An CPC, 2018
Considering the above-mentioned available waste composition data, it can be concluded that:
• The World Bank waste composition data (Table 3 and Figure 8) is considered more
reliable for the study of solid waste management, especially plastic flow, for VGTB River
Basin (except for Hoi An city). In Viet Nam in recent years, the plastic consumption,
especially single-use plastic bags/packages, has significantly increased. This factor will be
considered in calculation of the plastic waste generated in VGTB River Basin, because the
World Bank data on waste composition was done in 2012.
• Hoi An waste composition (Table 4 and Figure 9) will be used for the study of solid waste
management, especially the plastic flow. The high plastic fraction in Hoi An solid waste is
likely linked to the high number of tourists in the city (5 million tourists stayed on
average 2.2 days in the city in 2018). The plastic fraction (26%) in Hoi An solid waste is
still exceptionally high, even when compared to other touristic places. In order to apply a
relatively conservative approach to estimating plastic leakage the study uses a
discounted percentage of 20% for the plastic fraction. This generates relatively lower
leakage numbers but considers that in touristic areas more attention is given to
cleanliness and the combatting of littering. In addition, in recent times more activities try
to reduce the use and leakage of plastics. The effect of these is not yet reflected in the
composition analysis shown above. The study therefore assumes the discounted value of
20% to be more realistic for the current situation.
Estimation of waste generation
There is no credible data depicting the waste generation rate in Viet Nam. Time for the field survey
(from Oct 20th – Oct 31, 2019) was very limited, the following data, presently used by local
authorities, will be therefore suggested for use in this study.
- Waste generation rate in Quang Nam Province (except for Hoi An city): 0.42 kg/capita/day.
- Waste generation rate in Hoi An City: 0.7 kg/capita/day;
- Waste generation rate in Da Nang City: 0.8 kg/capita/day.
The basis for calculation of waste generated in VGTB River Basin is presented in Table 5. Results of
municipal waste and plastic waste generation in the basin are presented in
26Table 6 and is illustrated in Figure 10 and Figure 11.
Table 5: Calculation factors of solid waste and plastic waste generation in VGTB River Basin
Description Urban Rural Coastal
Waste generation rate in
0.7 – 0.8 0.42 0.42
kg/person/day
Commercial, industrial,
20% - 30% 15% 15% - 20%
institutional waste
Only urban, 0.75
Tourism waste
kg/tourist/day
17% (Da Nang)- 20%
Plastic fraction of MSW 16% 16%
(Hoi An)
Estimated reduction of uncollected
7.5% 4% 7.5%
plastics through separation efforts
Dai Loc, Nong Son,
Hoi An, Duy Xuyen, Que Son, Hiep Duc,
Da Nang urban Communes of Dien
Districts in Quang Nam Province Tien Phuoc, Bac Tra
districts Ban, Hoi An, and
(Section of VGTB River Basin) Mi, Man Tra Mi, Dong
Duy Xuyen
Giang, Tay Giang,
Nam Giang, Hoa Vang
Cam Le, Hai Chau,
Lien Chieu, Ngu Hanh
Districts in Da Nang City Hoa Vang none
Son, Son Tra, Thanh
Khe
Table 6: Calculation of plastic waste generation and unmanaged waste
Description Unit Urban Rural Coastal Total
Population inhabitants 1,208,245 699,196 251,697 2,159,138
Household waste generation ton/day 926 294 106 1,326
Commercial waste generation ton/day 225 44 16 285
Tourism waste generation ton/day 38 - - 38
Total Municipal waste generation ton/day 1,189 338 122 1,649
Total Plastic waste generation ton/day 206 55 20 281
27Average waste service coverage % 95% 60% 63% 86%
Total uncollected waste ton/day 54 137 45 236
Total uncollected plastics ton/day 9.3 22.1 7.3 38.6
The total solid waste (SW) generated in VGTB River Basin (Figure 10) is the sum of waste generated
by households (HHs), the premises (industries, Commercial centres and institutions), and waste from
tourist activities, both in Quang Nam Province and Da Nang City.
Figure 10: Waste generation per cluster
Figure 11: Waste generation per cluster and source
Management of plastic waste
Generally, plastic wastes are not separately collected in VGTB River Basin. The plastic wastes can be
divided into recyclable and non-recyclable.
28• Non-recyclable wastes or low value plastics (often single-use plastic bags, packages, straws,
etc), which account for the largest fraction of the total plastic waste generated, are collected
together with other types of municipal waste and are disposed of at the landfills.
• Recyclable plastics, due to its value, are often informally recovered: 1st by households/waste
generators; 2nd by waste pickers/collection workers along the waste collection pathways; and
3rd (finally) by waste pickers at the landfills. There is however no data about the amount of
recyclable plastic waste recovered by this informal sector.
• In addition, in recent years, there are a number of good initiatives voluntarily implemented
by individuals, business and government offices in reduction of plastic use. A number of good
examples of plastic reduction efforts observed during the field survey is presented in Table 7.
Table 7: Efforts of plastic waste reduction/recovery in VGTB River Basin
Individuals/business/ Amount reduced
# Plastic waste reduction efforts
institutions kg/day tons/year
I Quang Nam Province
Elimination of PET bottle water
Government offices
(estimated 100 PET bottles reduced
(including those in Hoi 2.9 0.09
per day, with weight of about 29
An City)
1 g/bottle)
Initiative in reduction of single-use
Women in the
plastic bags by using more No data No data
province
2 sustainable bags
II Hoi An City
Volunteer collection of waste in Hoai
River (about 500 - 700 kg/every
Saturday). About 80% plastic waste
Long Kayak Tour 80 3.84
and about 80% of collected waste is
directly from water-based plastic
1 pollution
Reduce about 48,000 PET bottle
water use in 2018 or about 132 PET
Jack Tran Tours 3.83 1.40
bottle/day, by serving tourists water
2 from glass bottles
General Managers
Reduce about 1,000 PET bottles
(GEM) of a group of 3-
water/day, by serving water in glass 29 10.59
star hotels in Hoi An
bottles
3 and Da Nang City
Reduce plastics by serving glass
EMIC Hospitality/The
bottle water, non-use of single-use No data No data
Field Restaurant
4 plastic bags/packages
29Individuals/business/ Amount reduced
# Plastic waste reduction efforts
institutions kg/day tons/year
Reduce 3,444 plastic bottles in 11
Elision Refill Shop 0.30
5 months
III Da Nang City
Non-use of PET bottle water
Government Offices (estimated 150 PET bottles reduced
4.35 1.57
in the city per day, with weight of about 29
1 g/bottle)
Recyclable materials
Recovery Center, Hai Recovery of recyclable plastics 7.43 2,711.95
2 Chau District
Total plastic reduced/recovered in VGTB River Basin 127.81 46.65
Uncollected plastic waste (38.6 tons/day) as calculated in Table 8 includes recyclable and non-
recyclable plastics. The recyclable fraction, due to its value, are partly reduced and recovered by
volunteer activities as mentioned in Table 7; partly recovered by individual households, waste pickers
and waste collection workers. There is no valid estimate of the quantities that are being recovered
through these activities. The remaining amount (mainly single-used plastics) is uncontrolled or freely
dispersed in the environment, either on land or in water bodies/ocean. Table 8 summarises the
uncollected waste flows in the VG-TB River Basin.
Table 8: Calculation of unmanaged plastic waste
Description Unit Urban Rural Coastal Total
Total Plastic waste generation ton/day 206 55 20 281
Total uncollected plastics ton/day 9.3 22.1 7.3 38.6
Estimated reduction of uncollected
plastics through separation/recovery ton/day 0.7 0.9 0.5 2.1
efforts
Total unmanaged plastics ton/day 8.6 21.2 6.7 36.5
Percentage of unmanaged plastics out of
% 4.3% 38.4% 25.9% 13.0%
the total plastics
In brief, the flows of solid waste and plastic waste in VGTB River Basin are summarized in Figure 12.
30Figure 12: Flows of solid waste and plastic waste in VGTB River Basin in ton/day
The Waste Flow Diagram Method (still under development) was used to assess the fates of
unmanaged plastic waste into the environment. This includes the different sources of pollution, such
as uncollected waste, leakages from waste management services, landfills and activities of the
informal and processing sector. The model is based on secondary data and field observations that
then estimate the amount of potential leakage into the environment and water bodies in particular.
Table 9 gives an overview of the results first on the total amounts of plastic waste and its flow within
the waste management system. These numbers are slightly different from the numbers above as
they were calculated through the model. The model uses slightly different assumptions on various
flows than the secondary data-based calculations in
Table 6 and Table 8.
Table 9: Waste Flow Diagram: Plastic waste management in ton/year
Waste Flow Diagram - Waste management results summary
Plastic waste
TOTAL Urban Rural Coastal
Municipal solid waste generation
113,452 86,797 19,600 7,056
(ton/year)
Collected waste (ton/year) 99,929 83,234 12,074 4,621
Collected waste 88% 96% 62% 66%
Uncollected waste (ton/year) 13,524 3,563 7,526 2,434
31Uncollected waste 12% 4% 38% 35%
Waste recovered for reprocessing
7,998 6,732 756 510
(ton/year)
Waste recovered for reprocessing 7% 8% 4% 7%
Recovered for reprocessing by formal
0% 0% 0% 0%
sector
Recovered for reprocessing by informal
7% 8% 4% 7%
sector
Energy from waste (ton/year) 0 0 0 0
Energy from waste 0% 0% 0% 0%
Disposal in designated disposal sites
91,672 76,342 11,251 4,078
(ton/year)
Disposal in designated disposal sites 81% 88% 57% 58%
All quantities are displayed in ton per year. The table shows the significantly higher collection rate in
urban areas compared to rural and coastal communities. On average for the whole VGTB delta about
12% of all plastic waste is not collected. This corresponds to 13,524 tons of uncollected plastics per
year compared to 113,452 tons generated. Separate collection and recycling are relatively low with
only 7% being captured informally with no formal system in place. This includes estimates for the
informal picking activities. The calculation is based on available secondary data thus it cannot be
verified to what extent the reduction measures displayed in Table 7 are already reducing the
amounts presented here.
The following table shows the estimated fates of the unmanaged waste. Unmanaged waste is a
combination of uncollected waste as displayed in Table 9 and leakages from waste management
operations such as collection, treatment and final disposal.
Table 10: Waste Flow Diagram: Mismanaged plastic waste in ton/year
Waste Flow Diagram -
Mismanaged plastic waste results summary
Plastic waste
TOTAL Urban Rural Coastal
Unmanaged plastic waste (ton/year) 13,783 3,723 7,593 2,467
Unmanaged plastic waste 12% 4% 39% 35%
Contribution from uncollected waste 98.12% 95.71% 99.12% 98.66%
32Contribution from collection service
0.27% 0.16% 0.30% 0.33%
leakage
Contribution from informal value-chain
0.16% 0.37% 0.06% 0.13%
collection leakage
Contribution from formal treatment 0.00% 0.00% 0.00% 0.00%
Contribution from informal treatment 1.28% 3.69% 0.31% 0.64%
Contribution from transportation to
0.17% 0.06% 0.21% 0.23%
designated disposal sites
Contribution from designated disposal
0.00% 0.00% 0.00% 0.00%
sites
Plastic waste retained on land (ton/year) 6,851 2,792 3,061 998
Plastic waste retained on land 50% 75% 40% 40%
Plastic waste openly burnt (ton/year) 1,992 0 1,505 487
Plastic waste openly burnt 14% 0% 20% 20%
Plastic waste retained in drains(ton/year) 672 217 232 224
Plastic waste retained in drains 5% 6% 3% 9%
Plastic waste to waterways (ton/year) 4,268 714 2,795 758
Plastic waste to waterways compared to
31% 19% 37% 31%
uncollected plastic waste
Plastic waste to waterways compared to
4% 1% 14% 11%
total plastic waste generated
Applying the WFD for the three distinct clusters delivers the results presented in Table 10. These are
based on a detailed assessment of leakage points and fates for leaked plastics based on information
and observations collected by the survey team in the field. The assessment uses expert estimates
that are guided by clustered analysis of the potential fates. The total amount of leakage occurring in
the system is balanced against measures in place that either tip the leakage towards one or the other
fate or reduce the likelihood of plastics following a certain fate. For example, fully covered drains
with retention systems are less likely to retain plastics than open systems.
The results show clearly that the main contribution to unmanaged waste stems – not surprisingly –
from uncollected waste (average of 98%) and that other leakages are comparatively insignificant.
Based on the observations in the field most of the uncollected waste is retained on land (50%), while
some is either burned or accumulates in drains. The potential average leakage to waterways is
estimated to be around 31% of unmanaged plastic waste with the urban areas releasing only 19%
due to their better collection services and coverage. Due to their large amount of waste generated
this still accumulates to 714 ton/year. A total of 4,268 tons of plastic waste or 4% of the total plastic
waste is estimated to enter the waterways in the VGTB River Basin from municipal waste sources.
33You can also read