Downstream Impacts of Water Pollution in the Upper Citarum River, West Java, Indonesia - Economic Assessment of Interventions to Improve Water Quality
←
→
Page content transcription
If your browser does not render page correctly, please read the page content below
WATER AND SANITATION PROGRAM: TECHNICAL PAPER

Downstream Impacts of
Water Pollution in the Upper
Citarum River, West Java,
Indonesia
Economic Assessment of Interventions
to Improve Water Quality

October 2013
© 2013 Asian Development Bank and The International Bank for Reconstruction and Development/The World Bank

The views expressed in this publication are those of the authors and do not
necessarily reflect the views and policies of the Asian Development Bank (ADB) or
its Board of Governors or the governments they represent, or of The World Bank, its
Board of Executive Directors, or the governments they represent.

ADB and The World Bank do not guarantee the accuracy of the data included in this
publication and accept no responsibility for any consequence of their use.

By making any designation of or reference to a particular territory or geographic
area, or by using the term “country” in this document, ADB and The World Bank do
not intend to make any judgments as to the legal or other status of any territory or
area.

ADB and The World Bank encourage printing or copying information exclusively for
personal and noncommercial use with proper acknowledgment of ADB and
The World Bank. Users are restricted from reselling, redistributing, or creating
derivative works for commercial purposes without the express, written consent of
The World Bank.

ADB recognizes China by the name People’s Republic of China and Vietnam by the
name Viet Nam.

1818 H Street NW
Washington, DC 20433
Telephone: 202-473-1000
www.worldbank.org

6 ADB Avenue, Mandaluyong City
1550 Metro Manila, Philippines
Telephone: 63-2-632-4444
www.adb.org

                                                                                                             THE WORLD BANK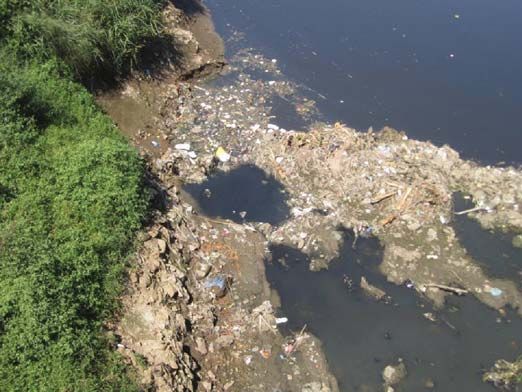
Downstream Impacts of Water Pollution
in the Upper Citarum River,
West Java, Indonesia

Economic Assessment of Interventions
to Improve Water Quality
Acknowledgments

The report is based on the Asian Development Bank’s Tech-                                 sult (MLD). Sjoerd Kerstens wrote the main report. The
nical Assistance undertaken for the benefit of the Ministry                               Ministry of Public Works, Directorate General of Water
of Public Works, Directorate General of Water Resources                                   Resources, has worked with DHV to implement the Tech-
in Indonesia, financed by the Kingdom of the Netherlands                                  nical Assistance by providing valuable input and guidance.
under the project “Institutional Strengthening for Inte-
grated Water Resources Management in the 6 Ci’s1 River                                    In parallel, DHV worked with the World Bank’s Water and
Basin Territory (package B)”. It is a summary report of                                   Sanitation Program (WSP) to conduct economic analysis
“Water quality in Citarum River. Planning interventions to                                of the interventions. Guy Hutton designed the economic
improve river water quality in upper Citarum river (No-                                   analysis and oversaw data gathering, and wrote the eco-
vember 2012).” The ADB project officers for the technical                                 nomic sections of the report. Isabel Blackett was the task
assistance are Thomas Panella and Helena Lawira, who are                                  team leader and Almud Weitz, Enrico Rahadi Djonoputro,
responsible for the pre-publication review. The Technical                                 and Deviariandy Setiawan provided inputs to the study.
Assistance was implemented by DHV, a company under                                        Peer reviewers were Michael Peter Steen Jacobsen, Paulus
the Royal Haskoning DHV group of companies, and the                                       Van Hofwegen, and Ilham Abla. The economics work was
project team consisted of Aart van Nes, Indra Firmansyah,                                 funded through WSP’s Multi-Donor Trust Fund for WSP
and Sjoerd Kerstens in cooperation with Deltares (in par-                                 East Asia and the Pacific, supported by the Government of
ticular Wil van der Krogt) and Mitra Lingkungan Dutacon-                                  Australia.

1
    6 Ci’s means 6 rivers in the provinces of Banten, DKI Jakarta and West Java. Citarum is one of the rivers originating in West Java.

www.wsp.org
                                                                                                                                                       iii
Downstream Impacts of Water Pollution in the Upper Citarum River, West Java, Indonesia
Executive Summary
The Economics of Sanitation Initiative (ESI) of the World indicate a favorable benefit-cost ratio of greater than two,
Bank’s Water and Sanitation Program (WSP) commenced meaning Rp2 of economic return for each rupiah spent.
in East Asia and the Pacific region in 2006 to generate and
disseminate economic evidence on sanitation. A Phase 1 Analysis of the sources of water pollution indicates that
study in five countries of the region, including Indonesia, 64% of biological oxygen demand in the Citarum River
assessed the economic costs of inadequate sanitation to raise is produced by domestic and municipal activities, com-
the profile of sanitation nationally. A Phase 2 study com- pared with 36% from industrial or agricultural activities
pared the costs with the benefits of a range of sanitation in- combined. The significant number of people lacking access
tervention options in five physical locations in Indonesia, to to improved sanitation in the upper Citarum River basin
assist decision makers in their choice of sanitation technol- explains the relatively high contribution of domestic and
ogy and delivery method. Since the demonstrated successes municipal activities: 60% in rural areas and 35% in urban
of ESI in the East Asia and Pacific region, ESI has become a areas. The available improved sanitation facilities comprise
global flagship program of WSP. However, some economic mainly of “septic tanks,” or cubluks,2 installed at the house-
benefits have not been fully evaluated in monetary terms hold level, whereas centralized sewerage systems are avail-
because of methodological difficulties in valuing nonmar- able to only 5% of the population in the upper Citarum
ket impacts, the paucity of underlying data sets, and the River basin. Most of the larger-scale industries have some
difficulties inherent in attributing observed impacts to poor form of wastewater treatment plant, but treatment efficacy
sanitation. Among these hard-to-measure benefits are the is known to be low, and for smaller industries, the avail-
impacts of poor sanitation on water resources. Hence, the ability and performance of wastewater treatment plants are
purpose of this study was to develop and pilot test a specific worse.
methodology for valuing a wider range of impacts related to
water resource pollution in Indonesia. If effective interventions are not taken, water quality will
further deteriorate in the upper Citarum River, resulting
The Citarum River is of vital importance for water supply in an increased threat to public health and affecting the
to both the Bandung metropolitan area, where almost 10 general welfare of the population. On the other hand, with
million people reside, and the greater Jakarta region, which improved water quality, financial benefits can be realized,
houses 25 million people. However, over the past 20 years, related to reduced costs of drinking water production, in-
water quality in the upper Citarum River has been decreas- creased yields from fish farming, enhanced real estate and
ing dramatically, and essential parameters are far outside associated opportunities for tourism, and biodiversity. The
mandatory limits with more than nine times for biologi- corresponding financial benefits of improved water quality
cal oxygen demand and more than 5,000 times for fecal amount to a total of Rp2.1 trillion (US$226 million) an-
coliform in some locations (Royal Haskoning DHV 2012). nually.3 Further benefits can be gained by introducing ad-
This report describes the origin of the pollution, its effect ditional measures that aim to recover resources from waste-
on water quality, and the economic losses resulting from the water and solid waste. Examples are production of biogas
deteriorating water quality. This report also identifies fea- (energy), production of compost, recovery of plastics and
sible interventions for improving water quality and predicts papers of solid waste, and promotion of effluent reuse by
the effect of these measures on water quality. The imple- industries. These additional measures increase the benefits
mentation costs and economic benefits of the interventions by Rp500 billion (US$54 million) annually.
2
These are brick or block-lined, open bottomed tanks, meaning they are effectively leach pits because of the lack of openings in the side walls.
3
An exchange rate of Rp9,440 per United States dollar (US$) was used.
iv Economic Assessment of Interventions to Improve Water QualityDownstream Impacts of Water Pollution in the Upper Citarum River, West Java, Indonesia | Executive Summary
Improvement of water quality to mandatory standards is The roadmap required to bring about improved water qual-
feasible. This requires interventions in both domestic- ity in the upper Citarum River comprises several steps,
municipal levels (by increasing access to improved basic starting with the simple ones and leaving the more com-
sanitation and sewerage or wastewater management) and plicated ones for the future. The recommended approach
addressing industrial pollution. Implementation requires starts with setting up the local organizations to manage
systematic planning, with long-term actions on multiple sanitation development, including implementation of rela-
fronts, comprising establishment and improvement of in- tively simple interventions such as promotion and incen-
stitutions, allocation of adequate funds, and the construc- tives for effective septic tanks, community-based wastewa-
tion, operation, and maintenance of sanitation facilities to ter treatment systems, and improved solid waste collection,
isolate and/or treat wastewater. The following table provides transport, and disposal. It is also recommended to address
the estimated costs and benefits for treating both domestic pollution caused by larger industries at an early stage. How-
and industrial wastewater, including resource recycling and ever, reducing industrial pollution requires both more effec-
reuse. These are values that would pertain in 2030, after tive enforcement of present regulation and improvements
the required interventions have been scaled up, presented to the legal framework. More complicated and larger in-
in 2010 prices. The annualized benefits outweigh the annu- frastructure, such as off-site wastewater treatment systems,
alized costs by a factor of 2.3. The major share of costs are solid waste infrastructure (sanitary landfills), and resource
for improving access to domestic sanitation and wastewater recovery facilities, require more time to successfully imple-
treatment (Rp13.7 trillion, or US$1.5 billion) compared ment and are recommended for the medium to long term.
with industrial interventions (Rp1.6 trillion, or US$172 The introduction and support of resource recovery through
million) over a 20-year period. Hence, the sanitation in- government and private sector actions are highly recom-
terventions not only improve the water quality but also are mended because of its economic attractiveness and pres-
economically attractive. Moreover, some benefits have been ervation of scarce resources. It is therefore recommended
excluded because they could not easily be monetized, so the to start planning for resource recovery infrastructure at an
ratio of benefits to costs could be significantly greater. early stage.
Domestic wastewater treatment and industrial wastewater
Variable treatment and reuse
Rp (billion) US$ (million)
Investment cost (over 20 years) 15,794 1,670
Annualized costs, including recurrent costs 1,164 129
Annual benefits 2,631 280
Benefit-cost ratio 2.3 2.3
Note: Values refer to when interventions are scaled up in the year 2030, presented in 2010 prices. Rp9,440 = US$1.
www.wsp.org
vAbbreviations
BMA Baku Mutu Air (Water supply standard)
BOD Biological Oxygen Demand
BPLHD Badan Pengendalian Lingkungan Hidup Daerah (Regional Control
Agency of the Living Environment)
BWRP Basin Water Resources Project, component of the Java Irrigation and
Water Resources Management Project (JIWMP) under World Bank
assistance (1995-2004)
COD Chemical Oxygen Demand
ESDM Energi dan Sumber Daya Mineral (Ministry of Energy and Mineral
Resources); the same name is used for the provincial agency for Energy
and Mineral Resources
IPLT Instalasi Pengolahan Lumpur Tinja (sludge treatment installation)
MLD Mitra Lingkungan Duta Consult
PSDA Pengelolaan Sumber Daya Air (Water Resources Management, under
Ministry of Public Works); the same name is used for the provincial
agency for Water Resources Management
PUSAIR Pusat Penelitian Pengembangan Sumber Daya Air (Research and
Development Center for Water Resources); under the Ministry of
Public Works; located in Bandung
Rp Rupiah
US$ United States dollar
USDP Urban Sanitation Development Program (funded by the Royal
Netherlands Embassy)
WWTP Wastewater treatment plant
vi Economic Assessment of Interventions to Improve Water QualityContents
Acknowledgments ................................................................................................................................... iii
Executive Summary................................................................................................................................. iv
Abbreviations ........................................................................................................................................... vi
Content ....................................................................................................................................................vii
1. Introduction....................................................................................................................................... 1
2. Methodology .................................................................................................................................... 3
2.1 Water Quality in the Upper Citarum River .................................................................................... 3
2.2 Pollution Discharge ..................................................................................................................... 4
2.3 Interventions to Reduce Pollution ................................................................................................ 6
2.4 Water Quality Modeling and Scenarios ........................................................................................ 9
2.5 Benefit Estimation ...................................................................................................................... 11
3. Results ............................................................................................................................................ 17
3.1 Water Quality ............................................................................................................................. 17
3.2 Sources of Water Pollution ......................................................................................................... 18
3.3 Impact of Interventions ............................................................................................................... 19
3.4 Cost of Interventions .................................................................................................................. 22
3.5 Economic Benefits of Improved Water Quality ............................................................................ 25
3.6 Cost-benefit Assessment ........................................................................................................... 28
4. Conclusions .................................................................................................................................... 30
References ............................................................................................................................................. 31
www.wsp.org
viiI. Introduction
FIGURE 1.1: THE CATCHMENT OF THE CITARUM RIVER IN RELATION TO THE OTHER FIVE “CI” RIVERS
6 Cis Study Area
Kepulauan Seribu
Kota Cilegon
Kota Serang Kab. Tangerang Kota Adm. Jakarta Utara
Kota Adm. Jakarta Barat
Kota Tangerang DKI JAKARTA Kab. Bekasi
Kab. Serang Kota Adm. Jakarta Pusat
Kota Adm. Jakarta Timur
Kota Adm. Jakarta Selatan
BBWS 3C Kota Tangerang Selatan
Kota Bekasi
Kab. Karawang
(Cidanau-Ciujung-Cidurian)
Kab. Pandeglang Kota Depok
BANTEN
BBWS CIL-CIS
Kab. Indramayu
(Ciliwung-Cisadane) Kab. Subang
Kota Bogor Kab. Purwakarta
Kab. Bogor BBWS CIT Kab. Majalengka
Kab. Lebak (Citarum)
JAWA BARAT
Kab. Sumedang
Kab. Cianjur
Kota Cimahi
Kota Bandung
Kab. Bandung Barat
Kab. Bandung
Kab. Garut
Kab Tasikmalaya
Safe water resources are essential to support a healthy en- metropolitan area, with some 10 million people and many
vironment. Jakarta, the capital of Indonesia, and its con- industries located in the upstream catchments of Citarum,
glomeration houses some 25 million people, and receives causes serious pollution that is the result of domestic, mu-
presently 40% of its domestic, municipal and industrial nicipal, industrial and agricultural-related wastewater flows.
water from a cascade of three large reservoirs in the Cita-
rum River, east of Jakarta, envisaged to increase to 75% to A wide range of economic and social benefits is associated
replace current over-exploitation of groundwater in North- with improved sanitation and wastewater management. In
ern Jakarta. Sufficient water is available, but the Bandung 2008, a study under the Water and Sanitation Program’s
www.wsp.org
1Downstream Impacts of Water Pollution in the Upper Citarum River, West Java, Indonesia | Introduction
Economics of Sanitation Initiative (ESI) estimated that improving sanitation. The report presents an economic
poor sanitation led to an economic impact of Rp56 tril- assessment of interventions to improve water quality in
lion (US$6 billion) annually in Indonesia, or the equiva- the upper Citarum River, thereby not only improving the
lent of 2.3% of national GDP (Napitupulu and Hutton, quality of life of the people in the greater Bandung area,
2008). A second phase of the ESI demonstrated in five field but ultimately of all people downstream depending on
sites across Indonesia that sanitation interventions offer this important water source, including Jakarta. The eco-
good value for money, including for urban solutions with nomic assessment draws on previous economic studies
higher unit investment costs (Winara, Hutton et al, 2011). conducted under the ESI4, and analyses conducted by the
Benefits included health, water, and access time; also in the 6 Ci’s Project on the level of water pollution, the origin
Phase I study, tourism and fishery impacts were assessed. of pollution, and the impact on water quality of possible
interventions. An additional objective of this study was to
This report is a follow-up to the two previous ESI stud- develop and pilot test a specific methodology for valuing a
ies, examining in greater detail the environmental impacts wide range of economic impacts related to water resource
of poor sanitation and associated economic benefits of pollution in Indonesia.
4
The Economics of Sanitation Initiative (ESI) was initiated in the East Asia & the Pacific (EAP) region in 2006 to generate and disseminate economic evidence on
sanitation. However, in the studies to date, economic benefits of reducing the pollution of water resources have not been fully evaluated in monetary terms due to
methodological difficulties in valuing non-market impacts, the paucity of underlying data sets, and the difficulties inherent in attributing observed impacts to poor
sanitation.
2 Economic Assessment of Interventions to Improve Water QualityII. Methodology
The methodology follows six steps, presented in Figure a wide variety of parameters at different locations several
2.1, and described in the following sections.The water times per year. Data from 2001-2009 were used for the fol-
quality model used was the River Basin Simulation Model lowing parameters: COD (Chemical Oxygen Demand),
(RIBASIM), developed by Deltares (Deltares 2009). BOD (Biological Oxygen Demand), Nitrogen components
(NH3, NO2 and NO3), Total Phosphate (PO4-P) and Fecal
2.1 WATER QUALITY IN THE UPPER CITARUM and Total Coliforms. In addition, DO (Dissolved Oxygen)
RIVER and COD profiles were obtained from Pusat Penelitihan
Water quality data in the Citarum River were obtained Pengembangan Sumber Daya Air, the research and develop-
through the Badan Pengendalian Lingkungan Hidup Dae- ment center for water resources of the Ministry of Public
rah (BPLHD), the Regional Control Agency of the Liv- Works, based in Bandung. The locations that are monitored
ing Environment, which measures the water quality on by BPLHD are presented in Figure 2.2.
FIGURE 2.1: SEQUENCE OF METHODOLOGY APPLIED TO ESTIMATE ECONOMIC BENEFITS AND EFFICIENCY
1 Determination of
Water Quality
2 Determination of
Pollution Discharge
from Different Sources
3 Formulation of Interventions
and their Cost
4 Assessment of Impact
of Interventions
on Water Quality
5 Assessment of Economic
Benefit Resulting
6 Conduct of Cost-Benefit
Analysis of Different
Interventions
www.wsp.org
3Downstream Impacts of Water Pollution in the Upper Citarum River, West Java, Indonesia | Methodology
FIGURE 2.2: CITARUM RIVER BASIN AND UPPER CITARUM RIVER BASIN (ENLARGED BOX)
In this study the focal point is the upper Citarum River For specific pollution loads per person, data from Almy
basin, which is the area draining into Saguling reservoir, (2008) were used, shown in table 2.2. In the current study,
but excluding the catchment draining into the Citarum- it was assumed that presented data were typical for class 1
river downstream of Saguling Dam. Pollution discharges (Metropolitan) users. Assuming a similar discharge of pol-
from agricultural, domestic and industrial sources in this lutants for blackwater (wastewater with fecal contamination
area have been assessed, as well as potential investments in from a toilet) per person in areas with different urban status-
this area to reduce the pollution discharges, and the im- es, the amount of pollutant discharge via gray water (waste-
pact of these investments on the water quality of the river water from washing and cleaning) was based on the decreas-
stretches in this area. The area covers the cities of Bandung ing amount of water used by the defined water consumption
and Cimahi, as well as the districts of Bandung and West categories. In more rural areas, a considerable part of pollut-
Bandung. Most people are living in the cities, while most ants—assumed to be 60%—will not enter the surface water
industries are located in Bandung district. body because people use pit latrines, plastic bags, or open
defecation in fields/forests.
2.2 POLLUTION DISCHARGE
Wastewater pollution loads were determined from do- Both water consumption parameters and pollution loads
mestic and municipal, industrial and agricultural sources. were processed using the 2010 population and expected
From domestic and municipal activities, water consump- population development (Scenario C, sustainable growth,
tion (and hence discharge) levels were based on guidelines and 5% economic growth) in RIBASIM. Data on the pop-
from the Ministry of Public Works, shown in Table 2.1. ulation that currently has access to sanitation are based on
It is assumed that 80% of intake water is returned to the Napitupulu and Hutton (2008). These data were adjusted
water system. depending on specific data availability.
4 Economic Assessment of Interventions to Improve Water QualityDownstream Impacts of Water Pollution in the Upper Citarum River, West Java, Indonesia | Methodology
TABLE 2.1: WATER CONSUMPTION PARAMETERS BY TYPE OF URBAN STATUS
Urban status Description Unit domestic water demand (liter/capita/day)
Metropolitan More than 1 million people 190
Large town 500,000–999,999 people 170
Medium town 100,000–499,999 people 150
Small town 20,000–99,999 people 130
Village 3,000–19,999 people 100
RuralDownstream Impacts of Water Pollution in the Upper Citarum River, West Java, Indonesia | Methodology
on the land (SNV, 2013). Therefore, in this analysis we have
assumed that only run-off of rice and palawija fields, on
which collected manure is applied, contributes to pollution
discharged to the water bodies.
The impact of municipal solid waste discharged into wa-
terways is from direct water pollution of organic and nu-
trient loads, blockage of water ways, negative aesthetic
impact, and loss of materials that have value, such as or-
ganic wastes and plastics. This study ignored the COD,
BOD, N, P, and pathogen content of such waste because
the water pollution load from municipal solid waste is
known to be small compared with that from other sourc-
es. However, the required costs to prevent solid waste en-
Municipal solid waste accumulating on the Citarum River bank
(Photo credit: Aart van Nes) tering the water bodies, and the associated benefits, are
part of the study.
Agricultural water demand was based on RIBASIM data 2.3 INTERVENTIONS TO REDUCE POLLUTION
(2010 and 2030) for technical and nontechnical irriga- Given the small contribution of agriculture to the overall pol-
tion. Pollution discharge was based on the Basin Water Re- lution of water resources5 and the challenge of finding imple-
sources Planning (2000) study (a component of the Java mentable interventions to reduce pollution, the focus of this
Irrigation and Water Resources Management Project under study was on interventions to reduce domestic and municipal
World Bank assistance [1995-2004]), shown in table 2.4. wastewater, industrial wastewater and solid waste, and inter-
ventions to increase the rate of resource recycling.
West Java has a considerable number of beef and dairy live-
stock farms. According to the livestock statistical year book For domestic and municipal interventions, three types of
of the Ministry of Agriculture, about 125,000 dairy cows main system were distinguished, that is, on-site systems,
and 325,000 beef cattle are kept in the whole of West Java. community-based systems, and off-site systems. The features
Discussion with representatives of the dairy industry and of each of these systems are summarized in table 2.5 and
livestock experts show that typically farmers keep about are described in detail elsewhere (Urban Sanitation Devel-
2-4 cows per household. Manure is generally collected in opment Program 2012). Following the approach developed
stables and dried or composted and applied on the land under the Urban Sanitation Development Project (funded
twice a year as a fertilizer for crop production. Occasion- by the Royal Netherlands Embassy), the feasibility for appli-
ally the manure is collected and digested, producing biogas cation depends on the combination of residential population
used for cooking after which the remaining slurry is applied density, urban functions as well as groundwater problems.
TABLE 2.4: POLLUTANTS DISCHARGED TO SURFACE WATER BODIES
Pollutant (g/yield/ha)
Crop
COD BOD TN TP Total fecal coliforms
Rice 45 22.5 21.5 6.5 0
Palawijaa 34 17.0 4.6 0 0
Source: BWRP 2000.
Note: COD = Chemical Oxygen Demand; BOD = Biological Oxygen Demand; TN = total nitrogen; TP = total phosphate.
a
Nonrice food crops such as corn (maize) and soy beans.
5
Overall, agriculture contributes 8% of BOD, 6% of COD, 15% of nitrogen, and 18% of phosphorous (Royal Haskoning DHV 2012).
6 Economic Assessment of Interventions to Improve Water QualityDownstream Impacts of Water Pollution in the Upper Citarum River, West Java, Indonesia | Methodology
TABLE 2.5: OVERVIEW AND FEATURES OF APPLICABLE SANITATION OPTIONS IN THE INDONESIAN CONTEXT
Main category On-site systems Hybrid: Community-based systems Off-site systems
- Shared - Communal septic tank - Medium: decentralized
Sub-division - Individual (Ind.) - WWTP communal - Centralized
- MCK++ with connections
User interface No running water required Running water/pour flush toilets preferred Running (tap) water required
No sewer system Community sewer system Simplified/sanitary/conventional
Transport system
sewer system
Containment via septic Septic tank/ABR + filter MCK+: digester + Anaerobic, aerobic or pond
Treatment system
tank ABR + filter systems
Final disposal Centralized septage treatment system (IPLT) Sludge treatment at site of WWTP
Sample picture
Note: MCK = Mandi Cuci Kakus (public bathing, washing and toilet facility); ABR = Anaerobic baffled reactor; WWTP = Wastewater treatment plant.
TABLE 2.6: ASSUMED REMOVAL EFFICIENCIES IN WATER TREATMENT SYSTEMS
System
Removal (percent)
a
On-site Community-basedb Off-site 2010c Off-site 2030d
COD 30 60 65 85
BOD 40 70 65 90
TN 5 5 80 80
TP 5 5 55 70
Fecal Coliforms 75 95 99.990 99.999
Note: COD = Chemical Oxygen Demand; BOD = Biological Oxygen Demand; TN = total nitrogen; TP = total phosphate.
a
Mgana 2003; Tchobanoglous et al. 2004.
b
Kerstens et al. 2012; Tchobanoglous et al. 2004; Ulrich et al. 2009.
c
Bojong Soang data (2010).
d
Author’s estimate.
The Urban Sanitation Development Program has developed (b) textile makers producing other types of textile (no reac-
tools that allow for rapid assessment of required budget and tive dyes), and (c) food & beverage, paper & pulp, and other
time to install each type of intervention. Figure 2.3 shows the industries. Note that the design of the wastewater treatment
typical prices per person served.6 The main industries operat- plant (WWTP) treating this type of wastewater is based on
ing along the upper Citarum River include electronics, food the design of a typical dairy industry WWTP.7
& beverage, metal, paper, pharmaceutical, rubber, and tex-
tile. To determine the type and costs of industrial wastewa- For each of these types of “uniform” wastewater treatment
ter interventions, three types of design for each typical scale plant construction, capital expenditure, operational expen-
were prepared. Designs were based on treating wastewater diture, and total running costs have been determined based
from (a) textile makers producing batik (with reactive dyes), on the quotation of suppliers, contractors, and the author’s
6
Prices vary for selected types of sewer and treatment systems and land features.
7
Royal HaskoningDHV has visited several dairy producing industries in Indonesia including Ultra Jaya, Frisian Flag Indonesia and Nestle. The proposed wastewater
treatment process flow diagram in the current analysis is based on the typically applied systems by these industries.
www.wsp.org
7Downstream Impacts of Water Pollution in the Upper Citarum River, West Java, Indonesia | Methodology
estimate. Based on the expected life span of investments, very high quality, and all water that cannot be reused and is
annualized costs are estimated for the year 2030, applying a discharged in the system will directly result in improvement
discount rate of 10%. For cost determination, it is assumed of water quality.
that 70% of the textile industry is typically batik industry
(applying system 1) and 30% produces a different type of Recycling of municipal solid waste is assumed to be pro-
textile. In addition, it is assumed that 50% of all indus- cessed at two regional sites for the whole of the upper
tries that already have a treatment system need to upgrade Citarum River basin, following the 3R principles (reduce,
their system before 2030. Note that the costs for treatment reuse, recycle). At each regional facility, solid waste is first
of chromium (for example, used in leather/tannery indus- sorted, both manually and mechanically. Plastic, papers,
tries), phenols (certain types of textile industries), and met- and other recoverable materials are put aside and sold for
als such as fluoride (electronic industries) have not been local market prices. Separated organic waste is first di-
calculated separately. gested, which results in the production of biogas. Biogas
contains a high (roughly 65%) methane content that can
In these treatment schemes, the treated effluent is dis- be converted in a combined heat power unit; the diges-
charged (back) into the surface water. However, the Band- tate (outgoing mixture) is then composted (possibly with
ung area is known for its severe subsidence as a result of some park and garden waste to add structure), resulting
overabstraction of groundwater, with approximately half of in the production of compost that can be sold. Finally,
the industries using groundwater. Minimizing groundwa- all matter that cannot be treated biologically or have no
ter use can reduce land subsidence; however, reliance on direct value are sent to a landfill. Because the major part
surface water will increase only if its quality is improved. of organics has been removed, landfill gas treatment and
In that case, effluent reuse, following a subsequent treat- leachate treatment require only limited work. Figure 2.4
ment process, can be considered. “Produced” water is of illustrates the process.
FIGURE 2.3: TYPICAL COSTS OF WASTEWATER TREATMENT SYSTEMS PER PERSON SERVED, BY URBAN AND RURAL
CLASSIFICATION AND POPULATION DENSITY
6.0
Investments: million Rp per new person served
Centralized
5.0
Medium
Decentralized
4.0
3.0
2.0
On-site
1.0
Community-based
System
-Downstream Impacts of Water Pollution in the Upper Citarum River, West Java, Indonesia | Methodology
FIGURE 2.4: SOLID WASTE PROCESSING AND FINAL DISPOSAL
Biogas to electricity
1. SORTING 2A. ELECTRICITY
1. SORTING
PRODUCTION IN
(Manual + Mechanical) CHP(Manual
(Combined
+ Mechanical)
Heat Power) UNIT
Plastic and paper
Mixed
Solid
Waste
Organic Digestate
waste
1.1.SORTING
SORTING 1. SORTING 1. SORTING
2. DIGESTION 3. COMPOSTING
(Manual
(Manual ++ Mechanical)
Mechanical) (Manual + Mechanical) (Manual + Mechanical)
Non-recoverable
material
1. SORTING
4. SANITARY
(Manual LANDFILL
+ Mechanical)
2.4 WATER QUALITY MODELING AND Table 2.7 presents the effluent requirements.
SCENARIOS • Scenario 1: Current situation (2010)
RIBASIM was developed for the whole 6 Ci’s area. The small- • Scenario 2: Reference case for 2030, assuming con-
est unit captured in RIBASIM is the water district. A water dis- tinuing current trend with no interventions
trict is hydrologically defined and is different from an admin- • Scenario 3: Treat domestic wastewater
istrative area. It can cover multiple kelurahan or kecamatan8; • Scenario 4: Treat industrial wastewater, differentiat-
moreover, in one kecamatan, more than one water district may ing all industries (4A) or large industries only (4B)
be present. In this study, nine water districts in the upper Cita- • Scenario 5: Treat domestic and industrial wastewater
rum or Bandung catchment were taken into consideration. • Scenario 6: Treat domestic and industrial wastewater
Figure 2.5 presents the tool that was developed for these water and recycle industrial wastewater.
districts. The model is used for simulation of various interven-
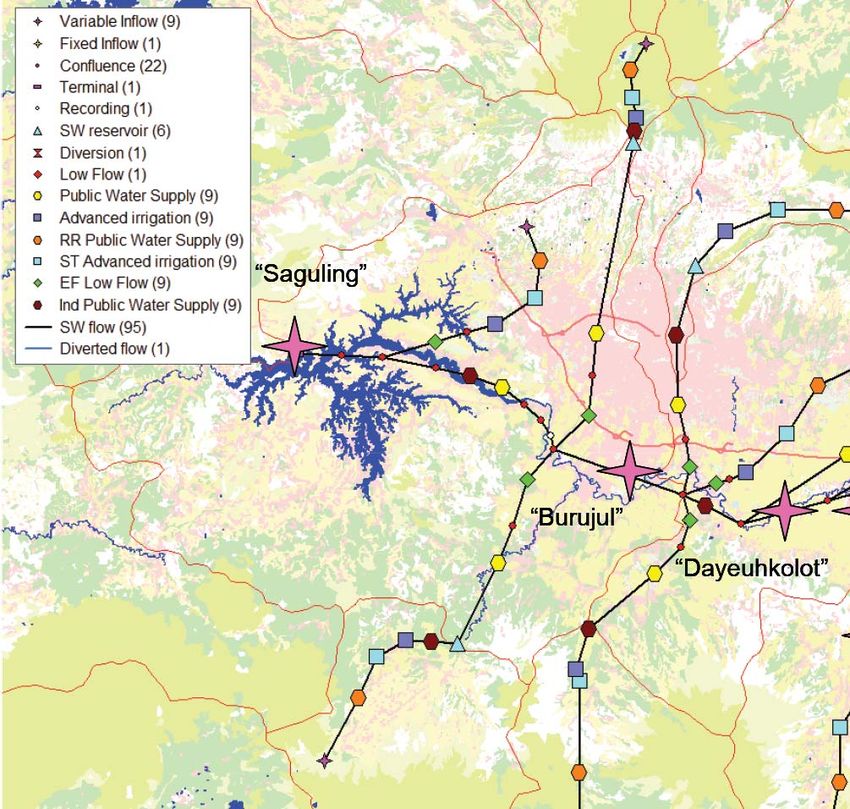
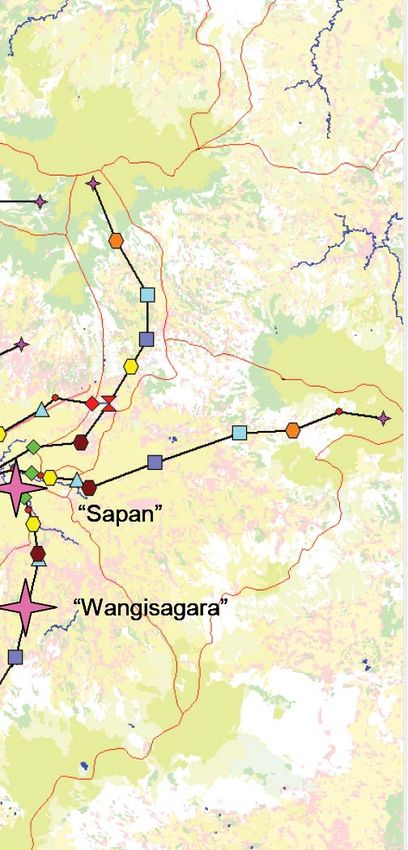
tions to analyze the impacts. Pink stars indicate locations with Table 2.7 presents the requirements for the effluent from in-
simulations reported on in the current study. dividual industries as established by the environmental man-
agement board BPLHD for 2010 and stricter requirements
To set priorities, the effect of different interventions needs assumed for 2030, as well as the requirements for the river
to be analyzed and compared with each other. For this pur- flows (effluent diluted by river discharges) or Baku Mutu Air
pose, six scenarios were developed. Annex 2 provides fur- (water supply standard; BMA) as specified in general (class II
ther detail on these scenarios. rivers) by the Ministry of Environment in Indonesia.
8
In Indonesia, a province is composed of cities (kota) and regencies (kabupaten). These are, in turn, divided in subdistricts (kecamatan), which are further divided into
administrative villages (kelurahan or desa).
www.wsp.org
9Downstream Impacts of Water Pollution in the Upper Citarum River, West Java, Indonesia | Methodology
FIGURE 2.5: RIBASIM AND LOCATIONS WITH SIMULATIONS IN THE UPPER CITARUM
TABLE 2.7: EFFLUENT REQUIREMENT AND CURRENTLY APPLICABLE WATER QUALITY STANDARDS
Effluent requirements
Currently required water quality
Domestic Industrial
Parameter Unit standard in Citarum River
No. 112 (2003) by values class II (BMA)b
BPLHD (2010)a Assumed (2030)
Ministry of Environment
BOD mg/L 100 60 20 3
COD mg/L - 150 100 25
TSS mg/L 100 50 50 50
Phosphate mg/L - - 10 0.2
Ammonia mg/L - 8 5 -
Total nitrogen mg/L - - 10 -
Sulfide mg/L - 0.3 0.3 0.002
Oil and grease mg/L 10 3 3 1
Phenol mg/L - 0.5 0.5 0.001
Chromium mg/L - 1.0 1.0 0.05
pH - 6-9 6-9 6-9 6-9
Note: BOD = Biological Oxygen Demand; COD = Chemical Oxygen Demand; TSS = Total suspended solids; mg/L = milligrams per liter
a
BPLHD standards refer to the effluent an industrial WWTP has to comply with.
b
BMA refers to the water quality standards of the receiving water body as per Government Regulation PP 82/2001.
10 Economic Assessment of Interventions to Improve Water QualityDownstream Impacts of Water Pollution in the Upper Citarum River, West Java, Indonesia | Methodology
Current legislation for domestic wastewater treatment only garding access time, water treatment costs, environment,
requires removal of BOD, TSS, and grease. In comparison and reuse costs will be achieved if water quality is improved
with legislation in neighboring countries, the Indonesian re- accordingly (see next section). With respect to public health
quirements are not very stringent. For example, the BOD re- improvements, a major benefit is already expected by mov-
quirements in the Philippines (No. 35, Series of 1990), Ma- ing from unimproved or open defecation to improved
laysia (PU(A) 398/2000), Viet Nam (TCVN 6772-2000), sanitation. This will drastically reduce the chance of direct
and the People’s Republic of China (GB18918-2002) are contamination for humans. In addition, note that the mod-
30-80 mg/L, 20-50 mg/L, 30-40 mg/L (levels 1-3), and 10- eled fecal coliforms value (1,000 units/100 mL) will not be
40 mg/L, respectively. In addition, most of these also refer to reached in the upper Citarum River, where values will be
maximum coliform values in the effluent, whereas no such approximately 100 times higher. However, it must be noted
standard is present in the Indonesian guidelines. The World that in the analysis, the kinetic die-off10 of pathogens is not
Health Organization (2006) has defined several standards included, whereas this is likely to happen as a result of ex-
for reuse in agriculture or aquaculture, which are 103–104 posure to sunlight. The Indonesian drinking water regula-
units coliforms/100 mL (depending on the type of applica- tion (no. 492) for 2010 requires the complete removal of all
tion). However, in the water quality standard (Value Class coliforms, which will further limit direct contamination of
II) of these guidelines, the maximum total and fecal coli- water obtained from the Upper Citarum River. Please note
form values are, respectively 5,000 and 1,000 units/100 mL. that the usual practice in Indonesia is to boil the drink-
The Indonesian industrial standards are much more strin- ing water to remove fecal contamination, which the cost is
gent than the domestic standards and are comparable with borne by every household
the standards in neighboring countries. In the analysis of
this study, removal efficiencies for modeled parameters have 2.5 BENEFIT ESTIMATION
been assumed that result in better quality than the domestic Following the methodology for cost-benefit assessment de-
requirements (see table 2.6). veloped under the Economics of Sanitation Initiative (Wi-
nara et al. 2011), for this study, in the Citarum River basin,
Although data on BOD and COD are plentiful,9 limited the range of impacts of poor river water quality were as-
data are routinely reported on heavy metals. To fill this gap, sessed to decide which were the most important and quan-
Mott MacDonald (2011) conducted surveys, where ad- tifiable for valuation in monetary terms. Because the aim
ditional water quality parameters are reported. The study of this study was to assess the efficiency of sanitation inter-
concluded that the heavy metals causing the main potential ventions, the study compared the estimated costs with the
risks are iron, manganese and nickel. Concerning pesti- estimated economic benefits of the sanitation and waste-
cides, the study concluded that these are not traceable. An- water management interventions under the six scenarios.
other study by DHV in 2011 examined the availability and The annual equivalent costs and benefits are both estimated
application of pesticides in the project area (upper Citarum for the year 2030, when the interventions have been scaled
basin) and concluded these do not pose a serious hazard up and are operating at their planned level. Because it is
in this area. Internationally banned pesticides were not difficult to estimate benefits separately for municipal and
found in the shops in the project area. The only pesticide industrial water management, these were assessed as one
with some hazard is Carbofuran, but it mostly represents a group in scenario 5 and were then attributed to each sub-
health risk for farmers in the application of the pesticide if component (scenarios 3 and 4) based on the pollution re-
personal protection measures are not taken. duction (biochemical oxygen demand and Escherichia coli)
arising from each intervention. In scenario 6, the benefits of
With reference to the assumed benefits of treating the reusing the various products of wastewater and solid waste
wastewater, it is expected that all anticipated benefits re- were calculated.
9
As reported by PJT II, the agency responsible for water management of the Jatiluhur reservoir and the Citarum River.
10
Pathogens die off because of sunlight and heat.
www.wsp.org
11Downstream Impacts of Water Pollution in the Upper Citarum River, West Java, Indonesia | Methodology
TABLE 2.8: BENEFITS OF IMPROVED SANITATION AND WASTEWATER MANAGEMENT
Benefit Monetized benefits Other benefits (described)
Scenario 5
Health Averted fecal-oral disease from improved on-site sanitation Reduced cases of food poisoning from
and wastewater management - Individual (Ind.) consumption of fish infected by algal blooms
or heavy metal
Averted health impacts of less exposure during flooding
events
Access time Value of time savings from reduced travel time and/or Increased convenience associated with having
queuing for meeting sanitation needs a nearby and available toilet
Water Reduced water treatment costs to households and Increased business investment due to
industries availability of cheap, clean water
Improved fish yields from farming in downstream lakes Reduced frequency and costs of flood events
due to preventing further land subsidence from
excessive groundwater extractiona
Reduced frequency of river and reservoir dredging due to Improved quality of life for riverside
Environment sludge extraction before wastewater release communities
Conservation: preserved biodiversity
Rise in land prices due to improved aesthetics of riverside Tourism opportunities due to improved
and lakeside real estate aesthetics of riverside and lakeside locations
Scenario 6
Compost reuse from sludge and organic municipal solid
Reuse
waste
Biogas generation from wastewater and organic municipal
solid waste
Recycling of municipal solid waste (plastics, papers)
Effluent reuse for industries
Averted maintenance costs of hydroelectric facilities
becoming clogged with solid waste
a
The assumption is that surface water can be sourced more easily and cheaply for municipal and industrial uses, hence reducing reliance on groundwater.
Table 2.8 shows which benefits were monetized and which coverage increase from 54-86%.11 Total health costs include
were described or quantified but could not be monetized. health care costs, health-related losses in productivity (mainly
The estimation methodology is described for each impact. adults), and premature mortality. These costs were estimated
For benefits valued in monetary terms, algorithms were cre- by multiplying the average disease reduction of 36% from
ated detailing the physical benefits and their unit value (see baseline by the average annual health cost per five-mem-
Annex 3). An exchange rate of Rp9,440 per United States ber family from unimproved sanitation of Rp3.16 million
dollar (US$) was used. (US$334), taken from the ESI study in the nearby Tangerang
District (Winara et al. 2011). These costs are made up of
Health. Improved on-site sanitation is a part and precon- health care costs (Rp2.2 million, or US$231), health-related
dition of reduced discharge of human excreta to the envi- productivity losses (Rp782,000, or US$83), and mortality
ronment. The health benefits of improved on-site sanitation (Rp182,000, or US$19). Added to the benefits of basic (on-
were estimated based on the number of households expect- site) sanitation are the incremental benefits of reducing envi-
ed to gain sanitation access from 2010 until 2030, under a ronmental exposure to pathogens through improved waste-
11
Ninety percent in urban areas and 80% in rural areas.
12 Economic Assessment of Interventions to Improve Water QualityDownstream Impacts of Water Pollution in the Upper Citarum River, West Java, Indonesia | Methodology
water management,12 leading to a further disease reduction of scaled to reflect all the flooded communities in the Citarum
20% age points (that is, total disease reduction of 56%). Tar- River basin. This method gave an estimated 15,000 averted
get coverage for wastewater management options was 70% of cases per year. The economic value was estimated by mul-
households, from a baseline of 6%. tiplying the average number of additional cases per year by
the unit cost of inpatient and outpatient services, including
Figure 2.6 shows a clear decreasing trend of occurrences of productivity losses.
diarrhea with improved access to sanitation, demonstrated
using SUSENAS data (BPS 2010). The occurrence of di- Access time. When using a latrine in the home or plot
arrhea in cities and districts with less than 20% access to instead of outside, time is saved. ESI in Indonesia showed
improved sanitation is almost three times higher than those significant time savings for different household members
with over 80% of improved access to sanitation. across five sites, based on over 1,000 interviewed house-
holds. In the Tangerang site, which most closely reflects
For communities who suffer flooding and exposure to con- the Bandung area, an average of 115 minutes per house-
taminated water, there will be health benefits of improved hold was gained per day,13 giving an annual value of
river water quality. This is limited to communities that ex- Rp953,000 (US$101) per household. Only the time of
perience flooding. The number of additional health cases adults and school-aged children was included, valued at
was estimated by comparing reported health cases (infec- 30 and 15% of the hourly rate implied by the GDP per
tious diseases and skin complaints) during a period of sev- capita, respectively. This figure was applied to the access
eral flooding events (January-March 2009) to the same pe- gain of 32% of households for the period from 2010 until
riod in a nonflood year (January-March 2010). This figure 2030 (54% coverage to 86% coverage of access to own
was adjusted to reflect an average year of flooding and was latrine).
FIGURE 2.6: OCCURRENCE OF DIARRHEA AND ACCESS TO SANITATION
40%
% incidence of diarrhea in all household
35%
30%
25%
20%
15%
10%
5%
0%
0% 10% 20% 30% 40% 50% 60% 70% 80% 90% 100%
% access to improved wastewater system
% households with diarrhea at time of survey - each dot represents a Kota (City) or Kabupaten
Average for each 20% category
Source: BPS 2010.
12
This includes septage sludge (septic sludge to be regularly removed from septic tanks) management.
13
This was based on an average of three minutes per trip (journey and waiting time) for off-plot sanitation options in rural areas and eight minutes in urban areas.
www.wsp.org
13Downstream Impacts of Water Pollution in the Upper Citarum River, West Java, Indonesia | Methodology
Water. Improved river and lake water quality will have a the fish capture could increase by 8,000 metric tons per
range of benefits for households and the local communi- year, resulting solely from improving the DO levels. The
ties as well as the wider economy. Some effects are indirect increasing levels of DO from the modeled interventions are
but are potentially very significant. One benefit that can assumed to account for one-third in this expected annual
be easily quantified is the impact of river water quality on gain of farmed fish in the Citarum basin. Current market
the costs of water treatment for use by households, busi- prices of fish of Rp15,000 per kilo are used. This calculation
nesses and industries. Because of the decreasing ground- ignores the contribution of the polluted Citarum River to
water levels and the related issue of land subsidence, water the water quality in the Jakarta Bay area and reductions in
supplies will have to increasingly rely on surface water. fish catch and impacts on livelihoods (Arifin 2004).
Currently, the cost of water treatment using surface water
sources is Rp1,270 per cubic meter. The unit production A further linked benefit of improved surface water quality is
costs of using polluted surface water are higher than those that, over time, water suppliers will rely less on groundwa-
of clean surface water. This is the result of less investment ter sources. In Bandung, as in other locations in Java, there
and corresponding capital expenditure (for example, few- is serious land subsidence in some locations.16 Residential
er treatment steps) as well as lower operational costs (less and other real estate in and around Bandung has subsided
energy and chemicals required). Hence, under scenario 5, by as much as 0.7 meters in the last decade, leading to more
it is estimated that water supply from surface water can be common and more severe flooding events, infrastructure
provided with an average production cost of Rp600 per damage, and corresponding decrease in land prices. Studies
cubic meter, including both capital and operating costs. have estimated how much these areas will continue to sub-
This saving is multiplied by the estimated annual con- side under a business-as-usual scenario. The Master Plan for
sumption of water from surface water sources of 207 mil- the Citarum River Territory (DHV et al. 2012) indicates
lion cubic meters for municipal consumers and 70 million that alternative surface water sources have to be identified
cubic meters for industrial consumers in the year 2030. to the extent of approximately 10-15 cubic meters per sec-
Under this scenario, 54% of water is still sourced from ond. Reuse of water from domestic and industrial sources
groundwater in 2030. will contribute only 20%, or approximately two to three
cubic meters per second, and alternative sources have to
A second impact of improved water quality is that fish be found, such as pumping from the Saguling reservoir or
stocks and production in rivers and lakes will be increased. interbasin transfer from the south of Bandung basin. How-
Although it is difficult to estimate wild capture because of ever, realistically, groundwater will continue to be extracted,
lack of data, the production information on farmed fish in although it is expected that its rate will reduce over time.17
the Citarum River is more accurate. In recent years, the
volume of farmed fish has reduced by 5,000 metric tons Environment. In future years, a reduction in untreated
per year.14 This is thought to have two main causes: dete- wastewater release and dumping of fecal and septage sludge
rioration of overall water quality flowing into the Saguling into rivers will lead to a slower rate of sedimentation in the
reservoir (leading to lower DO levels) and overuse of fish Citarum River. Less sediment means that less regular dredg-
feed,15 which causes fish kills. This latter impact is ignored ing is needed. Sediment from erosion flowing into Saguling
in this study because it is outside the control of sanitation is estimated at 1.3 million cubic meters per year (6 Ci’s Proj-
interventions. It is conservatively estimated that by 2030, ect). However, untreated municipal wastewater is likely to
14
Based on interviews and data from the Fisheries Office.
15
During cooler weather spells, the change in water currents brings to the surface deoxygenated water caused by overuse of fish feed. This, in turn, leads to suffocation
of the fish, causing mass fish kills, which are often reported in the local press.
16
Land subsidence is caused mainly by extracting water from deep aquifers, which are insufficiently replenished in the wet season. This phenomenon is prevalent where
many industries, big malls, housing estates, and hotels extract excessive deep groundwater. Outside these areas, the groundwater basin still has potential to provide
extra deep groundwater.
17
This is an assumption, but it is likely as the problem becomes more serious and politicized, and also, with falling groundwater levels, it becomes more expensive to
extract.
14 Economic Assessment of Interventions to Improve Water QualityDownstream Impacts of Water Pollution in the Upper Citarum River, West Java, Indonesia | Methodology
account for only a small proportion of total sediment, com- These benefits do not fully reflect the impact on the quality
pared with other land-based sources such as run-off from ag- of life of residents who come into regular contact with the
ricultural land and due to deforestation. It is estimated that river, as well as biodiversity. The current state of contami-
10% of sediment is from municipal and industrial sources, nation of the Citarum River has a massive impact on both
or approximately 0.13 million cubic meters per year.18 With aspects, but this is difficult to quantify—although attempts
the cost of dredging estimated at Rp37,760 per ton of sedi- have been made (see results section). Additional field re-
ment,19 the total annual cost averted is estimated. search would be necessary to verify this.
A second major potential environmental benefit is the im- Reuse. The costs of wastewater reuse are estimated in sce-
pact on the price of riverside land. At present, riverside land nario 6, and hence, this section describes how the bene-
is not well developed because of the poor water quality and fits were estimated. There are various potential markets in
flood risk. One of the reasons why riverside property can- products of sanitation and wastewater. These include sludge
not be developed and used is that protection is needed for for fertilizer, biogas for energy, and recovered water for pro-
the river from being further polluted. However, pollution ductive uses. In addition, by recovering these resources,
occurs because wastewater management and regulation are the costs of safe disposal of the original waste products are
not practiced. Under scenario 5, it is expected that the riv- averted. Table 2. 9 shows the parameters used.
erside would be a place where inhabitants, small businesses,
and tourist facilities could be situated. It is expected that the Two other economic benefits are expected. By reducing the
government might allow riverside construction if the reasons solid waste disposal in water resources, the expensive dam-
for the current rules (risk of water pollution from riverside age and management of solid waste in hydropower installa-
properties) no longer apply because wastewater management tions are reduced. Furthermore, application of 3R (reduce,
practices have improved. Hence, with significantly improved reuse, recycle) prevents waste from being deposed in land-
river water quality, the price of land could increase for both fills, which results in averted landfill costs and savings, typi-
land acquisition and final selling of developed properties. cally around 50% of the land required.
Currently, agricultural land in the vicinity of Bandung aver-
ages Rp107,000 per square meter. The current market sug- This study conducted a sensitivity analysis to assess the im-
gests that land prices can climb to Rp713,000 per square pact of uncertainty in input parameters on the benefit-cost
meter in highly desirable locations. This rate refers to land ratios (BCRs). It should be noted that the study assessed
acquisition. There will be further price increases for property only more pessimistic scenarios—to explore whether eco-
that has been developed.20 Inclusion of the latter margin will nomic return would fall below the breakeven point (BCR
fully reflect the eventual benefits of developed land, includ- >1). Because of lack of evidence on ranges for the param-
ing use for tourism. Improved river water quality is assumed eters, lower bounds selected were arbitrary, as follows:
to account for 50% of the differential of Rp606,000 per • Disease rates and mortality were reduced to half the
square meter between agricultural land value and prime real baseline value.
estate before development. The resulting value increment of • Infrastructure remained functioning for 15 years in-
Rp303,000 is multiplied by an estimate for the amount of stead of 20 years.
land developed per year after 2030, which is 50 hectares per • Value of time gained was zero for all children and
year, or 500,000 square meters.21 15% of GDP per capita for adults.
18
Estimated using 40 L of sediment per person per year, 10 million people in Bandung basin, of which 50% are not connected to proper sludge processing.
19
The cost of river dredging is Rp18,880 (US$2) per cubic meter. However, the cost of dredging the Saguling reservoir will be much more because it comes from deeper
parts; hence, the costs estimated are conservative. The cost of disposal for a distance of 1 kilometer is assumed to double the dredging cost, hence an all-inclusive cost
of Rp37,760.
20
Adjusted downward for the investment made by the property developer.
21
Fifty hectares (ha) per year converted to developed land is justified as follows. Currently, the estimated land area within 100 meters of the Citarum river is 2070 ha
(excluding tributaries), distributed as follows: water resources (135 ha), housing and Industry (730 ha), cropland (irrigated ricefield and horticulture) (825 ha), and dry
land (380 ha). In a seven-year period, 380 ha were converted from cropland to housing and industry, or roughly 50 ha per year. There is still considerable potential in
the future for conversion of riverside land currently used as cropland or dry land, as well as land on the banks of the tributaries.
www.wsp.org
15You can also read