Differences in Risk Perception of Water Quality and Its Influencing Factors between Lay People and Factory Workers for Water Management in River ...
←
→
Page content transcription
If your browser does not render page correctly, please read the page content below
water
Article
Differences in Risk Perception of Water Quality and
Its Influencing Factors between Lay People and
Factory Workers for Water Management in River
Sosiani, Eldoret Municipality Kenya
Anne Wambui Mumbi 1, *             and Tsunemi Watanabe 1,2
 1   Graduate School of Engineering, Kochi University of Technology, Tosayamada, Kami City, Kochi 782-8502,
     Japan; watanabe.tsunemi@kochi-tech.ac.jp
 2   School of Economics and Management, Kochi University of Technology, 2-22 Eikokuji, Kochi City,
     Kochi 780-8515, Japan
 *   Correspondence: surannewambui@yahoo.com

 Received: 13 July 2020; Accepted: 6 August 2020; Published: 10 August 2020

 Abstract: This study evaluates the differences between risk predictors and risk perception regarding
 water pollution. Specifically, it focuses on the differences in risk perception between factory workers
 and lay people situated in textile industries near the River Sosiani in Eldoret, Kenya. The lay people
 are divided into two groups. The respondents living downstream are situated mostly in town
 centers and at the mid/lower parts of the river, and the respondents living upstream are mainly
 found at the upper parts of the River Sosiani. Data were obtained from 246 participants using
 questionnaires. Several factors influencing risk perception were selected to evaluate the degree
 of perceived risk amongst the groups. Descriptive statistics, mean score and correlation analyses,
 and multiple linear regression models were used to analyse the data. The one-way ANOVA results
 showed statistically different levels of risk perceptions amongst the groups. The partial and bivariate
 correlation analyses revealed the differences in scientific knowledge between respondents upstream
 and downstream. The multiple linear regression analysis showed that each group used different
 variables to determine risks in the region. In the factory group, 56.1% of the variance in risk perception
 is significantly predicted by sensorial factors, trust in the government’s capacity to manage water
 pollution and the impact of water pollution on human health. About 65.9% of the variance in risk
 perception of the downstream inhabitants is significantly predicted by sensorial factors, the possibility
 of industries generating water pollution, and previous experience with water pollution. For the
 respondents located upstream, age, sensorial factors, trust in the government and the possibility
 of being impacted by water pollution factors significantly predicted 37.05% of the variance in risk
 perception. These findings indicate that enhanced public participation in water governance amongst
 the residents of Eldoret town is needed, along with an understanding of the different characteristics
 of the respondents in the region during risk communication. This will boost awareness in the region
 and promote the adoption of better practices to minimise the adverse effects of water pollution faced
 by the region.

 Keywords: public participation; risk perception; water quality; risk; water pollution

1. Introduction
     The assessment of water quality is a critical activity in the face of the current decline in freshwater
quantity and deteriorating water quality of the remaining available water resources across the globe [1].
At present, 47% of the global population reside in areas that experience water scarcity for at least one month

Water 2020, 12, 2248; doi:10.3390/w12082248                                        www.mdpi.com/journal/water
Water 2020, 12, 2248 2 of 25
each year [2]. Water quality is threatened by continuous population increase, economic developments,
industrial and agricultural activities and climate change. These activities and increased water pollution
have significantly threatened the hydrological cycle. Water pollution continues to increase, mostly as a
result of large-scale industrial and agricultural production. Such activities typically generate large
amounts of wastewater, which when untreated and disposed in water bodies contribute to massive
water pollution.
The major culprits in the industrial sector are textile industries, which use large amounts of water
and complex chemicals during textile processing [3]. These industries use huge amounts of dyes that
are necessary in almost all stages of the process, and these constitute a high percentage of the effluents
generated by these industries. Such effluents comprise one of the most problematic types of wastewater
to be treated, not only for their high chemical and biological oxygen demands, total suspended solids
and content of toxic compounds, but also for their colour [3]. The unsafe polluted waters generated by
these industries can spread diseases such as cholera and typhoid, among other water borne diseases,
amongst the people who use it for food production, washing, cooking, bathing, or other basic daily
activities. There is also a high risk of contamination of groundwater, water supplies from wells
and users of agricultural water sources [4]. Based on these risks, water pollution monitoring and
water quality assessment are essential activities to help water management practices address the
aforementioned challenges.
When addressing the risks posed by declining water quality and water pollution in order to
promote better water management practices across the globe, public participation in governance issues
regarding water resources has been emphasised in the last two decades [5]. Local people’s perceptions
of water quality are an important aspect of the management of water resources as they inform the
dialogue between government officials, who are usually the proponents of remediation projects,
and water service providers, environmental agencies and community leaders [6]. Public participation
highlights the public’s perception of perceived risks, their thought processes and responses with regards
to water quality [6–8]. However, little attention has been paid by the government and other institutions
such as environmental organizations involved in decision-making regarding environmental risks when
promoting public participation [9]. In this regard, the expertise and judgement of other stakeholders
guide the decision-making process even though the local people are the direct recipients of the impacts
of deteriorating water quality and the poor management of resources [10,11]. This situation has
resulted in a disconnect between the public and the decision-makers, leading to poor communication,
lack of collaboration, increased environmental problems and lack of long-lasting solutions to address
the problematic issues [6]. To be effective in addressing the risks around water quality, understanding
the needs and perceptions of the public is vital. It is therefore imperative that policymakers and
researchers engage in an effective public participation process, especially in situations in which public
behavioural changes are required to manage water resources [12,13].
Research on risk has attracted much interest in the last few decades, specifically the study of
the differences in risk judgement among different groups of people [14–18]. The prior literature
has concluded that different groups of people perceive and react to risks differently based on their
location and proximity to a hazard or risk, and their understanding of risk, based on different
cultures and knowledge [14]. Some studies have also suggested that the general reaction of the
public to potential risk could be impacted by social and psychological aspects that are beyond the
capabilities of standard technical risk assessments [17,19,20]. Most of the studies on risk perception have
employed either convenient or population samples of experts with certain skill sets [21–23]. Studies to
elucidate the differences in risk perception between groups have been conducted mostly between
the public and expert groups, and in highly technical fields, such as nuclear power, as illustrated
by Kanda et al. (2012) [21], nanotechnology (Siegrist et al., 2007) [22], biotechnology and genetically
modified organisms (Perko, 2014) [23] and other fields, such as industrial safety [19]. The findings of
these studies reveal that experts generally have lower risk perceptions than lay people, which suggests
that greater communication efforts directed at the public are required for effective risk management.Water 2020, 12, 2248 3 of 25
Within the factory context, the existing literature that has attempted to highlight risk perceptions has
focused mainly on evaluating the use of personal protective equipment (PPE), occupational safety and
accidents [24–27]. To the best of our knowledge, no study has attempted to investigate whether or not
working for particular industries can influence risk judgements, especially in cases in which industries
are responsible for certain environmental issues, and there is a difference in risk perception between
these workers and the public. Investigating such a relationship is important because in order to have
effective solutions for different risks faced by a society, an analysis and understanding of the different
ideologies underlying the risks from all viewpoints is important. For example, important insights can
emerge through investigating if, and to what extent, working in certain industries and corporations
taints the workers’ perspectives with respect to the organisations’ activities. In situations in which the
true feelings of individuals may be overlooked based on their affiliations or jobs, it is important to
understand if a natural bias may develop, which may hinder or slow down problem-solving activities
when such institutions are involved. Furthermore, this knowledge is imperative because employees
constitute an important target group in the research on risk perception, since they work in situations
in which their own actions are likely to have consequences on the actual risks they are exposed
to, and to which the public is also exposed [28]. Moreover, knowledge about these relationships
and viewpoints is important because, if the workers have erroneous conceptions of the risks their
actions pose to the community, leaving the risks unchecked can cause unintended damage to both
them and the community at large. It is therefore important to improve their knowledge and that
of the public [28]. Importantly, the adoption of different risk perception perspectives involves the
collaboration of multiple stakeholders, including the government, environmental and other private
organisations, consultants and local residents. This acknowledgment of the different risk perceptions
of diverse stakeholders within the water sector is vital to facilitate the adoption of sustainable water
use and systems, such as the wastewater treatment of industrial water before discharge in the area.
Based on this idea, the current study sought to investigate the following research questions:
1. Is there a difference in risk perception between factory workers and lay people?
2. Do the two groups (i.e., factory workers and lay people) use different factors to determine
risk perception?
In the water sector, there has been little examination of the role of risk perception in relation
to advancing more sustainable practices in the water management of centralised and decentralised
systems with multiple sources [29]. Recognising and understanding the mix of risk perceptions can lead
to the development of a more effective water management system, through collaboration of all parties
and stakeholders aiming to adopt sustainable practices. Thus, the water industry should accommodate
multiple risk perspectives in the implementation and management of water bodies and wastewater
treatment systems, such as sewage treatment plants and common and combined effluent treatment
plants (CETPs). The current study is different from other studies conducted on the River Sosiani,
which mostly addressed issues of water quality [1,30–32] and water pollution [33–35] of the river and
its environs, with few or no studies focusing on risk perceptions and the local factors influencing
these. Therefore, this study aims to bridge this gap in the literature. Furthermore, given the strategic
importance of the River Sosiani among the residents of Eldoret, its linkages to crucial basins, such as
the Nile River through Lake Victoria, and the rapidly declining water quality of the river, this study is
critical and necessary. The objective of the study is to provide empirical insights into the factors that
influence the risk perceptions of the people living around the River Sosiani based on its decreasing
water quality and the resulting adverse effects. This work also aims to gain a better understanding of
the differences in risk perceptions between factory workers and lay people through an exploratory
analysis of survey data. Investigating these issues will highlight opportunities for increased public
participation around environmental projects in the area. Such participation is necessary to improve the
risk governance and management in the area, and to better understand the needs and perceptions of
the community around the River Sosiani, which is important in providing solutions that are tailored
to that particular region. In addition, the findings from this study can facilitate behavioural changesWater 2020, 12, 2248 4 of 25
among the industries in the region through the adoption of potential low-cost technological options to
treat their wastewater before discharge in the river in order to minimise the adverse effects of industrial
water pollution in the area. For example, the use of locally available options, such as cactus and
diatomaceous earth for wastewater treatment as adsorbents which have been proven to be equally as
effective as activated carbon, which is the most widely used adsorbent in the treatment of industrial
and municipal wastewater, can be adopted by industries in the region [36–39]. Also, given the minimal
success of previous environmental restoration efforts in the River Sosiani area, there is a need to
identify the type, scope and scale of engagement and the corresponding possible methods for inducing
behavioural changes in the people in order to gain insight into the public perception of risk [40–42].
Therefore, a more effective communication process is necessary to gain a detailed understanding of
risk perception and the factors affecting risk judgement to ensure long-term successful projects and
effective water quality management [43].
2. Literature Review
2.1. Risk Research in the Water Sector
Within the water sector, many studies focusing on technical risk assessment have mainly
highlighted the issues pertaining to public health risks, since this is the most direct and noticeable
effect of water pollution or declining water quality. In addition to technical risk assessments, a few
studies have tried to discriminate what risks and types of health risks are perceived to be associated
with drinking water [44]. In a Canadian survey, the respondents identified infectious diseases,
gastrointestinal disorders, cancer, contamination and intoxication as the potential risks resulting
from water pollution [45]. However, the relative significance of the risks relating to water is likely
to vary with the type of water system, water source, extent of personal contact and intended water
use. For example, the perceived risk of using river water may be low for irrigation but high for
drinking. Thus, there should be explicit consideration of the full range of specific risks, about which
the respondents might have subjective responses, in order to prevent potential conflicts within
technical assessments. In most cases, however, direct experiences of adverse effects of the risk are
most effective when making judgements about risk perceptions [44]. In relation to the analysis of
public perception of water quality, with the aim of increasing public participation in water quality
restoration, research has been conducted into many successful river management projects, especially
in the developed countries [13,46–48], such as the Murray River in Australia [13] and the Rhine in
Europe [49]. Furthermore, it is interesting to note that most published studies reported above have
taken place prior to planning an intervention, which is the case especially in water-related studies.
These public risk assessments of water quality are equally as important as the experts’ technical
assessments to ensure complementary decisions that organise the responses to degradation, implement
risk management policies, minimise risks and allocate resources [11,29,50]. Understanding the way a
particular society perceives risk is vital for pinpointing the existing vulnerabilities of a water-related
occurrence, and appraisals of environmental risks that include all stakeholders are an integral part of
promoting environmental sustainability [51].
2.2. Risk Perception and Risk Communication
Identifying local people’s perspectives and judgement of risks is a crucial step in fostering
sustainable governance and providing solutions to water problems. Perception is the principal form of
cognitive processing between humans and their surroundings [52], and it is thus a key component
in understanding human behaviour [5]. Thus, a clear comprehension of how people perceive risk is
necessary when attempting to design and implement solutions that require changes in behaviours
and actions in the management of natural resources [53]. In order to do this, however, we must be
able to determine the risks, interpret them appropriately and understand the subjective judgements,
which are commonly referred to as ‘risk perceptions’.Water 2020, 12, 2248 5 of 25
Risk perceptions arise from uncertainties and are based on a person’s subjective evaluations and
judgements about risks and risk-related choices [54]. Early risk perception studies were founded on the
idea of a knowledge gap between the public and the experts [55,56]. These studies implied that, if the
public could comprehend and access all the evidence around a particular situation, their perceptions of
its risks would be similar to those of the experts [57–60]. However, such an idea has been dismissed in
the realisation that risk perception is a complex product of innate factors and that knowledge is just
one of several factors that determine risk perceptions (i.e., other risk perception predictors) [59,60].
A major factor which influences the public perception of water quality is the risk communication
process [43]. Risk communication refers to the process of interaction and exchange of information
between experts and the affected communities about a risk in order to enable them to make informed
decisions and protect themselves [61]. As in risk management, the main problem that can arise in the
risk communication process is the lack of or inadequacy of the interaction phase [43]. According to
Canter et al. (1992–93) [43], risk communication can be enhanced if the interpretation of the information
presented during the risk communication process is viewed as the most important element, rather than
the accuracy and detail of the information being presented. Some critical issues to consider during risk
communication include variation in the reception of information among different communities; the local
context in which the risk situation is embedded, i.e., attitudes, beliefs and culture of the community;
the medium and the person delivering the message and if the messenger is trusted or distrusted by the
recipients of the message; and the knowledge levels of the people involved. For example, the lack of
knowledge of toxicology by most participants involved in the risk communication process may result
in problems with translating, communicating and comprehending highly technical risk information,
which might, in turn, delay or hinder the risk communication process [43,61]. Any miscommunication
or mistrust in the people’s concerns or understanding of risks could create a gap between the community
and the authority in charge of risk communication, which could obstruct successful policy implication.
A comprehensive risk assessment process should thus encompass an integrative model that involves all
the stakeholders and undertakes both a vigorous technical risk assessment and a risk communication
process that takes into consideration the different risk perceptions of all the stakeholders involved.
The benefits of an integrative model during risk assessment in the water sector include the identification
of new areas vulnerable to hazards, which require further analysis; an opportunity to cross-check
available data as a form of verification; communication of hazardous conditions based on local
knowledge; and direct participation of the public in monitoring the risk condition [11].
2.3. Factors that Influence Risk Perception
The factors that influence risk perception are considered risk perception predictors [55]. Although
much research and many theories, such as the psychometric paradigm and cultural theory [10],
pertaining to risk perception and its predictors have been proposed since the 1970s, these have been
criticised and modified over the years. For example, according to Sjöberg [62], the size of the community,
and education, income and gender variables, which are not included as predictors in cultural theory or
in the psychometric methods of risk perceptions, are actually significant predictors of risk. In addition,
trust factors and the influence of mass media have been found to be significant predictors of risk
perception. The perception of water quality risks is largely influenced by the same cognitive-emotive
processes that affect risk perception in general [44]. Therefore, from the psychometric and cultural
theories perspective, a conceptual framework can be developed based on a number of factors that
influence risk perception, as shown in Figure 1. Discussed below are some of the factors influencing
risk perception that were included in this study.and educational levels.
The following research hypotheses were proposed:
(1) People working for industries and people living in different locations of the River determine risk
perception differently.
(2) Risk
Water 2020, perception is influenced by trust factors, socio-demographic characteristics, water quality6 of 25
12, 2248
perceptions, the nature of the risks involved and psychological and cognitive factors.
Figure
Figure 1. 1.Conceptual
Conceptual framework
framework ofofthe
thepresent
presentstudy.
study.
3. Methodology
Several studies have found the potential influences of socio-demographic factors on risk
perceptions. Gachango et al. [34] and Hodge and Reader [63,64] found that age influenced the likelihood
3.1. Study Area
of farmers adopting the technologies and schemes they were introduced to, in that older farmers were
more likely The
tostudy
adaptwas conducted
to such in July–October
technologies 2019 along
than younger the River
farmers. In Sosiani
contrast,(00°–03′ S and 00°–55’
Giovanopoulou etN;
al. [65]
determined that younger farmers are more likely to adopt certain technologies comparedinto
34°–50′ E and 35°–37′ E), a sub-catchment of the River Nzoia, which is a sub-basin that drains to older
Lake Victoria [35]. The River Sosiani is located in Eldoret (Figure 2), a town in the Rift Valley region
farmers. Previous studies have also found that income levels, education and gender significantly
of Kenya, which serves as the Uasin Gishu County’s capital. It is located at latitude 0.514277 and
predict risk perceptions [66–69]. Based on the inconsistency of the socio-demographic characteristics,
longitude 35.269779 with the GPS coordinates of 0°30′51.3972″ N and 35°16′11.2044″ E [35]. As of 2019,
somethestudies [68]population
reported used thesewas factors as predictor
475,716 variables
[89]. The area when
receives conducting
an average risk
rainfall assessments.
of around 1055 m,In the
current research, these were also used as predictor variables.
with an average temperature of 16.8 °C. The land in Eldoret rises from the Sosiani River Valley. The
Furthermore, trust plays a critical role in people’s behaviours and perceptions towards risk [70].
In the current study, ‘trust’ is defined as the level of trust the respondents have towards an entity—be it
regulatory, industrial or their own community—to minimise and manage risks, as well as the potential
impacts of water pollution in the area. This trust may or may not be dependent on the level of capacity
that various parties presumably have. Trust has been identified as playing a significant role in the
judgement of risks by the public in prior research, which asserted that confidence in the authorities,
especially regulatory ones, strongly influences the degree of the public’s acceptance of risks [62,70–73].
Water quality assessment and judgement influences attitudes towards risks, and the formation of
such judgement depends on certain factors and the attributes of the water quality. Several factors may
influence public perception of water quality and risk, such as bad odour, unusual taste, or change in
colour, which may be interpreted as implying poor water quality and health risks [74]. Of the factors
that rely on the human senses, colour is used mostly when making a judgement on water quality,
and this is combined with the psychological effects of previous events and experiences, which are
internalised through a person’s cognitive responses to dangers [11]. Other factors, such as past
experiences, trust in water service providers, health risk perceptions and demographic variables also
impact people’s perceptions of water quality [6]. For rivers and lakes, contextual factors, i.e., symbols
that are close to water but not part of it, such as those that indicate the cleanness of the river banks or
the presence of or lack of aquatic life, as well as the availability of external information from the media,
have been found to influence the public’s perception and estimation of risks [74]. In their study of the
River Yamuna, India, Withanachchi et al. [11] stated that the aesthetic qualities of taste, colour, smell
and clarity were considered when assessing water quality. They also found that sensorial factors are
used more when making judgements on the river’s water quality than other factors, such as contextual
factors and scientific factors relating to the presence of harmful chemicals [5]. While this might be the
common way of making water quality judgements, emphasis should nevertheless be placed on usingWater 2020, 12, 2248 7 of 25
classification methods, such as the water quality index, to ascertain the actual composition of various
elements present in the water bodies being assessed [75,76].
The factors related to the nature of risks have also been demonstrated to influence individuals’ risk
perceptions. The nature of a risk requires a certain level of technical understanding of the risk, and,
when lay people have access to information, this can influence their risk perception [75]. To explain the
influence of the nature of a risk to risk perception, Janmaimool and Watanabe [10] based their argument
on the axiomatic risk approach that explains that an individual’s perceived risk is influenced by the
probability of occurrence and likelihood of a negative outcome, and they arrived at a similar conclusion.
Sung and Hanna [76] also concluded that differences in risk tolerance and acceptance could vary
depending on an individual’s understanding of the nature of risks, thus underscoring the importance
of these factors when understanding risk perceptions. Meanwhile, the psychological and cognitive
factors associated with perceived benefits and previous experiences with risks, as elaborated by the
psychometric framework, have been applied in previous studies to determine risk perception [10].
Importantly, perceived benefits have been identified as factors that influence one’s attitudes towards
risk [77–82]. In their study on the acceptance of gene technology in food production, Sparks et al. [83]
argued that one’s attitude towards risk is affected by perceived benefits. Based on economic status
and financial differences between the upper class and lower class in Kenya, this factor cannot be
ignored. People’s struggles to meet their basic needs and survive are at the forefront, especially in
Kenya, and may well have an impact on their risk perceptions. The previous research has centred on
income when analysing perceived benefits [78,84–86]. To further explore this factor, the present study
considered the term ‘benefits’ to capture not only the expected income from industries but also other
elements, such as job security and other possible opportunities created by the presence of industries in
the area. All the factors discussed above have been shown to have an impact on risk perception [10].
Thus, it is imperative to assess the relationship between these factors and assess how they can help
shape decision-making and risk communication in the area.
2.4. Study Framework and Hypothesis
On the basis of the literature review of previous studies that are mainly based on the psychometric
paradigm and cultural theories [10,43,87,88] that identify the scope of factors that influence public
perception and response to risk, a conceptual model was formulated for this study. This included
applying a structure that can provide a hypothetically thorough outline of the key determinants of risk
perceptions amongst different groups and highlight risk levels with regards to water quality [6,88].
These determinants were organised into five categories, as shown in (Figure 1). The first category
included the nature of environmental risks, such as the possibility of industries generating water
pollution, the possibility of being impacted by water pollution and the impacts of water pollution
on human health. The second category included factors influencing public risk perception of water
quality, namely, (a) sensorial factors, (b) contextual factors, (c) scientific factors and (d) speculation and
feeling factors. The third category consisted of psychological and cognitive factors, such as previous
experiences concerning the impacts of water pollution and the effects and perceived benefits of industry.
The fourth category included trust factors, which included trust in the government and local industries,
and the local people’s capacity to manage water pollution. Finally, the fifth group of socio-demographic
factors consisted of the respondent’s gender, age, and income and educational levels.
The following research hypotheses were proposed:
(1) People working for industries and people living in different locations of the River determine risk
perception differently.
(2) Risk perception is influenced by trust factors, socio-demographic characteristics, water quality
perceptions, the nature of the risks involved and psychological and cognitive factors.Water 2020, 12, x FOR PEER REVIEW 8 of 27
Sosiani River Basin covers an area of approximately 647 km2, with a length of approximately 67 km.
The River has two main tributaries, the Nundoroto and Ellegeni, which are located in the upper basin
Water 2020, 12, 2248 8 of 25
and are characterised by a steeper gradient. The main activities within the River Sosiani catchment
are wheat, maize and animal farming in the upper zone, which stretches between the plateau and
flax areas; the midstream zone consists of human settlements, industries and hospitals; and the
3. Methodology
downstream zone is an urban environment, which includes the Central Business District (CBD), road
networks, garages and car washes as well as other industries. Many industries in the area have
3.1. Study Area
mushroomed over the years (Figure 2), and the main industries mostly deal with the production of
consumer
The study was goods, such as plastic,
conducted furniture and
in July–October 2019textiles,
along thefoodRiver
processing,
Sosianioil(00 ◦ –030 Sand
refining 00◦ –55’ N;
andcement
◦ 0
34 –50production.
E and 35The ◦ 0
–37primary goods found in this
E), a sub-catchment areaRiver
of the include machinery
Nzoia, which andis transportation
a sub-basin that equipment,
drains into
textiles, petroleum
Lake Victoria [35]. The products, iron and
River Sosiani steel [90].
is located in Eldoret (Figure 2), a town in the Rift Valley region
of Kenya, Over which time, the catchment of the River Sosiani has experienced massive water pollution because
serves as the Uasin Gishu County’s capital. It is located at latitude 0.514277 and
of rapid population growth, industrial development, inefficient agricultural practices, as well as poor
longitude 35.269779 with the GPS coordinates of 0◦ 300 51.3972” N and 35◦ 160 11.2044” E [35]. As of 2019,
land-use planning and solid waste management systems in the area [91]. The industrial effluents
the reported population was 475,716 [89]. The area receives an average rainfall of around 1055 m,
discharged in the River Sosiani from industries in the nearby areas account for a large percentage of
with an average temperature of 16.8 ◦ C. The land in Eldoret rises from the Sosiani River Valley.
water pollution, which has led to a decline in water quality and quantity [92]. To meet daily water
The Sosiani River Basin covers 2
demands, residents rely onanpiped
area of approximately
water, 647 km
borehole water, river, with
watera and
length of approximately
water sourced from the67 km.
The River
lakeshas andtwo
ponds.main tributaries,
Apart from water theshortages
Nundoroto in theand Ellegeni,
area, which also
the population are located in the
faces large upperofbasin
outbreaks
and arediseases, such as by
characterised cholera and typhoid,
a steeper gradient.which are often
The main associated
activities withinwiththepoor andSosiani
River unsanitary water are
catchment
wheat,practices.
maize and animal farming in the upper zone, which stretches between the plateau and flax areas;
the midstream In thezone
past,consists
the Government
of human ofsettlements,
Kenya has initiated rehabilitation
industries activities,
and hospitals; andsuch as solid wastezone
the downstream
management, tree-planting activities, regular inspections, law enforcement and environmental
is an urban environment, which includes the Central Business District (CBD), road networks, garages
awareness initiatives in the catchment areas of the River. The main outcome of these efforts was the
and car washes as well as other industries. Many industries in the area have mushroomed over the
development of the Nandi Park Rehabilitation Project. However over time, these activities failed to
years (Figure
revive the 2),almost
and the main
dead industries
river, which stillmostly
faces deal
majorwith
waterthepollution
productionissuesof[34].
consumer goods,
Moreover, such as
experts
plastic,warn
furniture and textiles, food processing, oil refining and cement production. The
of a possible complete drying up of the river if the current trends in the area persist [90,93,94]. primary goods
foundHence,
in this in area include the
addressing machinery
relevant and
issuestransportation
in the area, theseequipment, textiles,
studies have petroleum
suggested products,
enhancing public iron
and steel [90].
participation in order to achieve long-term results.
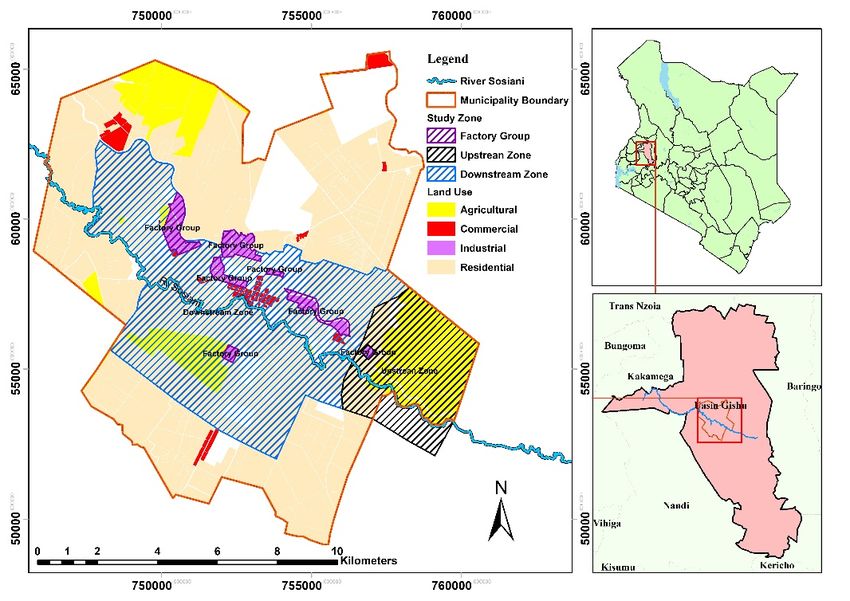
Figure 2. Study
Figure area
2. Study areaand
andthe
theselected regionsininthe
selected regions thearea.
area.
Over time, theUsed
3.2. Methods catchment
for DataofCollection
the River Sosiani has experienced massive water pollution because of
rapid population growth, industrial development, inefficient agricultural practices, as well as poor
This study used a mixed research approach with questionnaires and informal interviews. A pilot
land-use planning
survey and
involving 50 solid waste was
respondents management
conducted systems in the
to determine the area [91]. The
effectiveness industrial
of the effluents
questionnaire
discharged in the River Sosiani from industries in the nearby areas account for a large percentage of
water pollution, which has led to a decline in water quality and quantity [92]. To meet daily water
demands, residents rely on piped water, borehole water, river water and water sourced from the lakes
and ponds. Apart from water shortages in the area, the population also faces large outbreaks of diseases,
such as cholera and typhoid, which are often associated with poor and unsanitary water practices.
In the past, the Government of Kenya has initiated rehabilitation activities, such as solid
waste management, tree-planting activities, regular inspections, law enforcement and environmentalWater 2020, 12, 2248 9 of 25
awareness initiatives in the catchment areas of the River. The main outcome of these efforts was the
development of the Nandi Park Rehabilitation Project. However over time, these activities failed to
revive the almost dead river, which still faces major water pollution issues [34]. Moreover, experts
warn of a possible complete drying up of the river if the current trends in the area persist [90,93,94].
Hence, in addressing the relevant issues in the area, these studies have suggested enhancing public
participation in order to achieve long-term results.
3.2. Methods Used for Data Collection
This study used a mixed research approach with questionnaires and informal interviews. A pilot
survey involving 50 respondents was conducted to determine the effectiveness of the questionnaire in
meeting the objectives of the research, determine whether the selected variables and factors selected to
represent risk and risk perception were comprehensive, and ascertain whether the target respondents
could understand and interpret the questions easily. The pilot survey results indicated that there was
a need to administer the questionnaire in the local language (Kalenjin (The Kalenjin language is a
southern Nilotic language spoken in Kenya, mostly by the Kalenjin tribe)) or the national language
(Kiswahili) in cases where there was difficulty in reading and writing in English. After the pilot survey
was completed, the actual survey was conducted, and a total of 350 questionnaires were administered
randomly to the communities residing along the River Sosiani and to the workers in factories along
the river. In total, 246 questionnaires (70.2%) were returned fully completed and were used in the
data analysis. The participants included in the study were divided into three groups. The first group
comprised respondents located midstream and downstream around the town area where the factories
were located, who throughout the study are referred to as downstream inhabitants/respondents.
The second group consisted of respondents upstream, whose main activities involved agriculture
and farming, and they are referred to as upstream inhabitants. Finally, the factory group comprised
respondents working in the factories throughout the region. The selection of factories was made
based on their proximity to the River Sosiani, and only major textile industries in the region were
surveyed. The factories selected were both private and government-owned, as long as they allowed the
study to be conducted within their premises; in total, three factories agreed to participate in the study.
For the inhabitants located upstream and downstream, the questionnaires were randomly distributed,
while the questionnaires administered in the factories were dropped off at the trainers’ offices, to human
resource managers, or at the factory gates, as instructed by the administration. The survey forms were
collected after one week or as advised by the responsible personnel. Accordingly, follow-up was done
to collect any unreturned questionnaires.
3.3. The Questionnaire Design
The questionnaire was developed based on selected variables and factors obtained from previous
studies and investigations on risk perception [6,37,39]. In order to compare different groups, each
respondent received the same set of questions. Where relevant, additional questions were added
which were specific to one group (e.g., the number of years working in the industry). Items related to
collecting general socio-demographic information included gender, age, educational level, occupation
and income. Additionally, information about the number of family members working for the local
industries in the area, the name of the industries, the position held and the number of years working
in the industry was collected. A five-point Likert scale, using a single select method ranging from
‘Not at all’ = 1 to ‘Very high’ = 5 was employed to measure the variables to the questions discussed below.
In terms of risk perception, a total of eight questions were used to determine the degree of risk
according to the respondents. The set of questions was based on the pilot survey that contained
in-depth discussions and interviews to help determine the questions that could be used to measure risk
perception of respondents in the area, unlike previous research in which relevant characteristics and
rating scales have been based on a literature review. Furthermore, some of the selected questions had
been applied in previous research to measure risk perception. These questions included the impacts ofWater 2020, 12, 2248 10 of 25
industrial activity on their careers; their health; worry about their future life as a result of increased
industrial activities in the area; potential diseases, such as cholera, typhoid and cancer caused by the
poor water quality in the area; and the potential nuisances caused by the smelly and noisy activities of
the industries, congestion and traffic jams. The respondents were also asked a direct question aimed at
measuring the degree of perceived risk based on the water quality in the area, i.e., perceived level of
risk based on the quality of water, which was measured using a Likert scale ranging from ‘None’ = 1 to
‘Very high’ = 5. The results from all the variables were summed up and calculated as a mean score
representing a degree of risk perception, with higher scores indicating higher perceived risks.
Information on the main source of water for daily use was collected to determine the water usage
in the community. To determine the importance of the river to the residents, a dichotomous question
with a ‘yes’ or ‘no’ response was used. To assess the factors affecting the respondents’ perception
of water quality, four factors were assessed, namely, sensorial (factors based on the basic senses),
contextual (factors based on a particular context), scientific (factors based on evidence) and speculation
(factors based on opinion, intuitive judgement or guessing). All the parameters in each of the factors
were summed up and calculated as a mean score representing each variable. The respondents were
asked to rate the level of importance of these parameters when making judgements about the water
quality of the River Sosiani. The parameters for each of the variables were as follows: (a) sensorial
factors based on the taste, colour and smell of the water, as well as the age of the different types of
pipes (visual aspect of sensory factors); (b) contextual factors based on the presence of refuse in the
water and along the riverbank, the presence of fish in the river and the presence of sewer lines nearby;
(c) scientific factors based on knowledge of water-polluting chemicals in the river through hearing or
reading about scientific findings proving that the water is not clean; and (d) speculation and feelings
based on observed changes in water quality, an intuitive sense that the water is not clean and hearsay
regarding people becoming ill after using the water.
To measure trust factors, the respondents were asked to rate the degree of trust they had in,
and the perceived ability of, the following: (1) the government and its capacity to control risk through
water pollution management in the area, (2) the industries’ capacity to protect and manage water
pollution in the area and (3) the local people’s capacity to manage and control risks in the area. In terms
of the last factor, the question was set to gauge the level of control the community members felt
towards managing water pollution in the area through collective actions, such as riverbank clean-up,
and sustainable practices concerning water management. Higher scores indicated greater trust in the
selected institution’s ability to manage risk in the area. Three questions were used to assess the effects of
factors related to the nature of the risk. The respondents were asked to rate the following: the possibility
of industries generating water pollution, the possibility of being affected by water pollution and the
impacts of water pollution on human health, i.e., when judging risks. For the psychological and
cognitive factors, two items were used, namely, the perceived benefits from industries and previous
experiences with water pollution in the area.
3.4. Statistical Analysis
In order to understand, compare, characterise and draw conclusions about the three groups,
multiple statistical methods were used to analyse the data. Analysis of Variance (ANOVA) was
applied to identify significant differences in risk perception among the three groups and determine
what group had higher risk perception scores. Mean scores analysis was used to characterise the
inhabitants of the three groups and provide possible explanations for the results obtained. For further
characterisation, Pearson correlation analysis was conducted to identify the relationship and direction
of the dependent variables (risk perception) and the independent variables i.e water quality perception
factors, trust factors, psychological and cognitive factors, nature of environmental risk and socio-
demographic factors (see Figure 1). Thereafter, partial correlation analysis was conducted to identify
the relationship between risk perception (dependent variable) and all the other independent variables,
without the influence of sensorial factors. This is because sensorial factors were the only significantWater 2020, 12, 2248 11 of 25
risk predictor common among all the three groups and understanding the contribution of the other
independent variables would help in further characterising the groups. These analyses helped provide
an understanding of the groups and why certain predictor variables were selected by each group.
Multiple regression analysis was then conducted to identify the factors determining risk perception
(dependent variable) among the selected predictive factors (independent variables), such as water
quality perception factors, trust factors, psychological and cognitive factors, nature of environmental
risk and socio- demographic factors (gender, age, income and education levels). The regression analysis
helped to make conclusions about the characteristics of the groups, and possible explanations for
why certain predictor variables were dominant for each group were highlighted and described in
detail. Finally, based on these results and in-depth discussions, recommendations for including public
participation in risk communication were provided.
4. Results and Discussion
4.1. Descriptive Statistics of the Respondents
The overall ratio of male to female respondents was 124 (50.4%) males to 122 (49.6%) females.
Gender did not vary significantly amongst the three groups as shown in Table 1; however, there was a
slightly bigger difference in the ratio for males vs. females for upstream inhabitants compared to the
other groups. There was a notable difference in educational levels amongst the groups: there were
three and one respondents from the downstream and upstream respondents respectively without
education, whilst in the factory group had no count for the no education level category meaning that,
all of the respondents had some level of education. The factory group also had the highest number
(N = 45) of respondents who had tertiary education compared to downstream respondents (N = 30)
and upstream respondents (N = 25), as presented in Table 1.
Table 1. Summary statistics of demographic characteristics.
Factory Group Upstream Inhabitants Downstream Inhabitants
Count % Count % Count %
Female 46 51.7 30 42.3 46 53.5
Male 43 48.3 41 57.7 40 46.5
Education:
No education 0 0 1 1.4 3 3.5
Primary school 7 7.9 8 11.3 18 20.9
Secondary school 37 41.6 37 52.1 35 40.7
Tertiary Level 45 50.6 25 35.2 30 34.9
Age
(20–29) 43 48.3 31 43.7 26 30.2
(30–39) 35 39.3 33 46.5 41 52.3
(40–49) 7 7.9 5 7.0 12 9.3
(50–59) 2 2.2 0 0 3 3.5
(60+) 2 2.2 2 2.8 4 4.7
Income in Ksh 1
(No income) 2 2.2 17 23.9 25 29.1
1–20,000 59 66.3 42 59.2 35 40.7
20,001–40,000 17 19.1 8 11.3 16 18.6
40,001–60,000 6 6.7 2 2.8 5 5.8
60,001–80,000 2 2.2 1 1.4 0 0
80K+ 3 3.4 1 1.4 5 5.8
Observations 89 71 86
1 Ksh—Kenyan shilling, the currency used in Kenya.
The largest variation in the sample was found in average household income. In general, the highest
incomes ranged between 0–20,000 Ksh (Kenyan shilling: the currency used in Kenya—1USD= 100.3 Ksh)
amongst 73.2% of the population surveyed. In the no-income category, downstream (N = 25) and
upstream (N = 17) had the highest numbers, whilst there were only two respondents in the factoryWater 2020, 12, 2248 12 of 25
group. These two respondents were registered as attachés in their occupation, which explained their
lack of earnings. The findings suggested that a significant population of the respondents did not have
any income and still lived below the poverty line (US $1.90 per day in 2011 purchasing power parity
PPP). Whilst the monetary and non-monetary poverty indicators of Kenya show that Kenya performs
better than most Sub-Saharan countries, given the overall income levels and poverty rate, human
development indicators are still relatively high, indicating that Kenya performs better on non-monetary
dimensions of poverty. To cope with this challenge, the population resorts to acquiring casual jobs,
such as laundry cleaning and manual labour, which are not steady. When these jobs fail to provide any
consistent income, they rely on growing crops to feed their families and to purchase food and other
daily necessities, as evidenced by the results.
Table 2 presents the distribution of families with members working in local industries in the area.
As can be seen, upstream inhabitants had the highest number of families (N = 55) with no members
working in the local industries. The count for downstream inhabitants was N = 35 families, whilst the
factory group had at least one family member working for local industry, as expected. This count
included respondents working for local industries as well as any other family member of the household.
Another notable difference amongst the groups was the varied response in the factory population on
the numbers of year lived in the community. Most of them indicated that they lived temporarily in the
region or had just relocated based on job opportunity, with no intention of staying in the region for
long periods of time. For downstream and upstream respondents, most of the respondents had lived
in the area their whole life.
Table 2. Number of people working in local industries per family in different groups.
Number of Family Members Working for Local Industries
Count 0 1 2 3 4 5 6 Total (N)
Group
Factory 0 71 11 5 1 1 0 89
Downstream 35 23 16 9 2 0 1 86
Upstream 55 7 5 3 1 0 0 71
Total 90 101 32 17 4 1 1 246
4.2. Characteristics of the Different Groups of Respondents: Mean Scores Analysis
To further determine the characteristics of each group, mean scores and standard deviation
analysis of the independent variables was conducted (see Table 3). From the mean scores, the following
conclusions about the three groups can be derived. First, the respondents in the factory group had
experiences of water pollution in the area based on the mean scores for experiences with water
pollution (M = 3.966, SD = 0.804). However, despite these experiences, they rarely felt that their health
was threatened based on the low mean scores for the variable impact of water pollution on human
health (M = 3.112, SD = 1.172). This could be attributed to a number of factors, such as their limited
experiences of water pollution given that most of them could be living outside the region and only
working seasonally in the area. For example, expert skilled workers are hired occasionally and would
only live in the area temporarily. Such situations would lower their experience of water pollution in
the area. Furthermore, the possibility of a stable income and the ability to afford basic utilities, such as
clean water, cannot be ignored. This is because members of this group mostly generate stable incomes
and can afford better health and water services. Second, the factory group respondents felt a sense of
responsibility in managing risks in the area based on the trust mean scores: despite the high placement
of trust in the government’s capacity (M = 4.247, SD = 1.376), compared to that of industry (M = 4.169,
SD = 1.236), this group felt that industries should also manage risks in the area and possess some
capacity to manage the risks.Water 2020, 12, 2248 13 of 25
Table 3. Mean scores and standard deviations of risk perception and influencing factors.
Factory Group Downstream Inhabitants Upstream Inhabitants Overall
N = 89 N = 86 N = 71 N = 246
Variables Mean SD Mean SD Mean SD Mean SD
Risk perception 4.354 0.365 4.606 0.371 4.039 0.389 4.351 0.436
Gender 1 1.48 0.503 1.47 0.502 1.577 0.497 1.500 0.501
Age 31.22 8.602 34.21 10.011 32.056 9.339 32.510 9.378
Income 22000 23400 21700 35900 13100 16400 19300 27200
Education 2 3.427 0.638 3.070 0.837 3.211 0.695 3.240 0.742
Sensorial factors 4.581 0.508 4.314 0.840 4.394 0.677 4.434 0.694
Contextual factors 3.966 0.641 3.616 1.070 3.662 1.133 3.756 0.968
Scientific factors 3.772 0.961 3.597 1.261 3.923 0.607 3.754 1.003
Speculative factors 4.266 0.493 3.837 0.987 4.042 0.662 4.052 0.764
Trust in the government 4.247 1.376 4.163 0.824 3.817 1.324 4.090 1.203
Trust in the industries 4.169 1.236 4.326 0.789 3.887 1.076 4.140 1.061
Trust in the local people 3.573 1.658 3.558 1.369 3.451 1.556 3.530 1.527
Possibility of industries generating water pollution 3.966 1.283 4.279 0.929 3.056 1.698 3.810 1.402
Possibility of being impacted by water pollution 3.112 1.172 4.395 0.858 2.958 1.292 3.520 1.283
Impact of water pollution on human health 3.483 1.407 4.407 0.742 3.789 1.158 3.890 1.201
Experiences with water pollution 3.966 0.804 3.884 1.522 4.085 1.432 3.972 1.276
Perceived benefits from industries 3.910 1.379 3.756 1.564 3.634 1.376 3.780 1.444
1 Gender is a dummy variable that takes the value of 1 when the subject is male and 2 when female. 2 Education is a dummy variable that takes the value of 1 for no education, 2 for
primary school, 3 for secondary school and 4 for tertiary level.Water 2020, 12, 2248 14 of 25
The findings suggest that the adverse impacts of water pollution in the area are felt by the
respondents downstream. This is based on the highest mean levels for the following variables:
the possibility of industries generating water pollution (M = 4.279, SD = 0.929), the possibility of
being impacted by water pollution among the three groups (M = 4.395, SD = 0.858) and the impacts
of water pollution on human health (M = 4.407, SD = 0.742). Although the mean levels for the
variables of experiences with water pollution and the impacts of water pollution on human health
had slightly lower mean scores compared to the two other groups (M = 3.884, SD = 1.522), the high
standard deviation suggests that the result was not a generalised feeling. Based on the trust scores
for industries (M = 4.326, SD = 0.789), these findings also imply that the respondents in this group
placed the responsibility for managing the water problems on industry, with whom they assumed the
responsibility lay. Given that industries had been identified as major polluters in their area, the people
may well have expected them to manage the situation.
From the analysis of the upstream inhabitants, we can see that the effects of water pollution in the
area cut across all sections of the river, not only the industrial zones. The variable experiences of water
pollution had the highest score among the groups (M = 4.085, SD = 1.432), thus supporting the main
observations stated above. This is because the respondents in this group are located mostly upstream,
where a combination of other factors not necessarily industry-related could be responsible for water
pollution, for example agricultural sources and domestic sources of water pollution. This finding is a
potential indication that urgent action is needed to remedy the water pollution problem in the river.
Furthermore, this finding suggests an opportunity to find a common ground of understanding among
the three groups and provides a starting point for collaboration, while understanding the background
of the main stakeholders, which is critical in promoting public participation. Notably, scientific factors
ranked the highest among the respondents in this group (M = 3.923, SD = 0.607), thus asserting the
importance of having better scientific knowledge and understanding of these factors. The overall
analysis demonstrated that sensorial factors had the highest mean scores (M = 4.434, SD = 0.694) in all
the groups, thus emphasising the importance of these factors in the formation of public perception of
water quality. These findings agree with those reported by Sharma et al. [5], who also found that, in the
independent variables in their analysis, these factors emerged as the most important factors in the
formation of public perception of water quality in the areas surveyed. Moreover, de França Doria [44]
found that sensorial information has an important role in quality perception and risk perception when
assessing water quality. In the current study, the overall results for speculative factors, trust in the
government and trust in industry were high, as indicated in Table 3.
4.3. Risk Perceptions amongst the Groups
As presented in Tables 4 and 5 the three groups exhibited high risk perceptions. The results of
the Pearson’s correlation analysis (Table 5) also revealed that most of the perception variables were
positively correlated with one another. The Bartlett’s test of sphericity and the Kaiser–Meyer–Olkin
(KMO) measure of sampling adequacy analysis revealed high correlations amongst the variables
(KMO = 0.635, Bartlett’s test of sphericity = 310.819, df = 28 and p = 0.000). The sampling is deemed
sufficient or adequate if the KMO value is larger than 0.5 [95] or if the value is 0.6 and above [96].
Therefore, these variables could be used to analyse risk and indicate a degree of risk perception.
Table 4. Results of Tukey’s post-hoc analysis showing differences in risk perception amongst the groups.
Mean Difference (Comparison within the Groups)
Group N Mean SD Factory Downstream Inhabitants Upstream Inhabitants
Factory group 89 4.3539 0.36504 - 0.25217 * −0.31520 *
Downstream inhabitants 86 4.6061 0.37107 −0.25217* - −0.56737 *
Upstream inhabitants 71 4.0387 0.38936 0.31520* 0.56737 * -
Notes: Tukey HSD (Honestly significant difference) F = 44.688, p = 0.000. * The mean difference is significant at the
0.05 level.You can also read