Waioeka - Otara Rivers Scheme Asset Management Plan
←
→
Page content transcription
If your browser does not render page correctly, please read the page content below
ENVIRONMENT B. O. P                                            Environment B·O·P
                                                           Operations Report 98/02
                                                                  September 1998
Bay of Plenty Regional Council

                        Waioeka - Otara Rivers Scheme
                                 Asset Management Plan

             Report prepared by Peter Blackwood, Technical Services Manager

                                                                Environment B·O·P
                                                                       Quay Street
                                                                      P O Box 364
                                                                       Whakatane
                                                                  NEW ZEALAND
                                                                  ISSN 1173 - 6232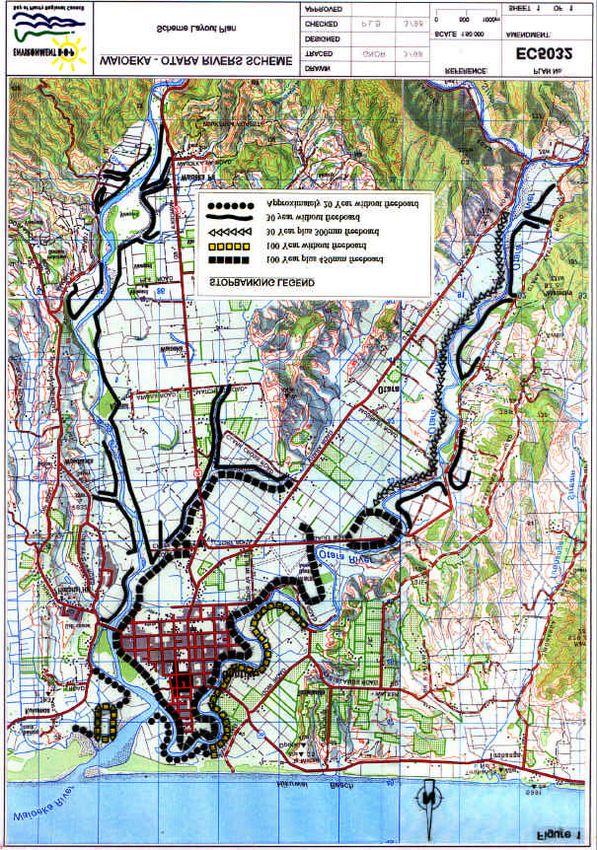
Environment B·O·P

                                             Foreword

                          This plan is a statement by Environment B·O·P, the
                          Manager of the Waioeka–Otara Rivers Scheme, as
                          to how it will manage the assets of that scheme. It is
                          required by the Local Government Amendment Act
                          (No. 3) 1996, and has been adopted following
                          liaison and consultation in particular with the
                          scheme ratepayers.

Operations Report 98/02                                   q:\mas\ors\docs\Waioeka–Otara Asset Mgmt Plan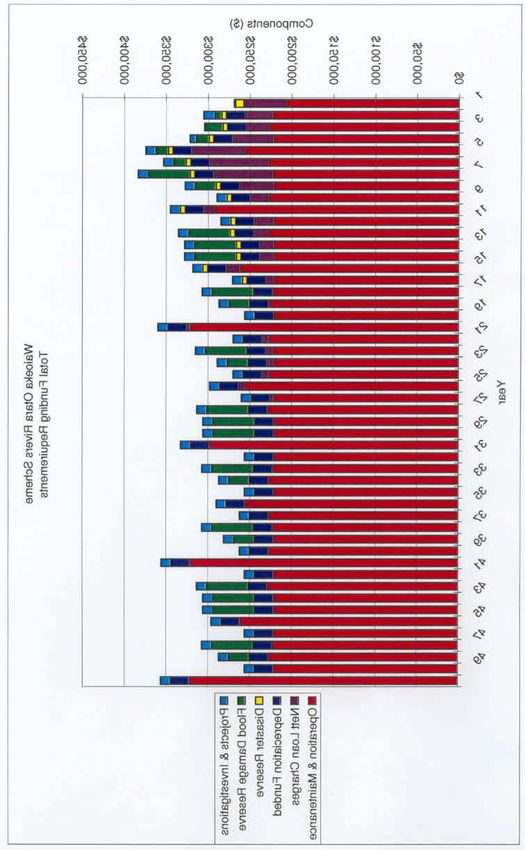
Environment B·O·P                                                                                i

                               Executive Summary

The purpose of this plan is to provide a document for the management of the Waioeka–Otara
Rivers Scheme and in particular its infrastructural assets.

It establishes and communicates the level of funding required to maintain and meet the
scheme objectives and levels of service.

The plan covers the assets of the scheme including stopbanks, a pump station, rockwork and
other erosion protection measures, and plantings. The current valuation at September 1996 (in
terms of Local Government Act requirements) of these assets is $11.4 million.

Maintenance programmes are already in place and these have ensured that the assets are in
good condition and are providing the desired levels of service.

Environment B·O·P through its day to day management of the scheme receives continuous
feedback about the scheme. Informal feedback to date indicates strongly that the ratepayers
support the scheme objectives as espoused at the time of construction.

Service levels have therefore been defined to ensure the original scheme objectives are met
and maintained.

The stopbanks will be maintained to a level to ensure the design flood can be conveyed.
Settlement of up to 50% of the freeboard will be allowed before stopbank reconstruction will
be undertaken. Where the design standards do not include freeboard, settlement of up to
150 mm will be allowed.

All structures will be maintained in a workable condition at all times to function to their
design standards.

Rockwork will be maintained at all times to a minimum of 75% of the original design
placement rate.

River edge protection will be maintained to full potential at all times while not allowing any
willow growth to be older than 15 years.

Environment B·O·P has a number of tools, which are utilised for the management of its assets.
Information systems have been purchased and developed to assist the asset managers in
general management, maintenance, operations and long term planning. The principle
components are the asset register, Decfin Asset Management Module and the Decfin
Financial Management System.

Environment B·O·P has developed a maintenance programme strategy, which will provide for
the most efficient and economic operation, to the desired service levels. A detailed assessment
has been undertaken of the work requirement, to provide for the long term, sustainable
management of the scheme assets.

The scheme has been separated into a number of distinct reaches or locations and the key
maintenance issues have been identified for each of these areas.

Operations Report 98/02                              q:\mas\ors\docs\Waioeka–Otara Asset Mgmt Plan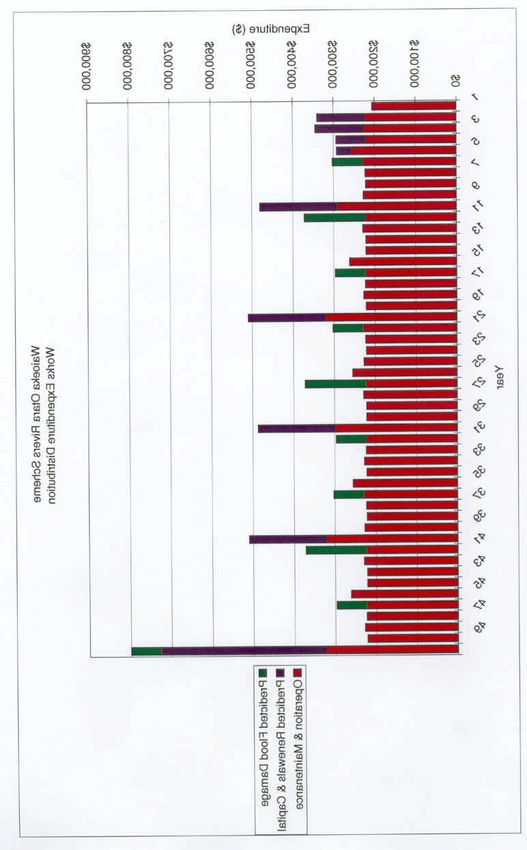
ii                                                                             Environment B·O·P

No acquisition and/or disposal strategies have been developed, as those activities are not
normally a function of this scheme.

The average annual level of expenditure required to meet the scheme objectives and the
desired levels of service, over the 50 year time horizon of the plan, is comparable to existing
expenditure. However, some increase is brought about by the requirements of asset
management and monitoring, establishment of a flood damage reserve and by the requirement
to fund decline in service potential (depreciation).

It is estimated that an average of $244,000 per year will generally be required to meet the
regular and ongoing maintenance necessary to keep the assets operating at the required level
of service. This does not include the requirements to contribute to the flood damage and
disaster reserves. Nor does it include the costs that may be from time to time required to fund
significant flood or disaster damage repairs beyond the levels predicted in the plan.

In addition to this there will be renewal expenditure required to upgrade or renew the asset to
its full (or original) and agreed service potential.

The scheme is funded almost entirely by scheme rates.

Regular internal and external independent audits will be carried out to establish a continuous
improvement cycle, maintain best practices and to assess the quality of asset management.

NB:     Dollars are expressed in September 1996 values unless otherwise noted.

q:\mas\ors\docs\Waioeka–Otara Asset Mgmt Plan                             Operations Report 98/02
Environment B·O·P

                                                         Contents

Executive Summary.........................................................................................................i

Chapter 1: Introduction .................................................................................................1
1.1       Asset to Be Managed ..................................................................................................1

1.2       Rationale for Ownership..............................................................................................1

Chapter 2: General Information ...............................................................................3
2.1       Purpose and Ownership of the Plan.........................................................................3

2.2       Legislative Requirements and Asset Owner's Policies..........................................3

2.3       Duration of the Plan .....................................................................................................4

2.4       Principle Scheme Features.........................................................................................5

2.4.1 Background...................................................................................................................5

2.4.2 Overview........................................................................................................................5

Chapter 3: Assets ..........................................................................................................11
3.1       Objectives of the Scheme .........................................................................................11

3.2       Description of the Assets ..........................................................................................11

3.3       Physical Parameters..................................................................................................14

3.4       Asset Capacity............................................................................................................19

3.4.1 Stopbanks ...................................................................................................................19

3.4.2 Structures ....................................................................................................................19

3.4.3 Concrete Walls ...........................................................................................................19

3.4.4 Edge Protection..........................................................................................................19

3.4.5 Buffer Zone..................................................................................................................19

3.5       Asset Condition...........................................................................................................20

3.5.1 Stopbanks ...................................................................................................................20

Operations Report 98/02                                                    q:\mas\ors\docs\Waioeka–Otara Asset Mgmt Plan
Environment B·O·P 3.5.2 Structures.................................................................................................................... 20 3.5.3 Concrete Walls .......................................................................................................... 20 3.5.4 Edge Protection ......................................................................................................... 21 3.5.5 Buffer Zone................................................................................................................. 21 3.6 Asset Value ................................................................................................................ 22 3.6.1 Stopbanks................................................................................................................... 22 3.6.2 Structures.................................................................................................................... 24 3.6.3 Concrete Walls .......................................................................................................... 24 3.6.4 Edge Protection ......................................................................................................... 25 3.6.5 Buffer Zone................................................................................................................. 25 3.6.6 Summary of Valuations ............................................................................................ 25 3.7 Asset Management Systems................................................................................... 26 3.7.1 Asset Register............................................................................................................ 26 3.7.2 Accounting.................................................................................................................. 26 Chapter 4: Maintenance Plan .................................................................................. 29 4.1 Introduction................................................................................................................. 29 4.2 Service Levels ............................................................................................................ 29 4.3 Maintenance History................................................................................................. 31 4.3.1 Past Maintenance Practices.................................................................................... 31 4.3.2 Berm and River Aggradation................................................................................... 32 4.3.3 Gravel Extraction ....................................................................................................... 33 4.4 Maintenance Programme......................................................................................... 33 4.5 Maintenance Costs.................................................................................................... 35 4.5.1 Existing ....................................................................................................................... 35 4.5.2 Asset Maintenance Expenditure Requirements................................................... 35 4.6 Expenditure ................................................................................................................ 37 4.6.1 Repairs and Maintenance and Decline in Service Potential .............................. 37 q:\mas\ors\docs\Waioeka–Otara Asset Mgmt Plan Operations Report 98/02
Environment B·O·P

4.6.2 Projects........................................................................................................................38

4.6.3 Loan Repayment........................................................................................................38

4.7       Funding ........................................................................................................................38

4.7.1 Reserves .....................................................................................................................43

4.7.2 Sources of Funding....................................................................................................44

4.7.3 Analysis of Funding Requirements .........................................................................45

Chapter 5: Creation/Acquisition/Disposal .......................................................49

Chapter 6: Quality Assurance Systems ............................................................51

Chapter 7: Monitoring ..................................................................................................53
7.1       Effectiveness Monitoring ...........................................................................................53

7.2       Cost Monitoring...........................................................................................................55

7.2.1 Internal .........................................................................................................................55

7.2.2 Financial Audits (External)........................................................................................55

References .........................................................................................................................57

Appendices........................................................................................................................59
Appendix 1 – Responsibilities and Roles in Asset Management ...................................61

Appendix 2 – Asset Maintenance Requirements ..............................................................63

  1          General......................................................................................................................63

  1.1        Management.............................................................................................................63

  1.2        Asset Valuation ........................................................................................................63

  1.3        External Costs ..........................................................................................................63

  2          Projects and Investigations ....................................................................................63

  2.1        Engineering Design.................................................................................................63

  2.2        Floodplain Management Plan................................................................................63

  3          Reach 1 .....................................................................................................................64

Operations Report 98/02                                                       q:\mas\ors\docs\Waioeka–Otara Asset Mgmt Plan
Environment B·O·P

 3.1       Fairway/Channel ..................................................................................................... 64

 3.2       River Banks.............................................................................................................. 65

 3.3       Buffer Zone............................................................................................................... 66

 3.4       Stopbanks ................................................................................................................ 67

 3.5       Duke Street Pump Station ..................................................................................... 69

 4         Reach 2 .................................................................................................................... 70

 4.1       Fairway/Channel ..................................................................................................... 70

 4.2       River Banks.............................................................................................................. 71

 4.3       Buffer Zone............................................................................................................... 72

 4.4       Stopbanks ................................................................................................................ 72

 5         Reach 3 .................................................................................................................... 72

 5.1       Fairway/Channel ..................................................................................................... 72

 5.2       River Banks.............................................................................................................. 73

 5.3       Buffer Zone............................................................................................................... 74

 5.4       Stopbanks ................................................................................................................ 74

 5.5       Concrete Wall .......................................................................................................... 74

 6         Reach 4 .................................................................................................................... 74

 6.1       Fairway/Channel ..................................................................................................... 75

 6.2       River Banks.............................................................................................................. 75

 6.3       Buffer Zone............................................................................................................... 76

 6.4       Stopbanks ................................................................................................................ 76

 7         Flood Damage Repairs .......................................................................................... 77

 8         Drain Maintenance.................................................................................................. 77

Appendix 3 — Expenditure Tables ..................................................................................... 79

Appendix 4 — Disaster Reserve ......................................................................................... 85

Appendix 5 — Flood Damage Reserve ............................................................................. 87

Appendix 6 — Renewals Fund ............................................................................................ 89

Appendix 7 — Loan Payment Schedule As At 30 June 1997........................................ 91

q:\mas\ors\docs\Waioeka–Otara Asset Mgmt Plan                                                              Operations Report 98/02
Environment B·O·P

Appendix 8 – Drain Locations ..............................................................................................93

Glossary ...........................................................................................................................95

Operations Report 98/02                                                    q:\mas\ors\docs\Waioeka–Otara Asset Mgmt Plan
1

                           Chapter 1: Introduction

1.1       Asset to Be Managed
          The plan is to provide a single document intended to assist those delegated the
          responsibility for managing the Waioeka–Otara Rivers Scheme assets on behalf of
          the Bay of Plenty Regional Council (Environment B·O·P).

          The Waioeka–Otara Rivers Scheme is a comprehensive river control scheme,
          providing benefits of flood protection, channel edge stability and some drainage to
          the township of Opotiki and farmland on the flood plain.

          The scheme has substantial physical assets, including stopbanks, a pump station,
          rock work and other erosion protection measures, and plantings. The current
          valuation September 1996 (in terms of Local Government requirements) of these
          assets is $11.4 million.

1.2       Rationale for Ownership
          The rationale for the existing ownership is as a result of the Local Government Act
          provisions whereby Regional Authorities are responsible for the provision and
          control of the asset.

          In common with all other similar river schemes throughout New Zealand the
          Waioeka–Otara Rivers Scheme was established under the auspices of the Soil
          Conservation Rivers Control Act 1941. This legislation had its genesis earlier this
          century and was, for its time, far reaching; Government recognised that flooding and
          drainage problems were best dealt with on a large scale (catchment) basis. Major
          catchments frequently traversed more than one existing territorial authority (at that
          time county and borough councils). The magnitude of the problem was such that the
          authorities of the day determined special purpose (ad hoc) authorities, with specialist
          engineering and soil conservation skills, were required to administer these functions
          and hence the creation of catchment boards and catchment commissions.

          In 1960 the Poverty Bay Catchment Board was invited by residents to assume
          Catchment Board functions for the district and particularly to design a stopbank
          scheme for Opotiki township. Stopbanks protecting the town to a nominal “250 year”
          standard were completed in 1966 and followed by rural “30 year” stopbanks in 1970.
          The two schemes were joined together about 1980.

Operations Report 98/02                               q:\mas\ors\docs\Waioeka–Otara Asset Mgmt Plan
2 Environment B·O·P
Under the Local Government reforms of 1989, Environment B·O·P took over the
assets and management of the scheme from the East Cape Catchment Board (who
had previously succeeded the Poverty Bay Catchment Board). River schemes were
set up under a tripartite arrangement involving the Government, the Catchment
Authority as the designated manager of the schemes, and local ratepayers. Briefly,
the principle was that the Government provided the majority of the funds for capital
works (in this case generally 75% of capital works was funded by the Government),
with the local ratepayers providing the balance. In return Government required
ratepayers of the scheme to commit to funding its maintenance in perpetuity.
Additionally, until 1987 Government provided assistance with maintenance to the
extent of about 25%. Nowadays however, maintenance of the scheme are borne
solely by the scheme ratepayers, identified under a separate rating district known as
the Waioeka–Otara Rivers Scheme.
In 1990–94 Environment B·O·P carried out a programme of upgrading works to the
stopbanks.
Environment B·O·P, by virtue of its previous and ongoing experience, has extensive
knowledge of the asset, and the ability to ascertain customer requirements.
q:\mas\ors\docs\Waioeka–Otara Asset Mgmt Plan Operations Report 98/023
Chapter 2: General Information
2.1 Purpose and Ownership of the Plan
The purpose of this plan is to provide, within one document, the means and
mechanisms to enable the manager of the asset, to plan for the most efficient and
economic ways to provide for sustainable ongoing management of the Waioeka–
Otara Rivers Scheme.
These assets need to be managed, to ensure they continue to effectively deliver
scheme benefits on a long term, sustainable basis. Management requires provision
for monitoring, maintenance and in some instances eventual replacement of these
assets.
This plan defines the objectives and performance standards for the scheme and the
level of maintenance needed to ensure these are met at all times.
The plan also provides a base against which Environment B·O·P’s performance in
maintaining these infrastructural assets can be measured.
This asset management plan will provide a framework for technical, economic and
financial inputs relating to the assets and their impact on long term financial
planning.
The ownership of the plan, after consultation with the ratepayers, rests with the
policy makers namely Environment B·O·P which is the body responsible for
managing the asset (the Asset Manager). It is essential that there is continuing client
(principally scheme ratepayer) input throughout the duration of the plan.
The plan relies on inputs from statistical data provided by the Asset Management
System, from Council policy, and from those who implement the works and
contracts to maintain and provide the service.
2.2 Legislative Requirements and Asset Owner's Policies
The principle regulatory requirements affecting the management of infrastructure
assets result from:
• Local Government Act 1974
• Local Government Amendment No. 3 Act 1996
Operations Report 98/02 q:\mas\ors\docs\Waioeka–Otara Asset Mgmt Plan4 Environment B·O·P
• Resource Management Act 1991
• New Zealand Society of Accountants “New Zealand Accounting Standards”;
generally accepted accounting practices (GAAP) as defined in particular by
SSAP 3 and SSAP 28.
• Soil Conservation and Rivers Control Act 1941
The Local Government Act empowers the elected representatives of the Council to
form policies for the provision of the service, and to recover the costs through user
charges and rates.
It also requires that each local authority:
• prepare an annual plan indicating performance measures in consultation with
their community
• prepare an annual report outlining council performance against annual plan
objectives
• adopt financial systems and policies in accordance with generally accepted
accounting practice.
The Local Government Amendment No. 3 Act aims to improve local government
accountability and transparency by outlining the reasons and alternatives associated
with funding decisions so ratepayers can better understand and participate in decision
making.
This asset management plan will provide the basis for determining long term
financial strategies. Information from the asset management plan will be used in
preparing financial and non-financial statements required by generally accepted
accounting practice.
Asset management is also consistent with the objectives of the Resource
Management Act, which requires:
• sustainable management of physical and natural resources;
• consideration of alternatives and assessment of benefits and costs;
• determination of best practicable options.
2.3 Duration of the Plan
This plan has been prepared with a 50 year time horizon. However, long term
predictions of such factors as maintenance requirements, costs and interest rates are
difficult to make now. Consequently, a regular review and updating of the plan will
be required. Thus the duration of this plan is ten years from the date of formal
preparation and acceptance by Council.
q:\mas\ors\docs\Waioeka–Otara Asset Mgmt Plan Operations Report 98/02Environment B·O·P 5
The plan will be reviewed as required and updated to ensure that the requirements of
the customers are met, and that the systems are maintained at their most effective
levels of service.
The information prepared under Section 4.0 of this plan will be incorporated in both
the Strategic Plan of Council as well as the Annual Plan for each financial year.
2.4 Principle Scheme Features
2.4.1 Background
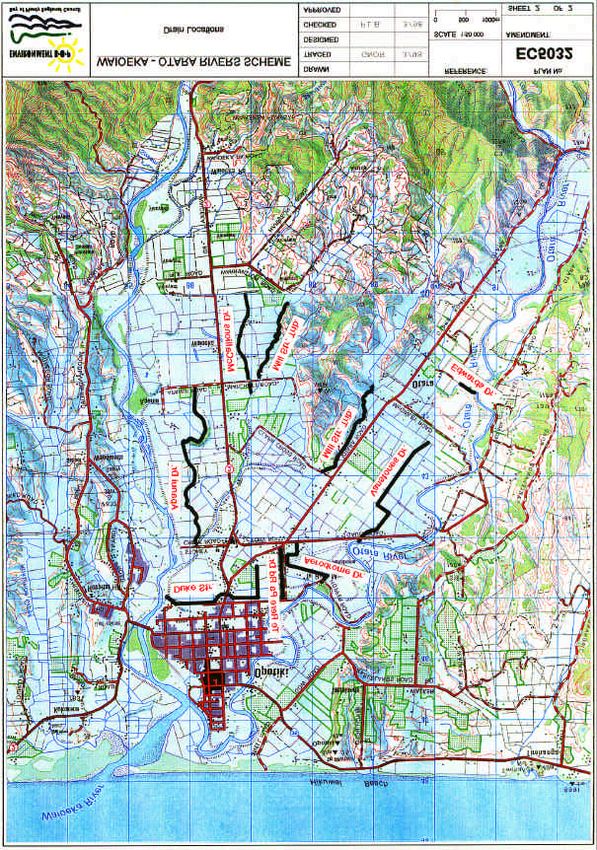
The scheme comprises two main branches, the Waioeka and Otara Rivers (Figure 1).
The Waioeka catchment covers 825 km2 extending 60 km, while the Otara covers
350 km2 and extends 30 km. Both catchments are relatively steep with extensive
bush cover. The lower reaches of both rivers meander across flood plains before
joining at Opotiki and flowing out to sea. Intensive rainstorms occur in both
catchments with associated flooding and gravel movement being difficult to control.
A full analysis of the hydrology of both rivers was carried out by the East Coast
Catchment Board in 1988. This concluded that, from continuous river stages
recorded over the period 1958–85, the one hundred year flow for the Waioeka River
as measured at the Cableway recorder, is 2100 cumecs (cubic metres per second).
Similarly, based on records for the period 1964–86, the one hundred year flow for
the Otara River at the Browns Bridge recorder is 1,000 cumecs. Mean flows for the
Cableway and Browns Bridge sites are 32 and 11 cumecs respectively.
2.4.2 Overview
The Waioeka–Otara Rivers Scheme includes substantial stopbanking of both the
town and rural sections of both rivers, one pump station (Duke Street) and
considerable bank edge protection works including riprap, rubble and plantings. The
scheme also includes flood protection to the land adjoining Mill Stream and minor
drainage works.
The original scheme completed in 1960 was in fact two stopbanking schemes; each
financed by separate rating areas. The “urban scheme” protected 770 ha, including
Opotiki, to a nominal 250 year protection standard. The “rural scheme” protected
1230 ha of farmland in the valleys of the two rivers to a 30 year protection standard.
Because of limited local finance the rural scheme was designed to the lower standard
with emphasis on cleared fairways with berm planting to reduce flood velocities near
the stopbanks.
Although the schemes were effective in relieving flooding, it was at the cost of
continual repairs as no river training works had been allowed for in the original
scheme. In 1974 an economic report on the rural scheme was undertaken to support
an application for Government funding of a ten year river training program. A
second ten year program of river training was proposed in 1984 and a subsidy for the
works secured from the Government. It was clear that until the rivers in the rural area
were trained into suitable channel alignments the integrity of the stopbanks would
always be at risk.
Operations Report 98/02 q:\mas\ors\docs\Waioeka–Otara Asset Mgmt PlanEnvironment B·O·P 7 Figure 1 Operations Report 98/02 q:\mas\ors\docs\Waioeka–Otara Asset Mgmt Plan
Environment B·O·P                                                                                  9

          In 1986 the National Water and Soil Conservation Authority (NWASCA) requested a
          comprehensive scheme study be carried out (in accordance with its unified flood loss
          reduction policy) as a prerequisite for further funding of the Waioeka-Otara schemes.

          The NWASCA requested study was completed in July 1989. The study investigated
          four major options for the scheme. Comparisons of the major options with respect to
          all the relevant factors concluded that the most preferred option from the Board’s
          perspective was the “continue” option, in both the “urban” and “rural” areas.

          The “continue” option was for the continued maintenance of the urban banks at their
          present level, but it did not preclude the possibility of raising the banks at a later date
          to allow for the effects of berm aggradation and sea level rise. Constructing a new
          urban stopbank in the Te Rere Pa area was included as part of this “continue” option.
          In the rural area, maintaining the present banks and continuing with the river training
          works was the most preferred option.

          Following the report, a grant of $660,000 was approved by the Ministry of
          Environment to be matched by a local share of $440,000.

          Following Environment B·O·P’s inheritance of the Waioeka–Otara Rivers Scheme
          during 1989, the design was further reviewed before construction works began
          (Titchmarsh 1990). The review revealed the following problems:

          •     Design flows for the Waioeka–Otara Rivers Scheme were now rated
                approximately 20% to 30% higher than the original 1966 design flows.

          •     There was reason for concern at the rapid rate of aggradation of town berms,
                particularly for the Otara River. Control of berm vegetation needed urgent
                attention otherwise the level of flood protection would continue to diminish
                with time.

          •     Maintenance of the stopbanks and berms had been neglected.

          •     While the condition of the mainly indigenous catchment cover was considered
                good at that time, there was reason to believe that wild animal numbers had
                increased rapidly in the last few years and, unless future control measures were
                implemented, would continue to rise.

          The review also made the following recommendations:

          (i)   That the works to upgrade the stopbanks in the scheme to the following
                standards be implemented:-

                (a)       Otara Rural left bank                30 year + 300 mm freeboard

                (b)       Waioeka Rural right bank             30 year witho ut freeboard

                (c)       Otara Urban left bank                100 year + 450 mm freeboard

                (d)       Otara Urban right bank               100 year without freeboard

                (e)       Waioeka Urban right bank             100 year + 450 mm freeboard

Operations Report 98/02                                 q:\mas\ors\docs\Waioeka–Otara Asset Mgmt Plan
10 Environment B·O·P
(ii) That the works to relocate the stopbanks on the Otara right bank between
cross-sections 15.945 and 13.500 and on the Otara left bank between cross-
sections 15.470 and 14.220 be implemented.
(iii) That the works to relocate and extend the Otara left bank across Gaults Road
be implemented.
(iv) That the Council instigate regular monitoring of the stopbanks to ensure that
design standards are maintained. Special attention should be given to locations
where roads cross the stopbanks and making sure that good grazing
management practices are followed.
(v) Where roads crossed the stopbanks that they be sealed as part of the scheme
works and then be maintained by the Opotiki District Council.
(vi) The Council in conjunction with Opotiki District Council control the growth on
berm areas, either with a mowing and/or spraying programme.
(vii) River training works continue as part of the annual maintenance programme.
The stopbank works recommended were all constructed over the 1990–91 period.
Maintenance of the scheme is funded by way of a classified rate (under the Soil
Conservation and Rivers Control Act 1941) struck over the area of benefit. A
“classification” (Circa 1980) establishes the relative benefits received by the lands
within the scheme. Rates for any property are calculated on the basis of land value
and class of that property.
The separate rating area has an area of approximately 8,500 hectares. As at January
1997 the capital value of that area was approximately $225 million; the land value
$87 million.
q:\mas\ors\docs\Waioeka–Otara Asset Mgmt Plan Operations Report 98/0211
Chapter 3: Assets
3.1 Objectives of the Scheme
The Waioeka–Otara Rivers Scheme consists of a number of component
infrastructural assets to provide the following:
• Security from floods up to the 1% Annual Exceedance Probability (AEP) level
to the township of Opotiki. By definition, the 1% AEP flood has a 1%
probability of occurring in any one year. This is more commonly known as the
1 in 100 year flood).
• Security from floods up to the 3.3% AEP (30 year) level to most rural areas
adjoining the Waioeka and Otara Rivers.
• Security from floods up to around the 5% AEP (20 year) level to a small area
of rural land on the Otara River right bank and Waioeka River left bank.
• The maintenance of the Waioeka and Otara Rivers to a stable alignment in
terms of width and meander pattern.
• Reduced erosion of river banks.
• Minor drainage.
3.2 Description of the Assets
Refer Figure 2.
Stopbanks
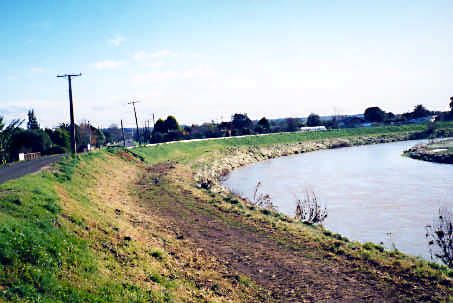
Stopbanks (also known as flood banks) are compacted earth structures, which
provide protection to urban and rural properties from floodwaters. The asset
‘stopbanks’ includes an allowance for the minor culverts and fences that normally
surround or are part of the stopbanks.
Operations Report 98/02 q:\mas\ors\docs\Waioeka–Otara Asset Mgmt Plan12 Environment B·O·P
Structures
Floodgates
Floodgates are structures constructed of reinforced concrete and timber that may be
opened or closed to admit or exclude flood and tidal waters. There are no major
floodgates on this scheme. However, there are a large number (around 100) of small
floodgates at stormwater outlets.
Pump Stations
Mechanical and electrical equipment with associated reinforced concrete structure
that raises water to a position where it is able to flow away under gravity. Currently
there is only one pump station, located at Duke Street.
Concrete Walls
Concrete walls are constructed of reinforced concrete and are an integral part of the
stopbank system. These are generally constructed where there is insufficient width to
construct an earth embankment.
Edge Protection
Rock
Mechanically placed rock riprap provides protection to the riverbanks particularly in
the lower reaches of the river system where willow trees will not grow. Willows do
not grow in these reaches due to the tidal influence and the regular inundation with
saline water. Rock also provides a much higher degree of erosion protection than
willows — but at substantially greater cost.
Rubble
Similar to rock, mechanically placed rubble provides protection to the riverbanks
particularly in the lower reaches. Rubble provides less erosion protection than rock
because it has a lower density, poor shape characteristics (it can be ‘plucked’ off the
riverbank by the river flow) and is generally less durable. It requires more
monitoring than rock and is aesthetically inferior. However it is a cost effective
method for some applications.
Live Protection
Vegetation (generally willows) that is planted and “layered” onto the river bank
and/or willows that are trenched into the river bank to provide a low growth habit
down or near the water level in the river to provide protection against riverbank
erosion. (Refers to Edge Protection and Trenched Willows in Table 5, Physical
Parameters).
q:\mas\ors\docs\Waioeka–Otara Asset Mgmt Plan Operations Report 98/02Environment B·O·P 13 Figure 2 Operations Report 98/02 q:\mas\ors\docs\Waioeka–Otara Asset Mgmt Plan
14                                                                          Environment B·O·P

         Buffer Zone

         Area adjacent to the river which is fenced and planted with both willows and native
         shrubs to provide back up material for edge protection; to filter, collect and sort
         debris during large flood events and give some flexibility in the migration of the
         meander pattern in the river system.

         In most instances the live protection and buffer zone will be fenced off to exclude
         stock. Fencing is an integral part of the live protection and buffer zone assets.

         Drains

         Excavated channels designed to convey water to the Waioeka and Otara rivers,
         tributary streams and the Duke Street pump station. The locations of the scheme
         drains are shown in appendix 8.

3.3      Physical Parameters
         The following tables 1 to 5 provide a summary of the physical parameters of the
         assets. The tables are also stored as spreadsheets in the following computer files
         R:\assets\valuatio\waioeka\edge96, stop96, struc96, rock96, rubble96 and cwall96.

         The methods of valuation are described in section 3.6.

         Note: The river reference points have long-established distances in terms of miles.
         These imperial distances will be metricated in the final version of the asset
         management plan.

q:\mas\ors\docs\Waioeka–Otara Asset Mgmt Plan                          Operations Report 98/02
Environment B·O·P 15 Table 1 Operations Report 98/02 q:\mas\ors\docs\Waioeka–Otara Asset Mgmt Plan
16                                                                                        Environment B·O·P

                                                Table 2

 INFRASTRUCTURE ASSETS : CONCRETE WALL : STOPBANKS 96

Location       River     Length Volume           Value         Age    Depreciation           Net Value
             Distance            m3/m

Reach 3: Otara Town 0 to 6.25 miles
          LB Otara 3 400        0.2             61,844          5           6,184             55,660
   Total Waioeka Otara                          $61,844                     $6,184            $55,660

                                                Table 3

                   INFRASTRUCTURE ASSETS : ROCKWORK

     Location       River             Reference     Distance Volume Tonne                    Value
                   Distance                            m       m3                             96

     Reach 1: Waioeka Town 1 to 2.5 miles
              RB Waioeka 2      Union Street               50        280        448         $16,719
              LB Waioeka 2.25     Harfords                120        670       1072         $40,007
     Total Reach 1                                        170        950       1520         $56,726

     Reach 3: Otara Town 0 to 6.25 miles
              LB Otara 2                                  110         620       992         37,021
              LB Otara 2.5                                400        2240      3584        133,754
              LB Otara 3                                  580        3250      5200        194,063
              LB Otara 3.5                                 70         400       640         23,885
              LB Otara 3.75 to 4                          125         700      1120         41,798
     Total Reach 3                                       1285        7210     11536        $430,522

     Reach 4: Otara Rural 6.25 to 11.8 miles
              LB Otara 11.8                               95         530       848          31,647
     Total Reach 4                                        95         530       848          $31,647

     Total Waioeka Otara                                 1550        8690     13904        $518,896

q:\mas\ors\docs\Waioeka–Otara Asset Mgmt Plan                                        Operations Report 98/02
Environment B·O·P 17
Table 4
INFRASTRUCTURAL ASSETS : RUBBLE
Location River Reference Distance Current Value
Distance m CCI 96
Reach 1: Waioeka Town 1 to 2.5 miles
LB Waioeka 1.25 Conners 120 3700 $6,720
Total Reach 1 120 $6,720
Reach 3: Otara Town 0 to 6.25 miles
LB Otara 0.25-0.5 190 3700 $10,640
LB Otara 1-1.25 Wharf 250 3700 $14,000
LB Otara 1.25 220 3700 $12,320
LB Otara 2 40 3700 $2,240
Total Reach 3 700 $39,200
Total Waioeka Otara 820 $45,920
Operations Report 98/02 q:\mas\ors\docs\Waioeka–Otara Asset Mgmt Plan18 Environment B·O·P Table 5 q:\mas\ors\docs\Waioeka–Otara Asset Mgmt Plan Operations Report 98/02
Environment B·O·P                                                                               19

3.4       Asset Capacity
3.4.1     Stopbanks

          Stopbanks are built to a level and grade where they will not be overtopped by the
          design flood. They are also constructed to appropriate batters and top width to ensure
          their structural integrity.

                          Location                                 Design Level
           Waioeka Urban Right Bank                 100 year plus 450 mm freeboard
           Waioeka Rural Right Bank                 30 year without freeboard
           Waioeka Rural Left Bank                  Around 20 year without freeboard
           Otara Urban Left Bank                    100 year plus 450 mm freeboard
           Otara Urban Right Bank                   100 year without freeboard
           Otara Rural Left Bank                    30 year plus 300 mm freeboard
           Otara Rural Right Bank                   Around 20 year without freeboard

          Design levels of the Waioeka-Otara stopbanks were reviewed in 1990 (Titchmarsh).

3.4.2     Structures

          Pump Stations
          Pump stations are designed to discharge drainage and flood flows to a particular
          design standard. Pump stations operate when the gravity outlet is closed or inhibited.

          The only pump station on this scheme is the Duke Street pump station constructed in
          1984. This is primarily a flood pump and is sized for a 10 year 24 hour storm (160
          mm). It is also used for drainage when required.

3.4.3     Concrete Walls

          Concrete Walls provide the same function as the stopbanks.

                          Location                                 Design Level
           Otara Urban Left Bank                    100 year + 450 mm freeboard

3.4.4     Edge Protection

          Rock work and live protection are erosion control works that are designed to protect
          the stopbanks and/or natural channel banks from erosion and consequential flood
          overflows, to maintain channel stability and to reduce the deposition of sediment in
          the lower reaches of the river system.

3.4.5     Buffer Zone

          The buffer zone has no definitive design standard and the width allowed is a matter
          of considered judgement on a site by site basis. For consistency a minimum width of
          vegetation is maintained in most circumstances. The standard selected for the buffer

Operations Report 98/02                               q:\mas\ors\docs\Waioeka–Otara Asset Mgmt Plan
20 Environment B·O·P
zone ideally would be the width of the minor meander (30 metres). However, in
some cases there is insufficient space to achieve this and an average width of 15
metres has been adopted.
3.5 Asset Condition
3.5.1 Stopbanks
The programme of works between 1990 and 1994 brought the stopbanks up to the
design standards stated in section 3.4.1.
The stopbanks appear to be generally in a sound condition with only minor
maintenance required to ensure their integrity. A recent (1998) long-section survey
has revealed minimal settlement has occurred since the early 1990’s reconstruction.
Some minor topping up is required at a few locations only.
The main locations requiring topping up are on the Otara rural banks at distances 7 ½
miles and 10–10.24 miles on the left bank and 7 ½ – 8 miles on the right bank. These
areas were not part of the 1990–94 reconstruction.
There are a few localised low spots that have been caused by stock and vehicle
damage. The number of these is significantly less than 10 years ago. Stock damage
can arise from variable grass cover and poor grazing management e.g. use of the
stopbank as a race for cattle or heavy grazing during wet weather. It is important that
scheme monitoring continues to prevent future damage.
Problems exist with the alignment from the inherited situation where the stopbanks
are banks too close to the river channel leaving little or no berm area. This threatens
the viability of the scheme with the stopbank in some places being in danger of
undermining by a “5” year flood rather than being overtopped by a “50” year event.
This is a particular problem through part of the Opotiki township reaches of both
rivers. It is also a problem in some rural reaches. In some cases there simply is not
enough room to create a protected berm in front of the stopbanks. In most cases the
maintenance of the edge protection works and buffer zones has improved this
situation.
Asset condition is monitored by visual inspections, physical surveys and scheme
reviews including detailed computer modelling.
3.5.2 Structures
A regular programme of maintenance is carried out on the Duke Street pump station.
In particular, any working parts that wear out or that are showing signs of age are
replaced. Asset condition is monitored by regular inspection (see Appendix 2).
Structural concrete is inspected periodically. Minor movement in the pumphouse
structure is monitored periodically.
3.5.3 Concrete Walls
The concrete walls are in good condition and are inspected on a regular basis (see
appendix 2). Any structural defects are repaired promptly.
q:\mas\ors\docs\Waioeka–Otara Asset Mgmt Plan Operations Report 98/02Environment B·O·P 21
3.5.4 Edge Protection
(a) Live Edge Protection
The condition of the live edge protection in the scheme varies depending on its age
and its previous maintenance, but is generally reasonably good.
Most of the vegetation protection present in the scheme are matsudana hybrids with
some crack willow (Salix fragilis). Whilst the crack willow does have some desirable
characteristics, such as a large root mass and some resistance to animal grazing, it is
rather brittle, and being largely female it tends to seed and spread uncontrolled. Thus
it is not an ideal species to use. In general, S. matusdana x alba hybrids tend to be
more suitable, in particular male hybrids such as Hiwinui or Moutere.
It is anticipated that as other species and clones are planted in the future, much of the
existing crack willow will be displaced. Having a mix of species and clones reduces
the vulnerability of edge protection to a disease or insect infestation — as different
species have different resistance to particular diseases or insect. Leaf rust, sawfly,
silverleaf and Armillaria are examples of common problems that could strike
willows. Although none of these are a problem at the moment within the region, the
Armillaria fungus has been detected in some willows on both the Otara and Waioeka
Rivers. Field staff are monitoring the situation.
Trials of various hybrid species of willows, in particular golden willow hybrids
(matsudana x alba vitelina) are being assessed, and findings from crown research
institutes are being obtained to further help identify suitable species to use as a bank
protection. The use of native species is also increasing.
A regular layering programme is already in place and this will intensify as new areas
of edge protection age and thus require layering.
(b) Rock Protection
Where rockwork exists, a works programme has been implemented to replenish areas
where levels have fallen below 50% of the original design placement rate. It is
intended that this threshold be increased to 75% of the original design placement rate
to maximise stopbank security. In some places the rock riprap is now insufficient to
adequately protect the adjoining stopbank (particular at the Union Street section,
river distance Waioeka 2–2.25 miles and to a lesser degree at the Bridge Street
section, river distance Otara 4 miles). A four year programme of works to rectify this
situation is planned commencing 1998/99. Refer section 4.5.2.
3.5.5 Buffer Zone
Similar to the live edge protection, much of the buffer zone is in good condition.
Regular inspections are carried out followed by maintenance fencing and planting to
ensure the buffer zone is maintained.
Operations Report 98/02 q:\mas\ors\docs\Waioeka–Otara Asset Mgmt Plan22 Environment B·O·P
3.6 Asset Value
SSAP 28 “Accounting for Fixed Assets” outlines the accounting practice for asset
valuation. The guideline is currently under review by the Institute of Chartered
Accountants of New Zealand (formerly the NZ Society of Accountants), particularly
in its application to infrastructure assets.
The valuation of an infrastructural asset can be determined by using either a
depreciated value of the original construction (historical) cost; the replacement cost
of the components of the asset; or the depreciated replacement cost of the asset.
Usually the asset has been added to over a period of time, and has been upgraded and
maintained to a high level of serviceability in order to continue providing the
required level of service to its customers and users.
The assets of the Waioeka–Otara Rivers Scheme have been valued with Council
resolving in June 1993 to adopt the following policies:
• That “depreciated replacement cost” be used for the valuation of all structures.
• That drainage networks be valued at replacement cost.
• That depreciated historical cost be used for the valuation of stopbanks.
A revaluation of the assets has recently been completed (June 1996) and after
discussions with Audit Office Council has decided to use “depreciated replacement
cost” for the valuation of the stopbanks. This “replacement cost” is based on the
“historical cost” (see below).
3.6.1 Stopbanks
All schemes in the Bay of Plenty region have either had upgrading work undertaken
on them, or had new works built, within the last ten years. This gives Environment
B·O·P excellent data to establish the value of the stopbank assets.
It is noted that if the stopbanks were to be rebuilt now, the methods of construction
and available borrow would be markedly different from when the banks were
originally constructed. For example Kaituna Scheme stopbanks were built from
borrow won from the river; this material is no longer available and borrow would
have to be brought in from off site, thus significantly increasing the costs.
However, the basis for valuation is historical cost based on the same method of
construction as originally carried out. This historical cost is used as the replacement
cost for valuation purposes with an adjustment made at each new valuation for
movements in accordance with the Construction Cost Index (CCI). The historical
costs have been increased by 30%, to allow for smaller scale works (say 20%) and
design (10%), thereby reflecting the way in practice the stopbanks will be renewed.
Note that the historical costs included a supervision component.
The stopbanks will be maintained to convey their design floods but settlement of up
to 50% of the freeboard will be allowed before stopbank reconstruction will be
undertaken. Therefore, the stopbanks value will depreciate to some extent. At this
q:\mas\ors\docs\Waioeka–Otara Asset Mgmt Plan Operations Report 98/02Environment B·O·P 23
stage the best estimate is that an average reconstruction will be required every twenty
years. A depreciation rate of 0.2% has been used, i.e. after twenty years the
stopbanks will have lost 4% of their value. Therefore, the valuation of stopbanks is
by “depreciated replacement cost” (DRC).
DRC = construction costs x (current CCI/construction date CCI) x (1–0.002 x age)
Figure 3 illustrates the depreciation — only a portion of the stopbank needs to be
replaced every 20 years; the remainder is retained.
Design bank level Volume replaced to restore service potential
∇
Ground level
∇
Volume lost due to settlement
Volume lost = Volume replaced
Original Stopbank Stopbank settlement and reconstruction
Figure 3 Depreciation of Stopbank
(i) Compensation Costs
These relate to land purchased or compensation paid when structures were placed on
land held in private ownership and/or adjoining land was utilised during
construction. There is very little information available for compensation costs for the
Waioeka–Otara Rivers Scheme. The nature of the “whole” floodbank system is most
similar to the Rangitaiki Scheme with respect to physical size and land use, therefore
the average compensation costs incurred on the Rangitaiki are considered indicative
of what compensation costs have been on the Waioeka–Otara Rivers Scheme.
Therefore the Rangitaiki unit rate has been used for valuing compensation.
(ii) Valuation Summary
The valuation has two components, a direct cost per m3 and ancillary costs per lineal
metre.
Direct costs include: Earthworks Contract
Staff salaries to prepare, supervise and administer
contract.
Vehicle costs
Ancillary costs include: Fencing, grassing.
Culverts
Compensation
Operations Report 98/02 q:\mas\ors\docs\Waioeka–Otara Asset Mgmt Plan24 Environment B·O·P
On a “depreciated replacement cost” basis, the valuations are:
Valuation June 1993 (CCI = 3470)
Direct Costs $6.62/m3 1,030,885 m3 $6,824,460
Ancillary Costs $29.91/m 66.172 km $1,979,205
$8,803,665
September 1996 Value (CCI = 3700) $9,387,192
Depreciation $144,350
Stopbanks September 1996 Valuation $9,242,843
3.6.2 Structures
The current replacement cost of the structure and contents of the Duke Street pump
station is calculated annually for insurance purposes.
The pumphouse and associated floodgates have an estimated useful life of 50 years
and knowledge of the age of each structure enables the “depreciated replacement
cost” (DRC) costs to be calculated.
For the contents of the pump station there is regular and ongoing annual expenditure
necessary to keep the asset operating at the required level of service. There are also
other less frequent maintenance works (Table 6) which periodically returns the asset
to close to the original service potential. Nevertheless an initial decline in value after
construction does occur since at any one time the pump station contents will consist
of components of mixed age.
As at September 1996 valuations for the Duke Street Pump Station are:
Structure Contents
Replacement Cost September 1996 $84,800 $67,500
Depreciation $20,352 $16,200
Depreciated Replacement Cost September 1996 $64,448 $51,300
3.6.3 Concrete Walls
The method of valuation used for the concrete walls is “depreciated replacement
cost”.
In the last four years Environment B·O·P has carried out concrete wall construction
works. Similar site and working conditions exist for all the concrete walls so the
latest work provides an indicative cost for concrete wall construction. This cost has
been used to determine the current replacement cost of the works.
q:\mas\ors\docs\Waioeka–Otara Asset Mgmt Plan Operations Report 98/02Environment B·O·P 25
Replacement Cost June 1993 $725/m3 $58,000
September 1996 Value $773/m3 $61,844
Depreciation $6,184
Depreciated Replacement Cost September 1996 $55,660
3.6.4 Edge Protection
The method of valuation used for edge protection is the “replacement cost”. These
assets will be maintained in perpetuity so they will not be depreciated.
Replacement costs for these assets have been taken from the costs of current works
plus engineering of generally 15%:
Rockwork $37.32/tonne 13,904 tonnes $518,896
Rubble $56/m 820 m $45,920
Live Protection : Edge Planting $3.45/m 32,190 m $111,056
Trenched Willows $57.50/m 18,065 m $1,038,737
Fencing $4.60/m 25,480 m $117,208
3.6.5 Buffer Zone
The method of valuation used for buffer zone is the “replacement cost” plus
engineering of 15%.
NB: The buffer zone includes planting and fencing.
Buffer Zone $8.05/m 18,625 m $149,931
3.6.6 Summary of Valuations
Note: The foregoing valuations were prepared to an estimated CCI of 3700 that was
forecast to occur as at June 1996. In practice this CCI value did not occur until
September 1996.
In summary, the valuations including allowance for depreciation as described
previously, at CCI 3700 (i.e. $ September 1996) are:
Stopbanks $9,290,959
Structures 64,448
Structures — contents 51,300
Concrete walls 55,660
Edge protection: rockwork 518,896
rubble 45,920
edge planting 111,056
trenched willows 1,038,738
fencing 117,208
Buffer zone 149,931
TOTAL $11,444,116
Operations Report 98/02 q:\mas\ors\docs\Waioeka–Otara Asset Mgmt PlanYou can also read