LOWER KAITUNA RIVER SCHEME ASSET MANAGEMENT PLAN
←
→
Page content transcription
If your browser does not render page correctly, please read the page content below
ENVIRONMENT B. O . P                                                Environment B·O·P
                                                                Operations Report 98/04
                                                                       September 1998
Bay of Plenty Regional Council

                    LOWER KAITUNA RIVER SCHEME
                           ASSET MANAGEMENT PLAN

                         Report prepared by Matt Surman, Design Engineer

                                                                     Environment B·O·P
                                                                            Quay Street
                                                                           P O Box 364
                                                                            Whakatane
                                                                       NEW ZEALAND

                                                                      ISSN 1173 - 6232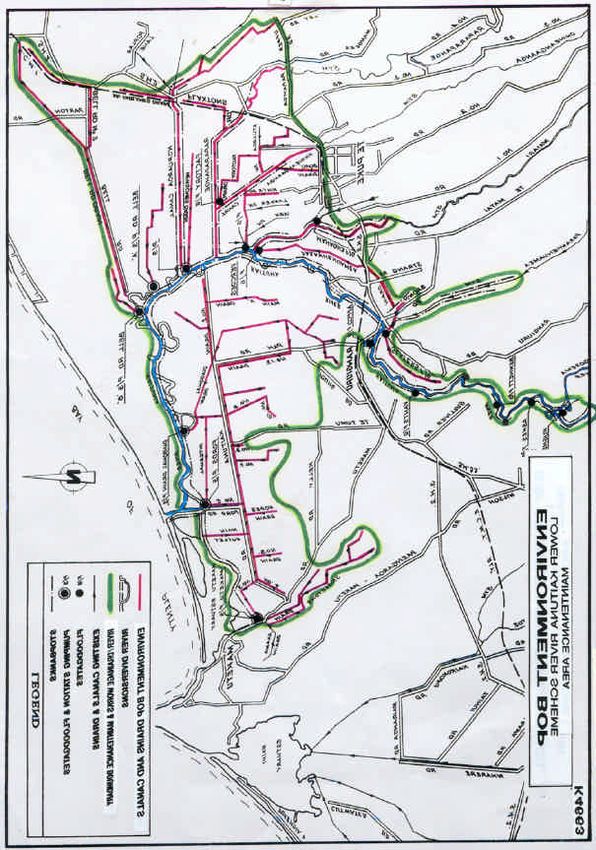
Environment B·O·P

                                          Foreword

                         This plan is a statement by Environment B·O·P,
                         the Manager of the Lower Kaituna River Scheme,
                         as to how it will manage the assets of that
                         scheme. The plan represents prudent management
                         as required by the Local Government
                         Amendment Act (No.3) 1996.

Operations Report 98/4                                               q:\mas\ors\docs\kaituna-asset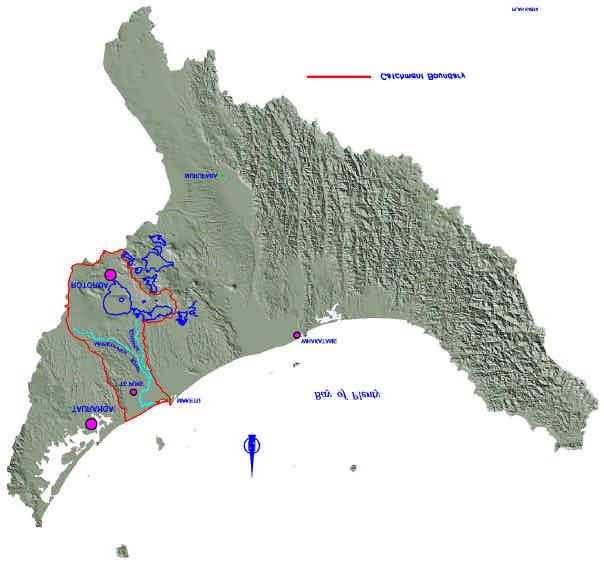
Environment B·O·P                                                                                   i

                                 Executive Summary

The purpose of this plan is to provide a document for the management of the Kaituna River
Scheme and in particular its infrastructural assets.

It establishes and communicates the level of funding required to maintain and meet the
scheme objectives and levels of service.

The plan covers the assets of the scheme including stopbanks, floodgates, dropstructures,
pump stations, rockwork and other erosion protection measures, and plantings. The valuation
in terms of Local Government Act requirements of these assets is $28.4m as at September
1996. The plan also includes a separate flood damages fund and disaster reserve fund.

Maintenance programmes are already in place and these have ensured that the assets are in
good condition and are providing the desired levels of service, except that some stopbanks
have lost a proportion of their freeboard so can be considered to be operating at a reduced
level of service. However, as assets age, maintenance costs will increase. In particular, pump
station costs will increase over previous years expenditure as parts require replacement.

Environment B·O·P, through its day to day management of the scheme, receives continuous
feedback about the scheme. Informal feedback to date indicates strongly that the ratepayers
support the scheme objectives as espoused at the time of construction.

Service levels have therefore been defined to ensure the original scheme objectives are met
and maintained:

•     The stopbanks will generally be maintained to a level to ensure the design flood can be
      conveyed. Settlement of up to 50% of the freeboard will be allowed before stopbank
      reconstruction will be undertaken. In places where no freeboard has been allowed,
      topping up will be carried out in places where the bank is more than 150 mm below
      design level. In some cases, the level of freeboard may need to be reviewed when
      determining whether it is practical to top up stopbanks.

•     All structures will be maintained in a workable condition at all times to function to their
      design standards.

•     Rockwork will generally be maintained to at least 75% of the original placement.

•     River edge protection will be maintained to full potential at all times while not allowing
      any willow growth to be older than 15 years.

Environment B·O·P has a number of tools, which are utilised for the management of its assets.
Information systems have been purchased and developed to assist the asset managers in
general management, maintenance, operations and long term planning. The principle
components are the asset register, Decfin Asset Management Module and the Decfin
Financial Management System.

Environment B·O·P has developed a maintenance programme strategy, which will provide for
efficient and economic operation, to the desired service levels. A detailed assessment has been
Operations Report 98/4 Q:\REPORTS\Operations\9804\98_04 Lower Kaituna River Scheme Asset Mgt Plan.doc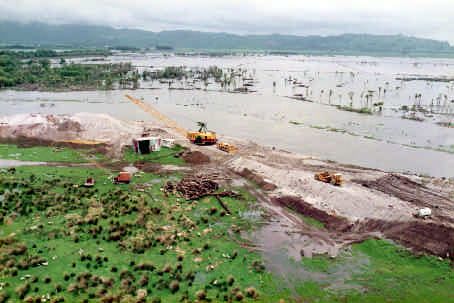
ii                                                                                    Environment B·O·P

undertaken of the work requirement, to provide for the long term, sustainable management of
the scheme assets.

The scheme has been separated into a number of distinct reaches or locations and the key
maintenance issues have been identified for each of these areas.

No acquisition and/or disposal strategies have been developed, as those activities are not
normally a function of this scheme.

The level of expenditure required to meet the scheme objectives and the desired levels of
service is comparable to existing expenditure. Increases will be brought about by the
requirements of asset management and monitoring, establishment of a flood damage reserve
and a renewals fund, built up at the rate assets are depreciating. Most of the increases are
offset by decreases in loan repayments in two years time.

It is estimated that between $325,000 and $374,100 per year will be required, over the next 10
years, to meet the regular and ongoing maintenance necessary to keep the assets operating at
the required level of service. This does not include the requirements to contribute to the flood
damage and disaster reserves. Nor does it include the costs that may, from time to time, be
required to fund significant flood or disaster damage repairs beyond the levels projected in the
plan.

In addition to this, there will be renewal expenditure required to upgrade or renew the asset to
its full (or original) and agreed service potential. It is anticipated that, in the initial years of the
renewal reserve buildup, loans of around $1.3m will be required to fund renewals (primarily
stopbank top-ups). This will occur over the 10 years from year 1999/2000.

The average rate requirement over the next 10 years is expected to be around $684,000, being
very similar to the 1997/98 rate take of $689,300.

The scheme is funded almost entirely by scheme rates. There is a small land rental income.

Regular internal and external independent audits will be carried out to establish a continuous
improvement cycle, maintain best practices and to assess the quality of asset management.

NB:     Values are expressed as at September 1996, unless otherwise noted.

q:\mas\ors\docs\kaituna-asset                                                     Operations Report 98/4
Environment B·O·P

                                                         Contents

Executive Summary.........................................................................................................i

Chapter 1: Introduction .................................................................................................1
1.1       Asset to be Managed...................................................................................................1

1.2       Rationale for Ownership..............................................................................................1

Chapter 2: General Information ...............................................................................7
2.1       Purpose and Ownership of the Plan.........................................................................7

2.2       Legislative Requirements and Asset Owner’s Policies..........................................7

2.3       Duration of the Plan .....................................................................................................8

2.4       Principal Scheme Features.........................................................................................9

2.4.1 The Kaituna River ........................................................................................................9

2.4.2 Overview......................................................................................................................13

Chapter 3: Assets ..........................................................................................................15
3.1       Objectives of the Scheme .........................................................................................15

3.2       Description of the Assets ..........................................................................................15

3.2.1 Stopbanks ...................................................................................................................15

3.2.2 Structures ....................................................................................................................15

3.2.3 Edge Protection..........................................................................................................18

3.2.4 Drains...........................................................................................................................18

3.3       Physical Parameters..................................................................................................18

3.4       Asset Capacity............................................................................................................21

3.4.1 Stopbanks ...................................................................................................................21

3.4.2 Structures ....................................................................................................................21

3.4.3 Edge Protection..........................................................................................................22

Operations Report 98/4                                                                              q:\mas\ors\docs\kaituna-asset
ii Environment B·O·P 3.4.4 Drains.......................................................................................................................... 22 3.5 Asset Condition.......................................................................................................... 22 3.5.1 Stopbanks................................................................................................................... 22 3.5.2 Structures.................................................................................................................... 23 3.5.3 Edge Protection ......................................................................................................... 23 3.5.4 Drains.......................................................................................................................... 24 3.6 Asset Value ................................................................................................................ 24 3.6.1 Stopbanks................................................................................................................... 24 3.6.2 Structures.................................................................................................................... 25 3.6.3 Edge Protection ......................................................................................................... 26 3.6.4 Drains.......................................................................................................................... 26 3.6.5 Summary of Valuations ............................................................................................ 26 3.7 Asset Management Systems................................................................................... 27 3.7.1 Asset Register............................................................................................................ 27 3.7.2 Accounting.................................................................................................................. 27 Chapter 4: Maintenance And Renewals Plan ................................................ 29 4.1 Introduction................................................................................................................. 29 4.2 Service Levels ............................................................................................................ 29 4.3 Maintenance History................................................................................................. 31 4.4 Maintenance Programme......................................................................................... 31 4.5 Maintenance Costs.................................................................................................... 33 4.5.1 Existing ....................................................................................................................... 33 4.5.2 Asset Maintenance Expenditure Requirements................................................... 33 4.6 Expenditure ................................................................................................................ 35 4.6.1 Maintenance, Renewals and Loss of Service Potential...................................... 35 4.6.2 Loan Repayment....................................................................................................... 35 4.7 Funding ....................................................................................................................... 39 q:\mas\ors\docs\kaituna-asset Operations Report 98/4
Environment B·O·P

4.7.1 Reserves .....................................................................................................................39

4.7.2 Sources of Funding....................................................................................................41

4.7.3 Analysis of Funding Requirements .........................................................................41

Chapter 5: Creation/Acquisition/Disposal .......................................................47

Chapter 6: Quality Assurance Systems ............................................................49

Chapter 7: Monitoring ..................................................................................................51
7.1       Effectiveness Monitoring ...........................................................................................51

7.2       Cost Monitoring...........................................................................................................53

References .........................................................................................................................55

Appendices........................................................................................................................57

Appendix I - Responsibilities And Roles In Asset Management.........59

Appendix II — Asset Maintenance And Renewal Requirements ........61

1      General.........................................................................................................................61
1.1       General Overview of Fairwa y, Riverbanks and Berms ........................................61

1.2       Cross-Section Survey................................................................................................61

2      Fairway/Channel .....................................................................................................62
2.1       Weed Spray/Maintenance.........................................................................................62

3      River Banks ...............................................................................................................62
3.1       Tree planting/replacement ........................................................................................62

3.2       Tree Clearing/Burning ...............................................................................................62

3.3       Fence Maintenance ...................................................................................................63

3.4       Rockwork .....................................................................................................................63

Operations Report 98/4                                                                               q:\mas\ors\docs\kaituna-asset
iv                                                                                                                  Environment B·O·P

4      Stopbanks .................................................................................................................. 63
4.1       Minor Floodgates....................................................................................................... 63

4.2       General Inspection .................................................................................................... 63

4.3       Survey......................................................................................................................... 63

4.4       Miscellaneous Maintenance .................................................................................... 64

4.5       Stopbank Reconstruction......................................................................................... 64

5      Structures .................................................................................................................. 64
5.1       Major Floodgates and Dropstructures.................................................................... 64

5.2       Pump Stations ............................................................................................................ 65

6      Flood Damage Repairs ....................................................................................... 66

Appendix III — Expenditure Tables ..................................................................... 67

Appendix IV — Disaster Reserve And Flood Damage Reserve .......... 75

Appendix V — Renewals Fund .............................................................................. 79

Appendix VI — Loan Repayment Schedule As At 30 June 1997 ........ 83

Glossary .......................................................................................................................... 85

q:\mas\ors\docs\kaituna-asset                                                                                 Operations Report 98/4
1
Chapter 1: Introduction
1.1 Asset to be Managed
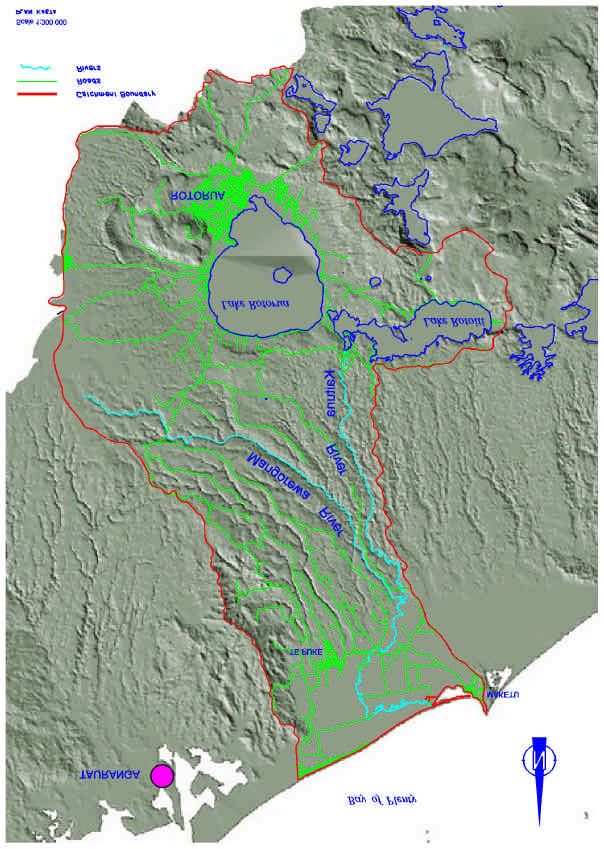
The Lower Kaituna River Scheme is a comprehensive river and drainage control
scheme, providing benefits of flood protection, channel edge stability and drainage to
much of the land in the Lower Kaituna and catchments. The location of the Kaituna
River is shown in Figure 1, with the catchment shown in more detail in Figure 2.
The scheme has substantial physical assets, including stopbanks, drains, floodgates,
dropstructures, pump stations, rock work, plantings and other erosion protection
measures. The valuation, in terms of Local Government requirements, of these assets
is $28.4 million.
The plan is to provide a single document intended to assist the managers of the
Lower Kaituna River Scheme, the Bay of Plenty Regional Council
(Environment B·O·P).
1.2 Rationale for Ownership
The rationale for the existing ownership is as a result of the Local Government Act
provisions whereby Regional Authorities are responsible for the provision and
control of the asset.
In common with all other similar river schemes throughout New Zealand the Kaituna
Scheme (known as the “Kaituna River Major Scheme”) was established under the
provisions of the Soil Conservation Rivers Control Act 1941. This legislation had its
genesis earlier this century and was, for its time, far reaching; Government
recognised that flooding and drainage problems were best dealt with on a large scale
(catchment) basis. Major catchments frequently traversed more than one existing
territorial authority (at that time county and borough councils). The magnitude of the
problem was such that the authorities of the day determined that special purpose (ad
hoc) authorities, with specialist engineering and soil conservation skills, were
required to administer these functions and hence the creation of catchment boards
and catchment commissions.
The Bay of Plenty Catchment Commission was created in 1964 in response to flood
problems in the region. Design for the Kaituna River Scheme was undertaken in the
1960s, with the final report published in 1970. The works were not started until 1979,
when the scheme was joined with the Upper Kaituna Catchment Control Scheme to
form the Kaituna Catchment Control Scheme, which qualified for government
Operations Report 98/4 q:\mas\ors\docs\kaituna-asset2 Environment B·O·P
subsidies. This document deals only with the component known as the Lower
Kaituna River Scheme. Scheme construction continued until 1992, although most
work was completed by 1986.
Until 1992, separate rates were levied by the Western Bay of Plenty District Council
for the Kaituna West and Kaituna East Drainage Districts. The classified rating
system under which the scheme is now funded was designed to incorporate the
separate drainage rates. Consequently, all rates are collected under the classified
system under the provisions of the Soil Conservation and Rivers Control Act 1941.
Under the Local Government Reforms of 1989, Environment B·O·P (the Bay of
Plenty Regional Council) is the successor organisation to the Catchment authority.
River schemes were set up under a tripartite arrangement involving the Government,
the Catchment authority as the designated manager of the schemes, and local
ratepayers. The Government provided the majority of the funds for capital works (in
this case generally 75% of drainage works and 87.5% of river stopbank works were
funded by the Government); with the local ratepayers providing the balance. In
return Government required ratepayers of the scheme to commit to funding its
maintenance in perpetuity. Additionally, until 1987 Government provided assistance
with maintenance to the extent of about 25%. Nowadays however, maintenance of
the scheme rests solely with the scheme ratepayers, identified under a separate rating
district known as the Lower Kaituna River Major Scheme.
The management of the drainage system within the Kaituna Basin, formerly
maintained by the Kaituna Drainage Board, then Tauranga County Council and then
Western Bay of Plenty District Council, was passed to Environment B·O·P in 1992.
The drainage functions are now included in the Lower Kaituna River Major Scheme.
Environment B·O·P, by virtue of its previous experience, has extensive knowledge of
the asset, and the ability to ascertain customer requirements.
q:\mas\ors\docs\kaituna-asset Operations Report 98/4Environment B·O·P 3
Figure 1 Location of Kaituna River Catchment
Operations Report 98/4 q:\mas\ors\docs\kaituna-assetEnvironment B·O·P 5
Figure 2 Kaituna River Catchment
Operations Report 98/4 q:\mas\ors\docs\kaituna-asset7
Chapter 2: General Information
2.1 Purpose and Ownership of the Plan
The purpose of this plan is to provide, within one document, the means and
mechanisms to enable the manager of the asset, to plan for the most efficient and
economic ways to provide for sustainable ongoing management of the Kaituna River
Scheme.
These assets need to be managed, to ensure they continue to effectively deliver
scheme benefits on a long term, sustainable basis. Management requires provision
for monitoring, maintenance and in some instances eventual replacement of these
assets.
This plan defines the objectives and performance standards for the scheme and the
level of maintenance needed to ensure these are met at all times.
The plan also provides a base against which Environment B·O·P’s performance in
maintaining these infrastructural assets can be measured.
This asset management plan will provide a framework for technical, economic and
financial inputs relating to the assets and their impact on long term financial
planning.
The ownership of the plan, after consultation with the ratepayers, rests with the
policy makers; namely Environment B·O·P which is the body responsible for
managing the asset (the Asset Manager). It is essential that there is continuing client
(principally scheme ratepayer) input throughout the duration of the plan.
The plan relies on inputs from statistical data provided by the Asset Management
System, and from Council resolutions pertaining to policy matters, as well as from
those who implement the works and contracts to maintain and provide the service.
Appendix 1 contains a diagram illustrating how the responsibilities for the plan and
the asset are defined.
2.2 Legislative Requirements and Asset Owner’s Policies
The principle regulatory requirements affecting the management of infrastructure
assets result from:
Operations Report 98/4 q:\mas\ors\docs\kaituna-asset8 Environment B·O·P
• Local Government Act 1974.
• Local Government Amendment No. 3 Act 1996.
• Resource Management Act 1991.
• New Zealand Society of Accountants “New Zealand Accounting Standards”;
generally accepted accounting practices (GAAP) as defined in particular by
SSAP 3 and SSAP 28.
• Soil Conservation and Rivers Control Act 1941.
The Local Government Act empowers the elected representatives of the Council to
form policies for the provision of the service, and to recover the costs through user
charges and rates.
It also requires that each local authority:
• Prepare an annual plan indicating performance measures in consultation with
their community.
• Prepare an annual report outlining council performance against annual plan
objectives.
• Adopt financial systems and policies in accordance with generally accepted
accounting practice.
The Local Government Amendment No. 3 Act aims to improve local government
accountability and transparency by outlining the reasons and alternatives associated
with funding decisions so ratepayers can better understand and participate in decision
making.
This asset management plan indicates the long term funding requirements.
Information from the asset management plan will be used in preparing financial and
non-financial statements required by generally accepted accounting practice.
Asset management is also consistent with the objectives of the Resource
Management Act, which requires:
• Sustainable management of physical and natural resources.
• Consideration of alternatives and assessment of benefits and costs.
• Determination of best practicable options.
2.3 Duration of the Plan
This plan has been prepared with a 50 year time horizon. However, a regular review
and updating of the plan will be required, since long-term predictions (of factors such
as interest rates, maintenance requirements, methods and costs), are obviously
difficult to make with sufficient accuracy.
q:\mas\ors\docs\kaituna-asset Operations Report 98/4Environment B·O·P 9
Thus, the duration of this plan is 10 years from the date of formal preparation and
acceptance by Council.
The plan will be reviewed, either after ten years or earlier if required, and updated to
ensure that the requirements of the customers are met, and that the systems are
maintained at their most effective levels of service.
The information prepared under Section 4.0 of this plan will be incorporated in both
the Strategic Plan of Council as well as the Annual Plan for each financial year.
2.4 Principal Scheme Features
2.4.1 The Kaituna River
The Kaituna River has a total catchment of approximately 1250 km2 . About 630 km2
lies above the start of the Kaituna River at the outlet of Lake Rotoiti. The
fluctuations in flow from the upper part of the catchment are very small compared to
the fluctuations from major tributaries due to the storage effect the lakes have, in
particular Lake Rotorua.
The major tributary that contributes most to flood flows is the Mangorewa River,
although the Kaituna River itself also contributes significantly. In the floodplain area,
other tributaries include the Parawhenuamea, Waiari, Ohineangaanga, Raparapahoe
and Kopuaroa Streams.
Figure 3 shows the general layout of the Kaituna River Scheme and the maintenance
boundary.
Maintenance boundaries include:
• End of stopbanks on Waiari and Parawhenuamea Streams and the Mangorewa
and Kaituna Rivers.
• Washer Avenue on the Ohineangaanga Stream.
• Upper Papamoa Rd on the Kopuaroa and Raparapahoe Streams.
• Railway line on Bell Road Drain.
• State Highway 2 on Bell Road No.2
Operations Report 98/4 q:\mas\ors\docs\kaituna-assetEnvironment B·O·P 11
Figure 1 Lower Kaituna River Scheme Maintenance Area
Operations Report 98/4 q:\mas\ors\docs\kaituna-assetEnvironment B·O·P 13
2.4.2 Overview
The Lower Kaituna River Scheme is a river scheme that includes:
• A total of 67 km of stopbanking, of the Kaituna and Mangorewa Rivers, and
the Kopuaroa, Raparapahoe, Ohineangaanga, Waiari and Parawhenuamea
Streams and Canals.
• Seven pumping stations, namely the Kopuaroa, Bell Road A, Bell Road B,
Kaituna Wetland, Diagonal Drain, Fords and Maketu pump stations.
• A total of 88 km of drains in a network across the plains.
• Floodgates preventing backflow into drains and canals without stopbanks.
• Planting and rockwork.
Prior to the construction of the Lower Kaituna River Scheme, the Kaituna basin was
subject to a risk of extensive flooding as a result of overflow from high river flows or
from restricted drainage. Various proposals for flood protection since 1907 had been
partly implemented prior to the scheme, but none were sufficiently comprehensive to
give the benefits achieved today. Sixteen floods are documented in the 1970 scheme
report between 1907 and 1968 that caused extensive flooding to the surrounding
areas.
The Kaituna River Major Scheme was designed by the then Bay of Plenty Catchment
Commission during the 1960s to overcome these problems. In particular, the scheme
proposals were:
• Kaituna River from the mouth to Te Matai - stopbank construction and
channel widening with capability of conveying 1% AEP flows. (By definition,
the 1% Annual Exceedance Probability flood has a 1% probability of occurring
in any one year. This is commonly known as the 1 in 100 year flood).
• Kaituna River from Te Matai to Mangorewa confluence – stopbank
construction at various locations to 10% AEP standard (10 year standard).
• Lower Waiari, Ohineangaanga, Raparapahoe, Kopuaroa streams -
stopbank construction to convey the 1% AEP event.
• Parawhenuamea, middle Waiari streams – stopbank construction to 10%
AEP standard.
• Kaituna Basin – improved drainage for 5,500 ha of low-lying land.
Most of the works were undertaken over the period from 1981 to 1986, although
capital works continued until 1992. Minor bank erosion protection works and other
modifications have continued, hence new assets are still being created.
Total assets quantities to date:
67.3 km stopbanks
88.5 km drains
Operations Report 98/4 q:\mas\ors\docs\kaituna-asset14 Environment B·O·P
1.5 km rockwork
5.9 km planting and fencing
7 pump stations
11 flood control gates
3 dropstructures
The scheme is funded by way of a rate struck over the area of benefit. A
“classification” establishes the relative benefit received by all the lands within the
scheme. Rates for any property are calculated on the bases of land area and benefit
classification of that property.
The area receiving benefits from the scheme amounts to approximately 11,700
hectares.
q:\mas\ors\docs\kaituna-asset Operations Report 98/415
Chapter 3: Assets
3.1 Objectives of the Scheme
The Lower Kaituna River Scheme consists of a number of component infrastructural
assets to provide the following:
• Security from floods up to the 1% Annual Exceedance Probability (AEP) to
some 9,700 hectares of the Kaituna Basin.
• Security from floods up to the 10% AEP in maintenance areas upstream of the
Kaituna Basin.
• Minimized erosion of riverbanks.
• Adequate drainage for the Kaituna Basin, generally to a 3 day 10% AEP
standard (37.5 mm/day).
3.2 Description of the Assets
Refer Figure 4.
3.2.1 Stopbanks
Stopbanks (also known as flood banks) are compacted earth structures, which
provide protection to urban and rural properties from floodwaters. The asset
‘stopbanks’ includes an allowance for the minor culverts and fences that normally
surround or are part of the stopbanks.
3.2.2 Structures
(a) Floodgates
Floodgates are structures that may be opened or closed to admit or exclude flood and
tidal waters.
(b) Drop Structures
Drop structures are designed to dissipate the energy of water as it goes over a
cascade, without erosion occurring.
Operations Report 98/4 q:\mas\ors\docs\kaituna-asset16 Environment B·O·P
(c) Pump Stations
Pump stations consist of mechanical and electrical equipment and associated
reinforced concrete structure and building, which raises water to a position where it
is able to flow away under gravity.
(d) Mole Structure
The Kaituna River Mole keeps the river entrance from eroding and migrating
eastwards.
q:\mas\ors\docs\kaituna-asset Operations Report 98/4Environment B·O·P 17
Figure 4 Asset Management Typical River Cross Section
Operations Report 98/4 q:\mas\ors\docs\kaituna-asset18 Environment B·O·P
3.2.3 Edge Protection
(a) Rock
Mechanically placed rock rip-rap provides protection to the riverbanks, especially in
areas of high erosive forces and tidal reaches where vegetation is difficult to
establish.
(b) Rubble
In some locations on the river, concrete rubble has been used in place of rock.
Rubble provides less edge protection than rock because it has a lower density, poor
shape characteristics (it can be “plucked” off the riverbank by the river flow) and is
generally less durable. It requires more monitoring than rock and is aesthetically
inferior. Its principal advantage is that it is less expensive than rock and it is a cost
effective material for some applications.
(c) Live Protection
Most planting in recent years has been of native plants, including flax, coprosma,
manuka and pittosporum species (Refers to Edge Protection in Table 2, Physical
Parameters). Matsudana willows, where available, are used in places subject to
medium erosive forces (where natives are too slow to establish or will not bind the
soil sufficiently, and rock is unnecessary). Willows may be “layered” onto the
riverbank to provide protection against erosion.
In most instances the live protection includes a small buffer zone on the berm
between the riverbank and the stopbank, which is fenced off to exclude stock.
Fencing is an integral part of the live protection assets.
3.2.4 Drains
Excavated channels designed to convey water to the main river and canal channels
and to pump stations.
3.3 Physical Parameters
The following tables 1 to 4 provide a summary of the physical parameters of the
assets. The tables are also stored as spreadsheets in the Environment B·O·P
“designgroup Ceres” computer directory (r:\assets\valuatio\kaituna).
q:\mas\ors\docs\kaituna-asset Operations Report 98/4Environment B·O·P 19
Table 1 Infrastructural Assets - Structures
Location Replacement Age Depreciation Net Value Structure Depreciation
Cost YTD 30.6.96 Structure 30.6.96 Life Annual
Kaituna Structures
Raparapahoe Drop Structure 172869 8 69148 103721 12 8643
Ohineangaanga Floodgate 37384 7 5234 32150 43 748
Managhs FG and Culvert 134877 13 35068 99809 37 2698
Browns Box Culvert 88171 13 22925 65247 37 1763
Bells Rd Box Culvert 289465 13 75261 214204 37 5789
Scowns Culvert 20601 5 2060 18541 45 412
Subtotal $ 743,367 $ 533,672 $ 20,053
Wetlands 81600 4 6528 75072 46 1632
Bell B 209900 6 25188 184712 44 4198
Maketu 390200 12 93648 296552 38 7804
Diagonal Drain 529100 12 126984 402116 38 10582
Bell A 222600 7 31164 191436 43 4452
Kopuaroa 357200 9 64296 292904 41 7144
Ford Rd 198200 14 55496 142704 36 3964
Subtotal Pumps Structures $ 1,988,800 $ 1,585,496 $ 39,776
Total Structures $ 2,732,167 $ 612,999 $ 2,119,168 $ 59,829
Kaituna Pump Contents
Wetlands 24600 4 3280 21320 26 820
Bell B 144670 6 28934 115736 24 4822
Maketu 344600 12 137840 206760 18 11487
Diagonal Drain 588700 12 235480 353220 18 19623
Bell A 278200 7 64913 213287 23 9273
Kopuaroa 290800 9 87240 203560 21 9693
Ford Rd 124200 14 57960 66240 16 4140
Total Contents $ 1,795,770 $ 615,647 $ 1,180,123 $ 59,859
Total Kaituna $ 4,527,937 $ 1,228,646 $ 3,299,291 $ 119,688
Table 2 Infrastructural Assets – Kaituna Drains and Canals
Canals Length (m) Kaituna East Length (m)
Kopuaroa 7610 Main A 1430
Raparapahoe 5620 Diagonal (to corner) 2710
Ohineangaanga 2830 off end Diagonal 4520
Waiari 3820 No.13 1770
Parawhenuamea 2500 No.2 2130
22.38 km off No.2 850
Kaituna West between 13,9 1000
Bell B 1230 No.9 1030
Bell Rd 9670 No.10 620
Bell A 2430 Kaituna Rd to Diagonal 680
McFarlanes 990 Internal 2210
off Kopuaroa 940 No.8 230
Newsomes 2290 No.7 1450
Flaxtons 1590 Kaituna Rd 5280
Factory + Atuaroa 3520 No.6 840
off Ohineangaanga 1240 Hope's 400
Borough 800 No.5 690
Nintz 650 No.4 610
Parawhenuamea Drain 3850 No.3 1330
Brown Rd 480 Main Outlet 990
Slaters 1780 Crossan's 680
31.46 km Singleton's 1100
Adjacent to Singleton's 2090
34.64 km
Total drains 66.10 km Volume (cubic metres) Incl. Engineering
Total canals + drains 88.48 km 530880 Earthworks $ 424,551 $ 488,234
Culverts $ 136,941 $ 157,482
compared 87.43km, file 0360 04 (no details)
plus 680m Main/Ford Rd 88.11 km Total $ 645,716
Operations Report 98/4 q:\mas\ors\docs\kaituna-asset20 Environment B·O·P
Table 3 Infrastructural Assets Edge Protection 98
Length (m) Cost
Location Plan No Edge Fencing Edge Fencing
Protection Protection
Kaituna River Sheet 4 500 500 $5,000 $2,000
Sheet 5 1160 1160 $11,600 $4,640
Sheet 6 1020 1020 $10,200 $4,080
Sheet 10 560 560 $5,600 $2,240
Sheet 11 1200 1200 $12,000 $4,800
Sheet 12 330 330 $3,300 $1,320
Sheet 19 770 770 $7,700 $3,080
Total Scheme 5540 5540 $55,400 $22,160
15 % Engineering etc $8,310 $3,324
Total Kaituna Scheme 5540 5540 $63,710 $25,484
$89,194
Table 4 Infrastructural Assets Stopbank Quantities 96
Location Batters Top Width S/B Height Length Volume
m m m m3
Kaituna LB 5.75 to 8.25 3 3.5 3.4 2,100 97,818
Kaituna LB 8.51 to 11.61 3 3.5 3.1 3,135 124,397
Kaituna RB 0.36 to 0.95 2 7.6 2 585 13,572
Kaituna RB 1.07 to 1.91 3 3.7 2.4 965 25,244
Kaituna RB 1.95 to 2.60 3 3.7 2.7 685 21,824
Kaituna RB 2.60 to 5.2 3 3.7 3.3 2,765 124,093
Kaituna RB 5.2 to 8.55 3 3.5 3.2 3,280 137,498
Kaituna RB 8.55 to 11.61 3 3.5 2.6 3,060 89,903
Kaituna RB 11.71 to 11.95 3 3.5 2.1 250 5,145
Kaituna RB 12.0 to 12.2 5 3.5 2.1 250 7,350
17,075 646,844
Te Matai to 10 m 3 3.5 1.5 3,125 37,500
Mangorewa Confluence 3 3.5 0.5 475 1,188
4 3.5 0.9 810 5,176
91_24 3 3 1.4 1,200 12,096
92_01 3 3.5 1.1 745 5,573
Kaituna RB 19.75 to 19.9 3 3.5 1.1 150 1,122
6,505 62,654
Maketu Estuary 3 3.5 1.2 135 1,150
Maketu Estuary 3 6.5 1.2 105 1,273
Maketu Estuary 3 3.5 1.8 550 8,811
Maketu Estuary 3 3.5 2.4 1,250 32,100
Maketu Estuary 3 3.5 2 1,450 27,550
Maketu Estuary 5 3.5 2 150 4,050
Maketu Estuary 3 1.5 0.8 2,915 9,095
6,555 84,029
Bell Road 3 3.5 0.7 3,340 13,093
Bell Road 3 9 0.8 2,635 24,031
5,975 37,124
Kopuroa Canal 3 2.5 2.9 8,040 261,139
Raparapahoe Canal 3 3.5 3.1 6,320 250,778
Raparapahoe Canal 3 3 0.8 3,875 16,740
10,195 267,518
Ohineangaanga Stream 3 3.5 2.5 3,580 98,450
Waiari Stream 3 3 2.7 6,600 197,802
Waiari Stream 3 3 1.6 395 4,930
6,995 202,732
Parawhenuamea Stream 2.75 3.5 2.1 2,400 46,746
Total Kaituna Canals 37,185 913,708
Total Kaituna 67,320 1,707,235
q:\mas\ors\docs\kaituna-asset Operations Report 98/4Environment B·O·P 21
3.4 Asset Capacity
3.4.1 Stopbanks
Stopbanks are built to a level and grade where they will not be overtopped by the
design flood (Table 5). They are also constructed to appropriate batters and top width
to ensure their structural integrity.
Table 5 Design Levels for Kaituna Scheme Stopbanks
Location Design Level
Kaituna River: Mangorewa to Te
10% AEP (no freeboard)
Matai, Mangorewa River 600 m
Kaituna River: downstream of Te
1% AEP plus 500 mm freeboard
Matai
Parawhenuamea Stream, Waiari
10% AEP (no freeboard)
Stream above SH2
Waiari, Ohineangaanga, Raparapahoe,
1% AEP plus 300 mm freeboard
Kopuaroa Streams
Maketu Estuary 2.74 m R.L.
Design levels of the stopbanks were reviewed in 1998 (Surman). There is a difficulty
with calculation of flows derived from the Te Matai gauge because water levels have
been affected by changing bed levels since the implementation of the scheme and are
now also affected by the tide. The revised design indicates the majority of stopbanks
require a lower level than the level to which they were built.
3.4.2 Structures
(a) Floodgates
Floodgates are designed to stop flow up tributary streams/canals when the main river
is in flood and during the rising tide. They are designed to discharge floodwaters and
everyday flows when the main river and/or tide recede.
Floodgates are sized accordingly to discharge a design flow for a particular
storm/flood event. In general, floodgates on the Kaituna Scheme cater for a 5 year
(20% AEP) event.
(b) Pump Stations
Pump stations are designed to discharge drainage and flood flows to a particular
design standard. This occurs when the gravity outlet is closed or inhibited, or at all
times when a gravity outlet does not exist.
The pump stations, in association with the water storage capability of the canals they
pump, have been designed to cope with the critical 20% AEP storm. This equates to
a drainage co-efficient of 37.5 mm/day i.e. the system is designed to remove 37.5
mm/day over 3 days from the contributing catchments.
Operations Report 98/4 q:\mas\ors\docs\kaituna-asset22 Environment B·O·P
3.4.3 Edge Protection
Rock work and live protection are erosion control works that are designed to protect
the stopbanks and/or natural channel banks from erosion and consequential flood
overflows, to maintain channel stability and to reduce the deposition of sediment in
the lower reaches of the river system.
3.4.4 Drains
Drains are designed to a 20% AEP standard, of 37.5 mm/day. They are also intended
to maintain the groundwater table to a level appropriate to surrounding ground levels,
for the predominant land use (currently dairy farming), without causing overdrainage
and therefore excessive peat shrinkage.
3.5 Asset Condition
3.5.1 Stopbanks
The original 1970 design was based on an estimate of the 1% AEP flood peak of 920
cumecs at Te Matai. Prior to construction, the flow data was reviewed, indicating a
significantly lower 1% AEP flow of 580 cumecs at Te Matai. A further review in
1998 incorporating the increased flood flow database available gave the 1% AEP
flow as 460 cumecs.
Most settlement of stopbanks occurs in the first years following construction, as
subsurface layers consolidate.
Data from cross-section surveys (generally 500 m apart), indicates that in many
areas, there has been significant settlement of some stopbanks since construction. For
example, by 1992, the average river stopbank level was about 260 mm below its
initial construction level. A 1998 survey shows the stopbanks near Te Matai have
dropped on average a further 40 mm and stopbanks near the Ohineangaanga and
Raparapahoe confluence are on average 300 mm below design level.
In some locations, the stopbank crest has been used for stock access, resulting in
removal of the grass protection to the crest. This increases the likelihood of erosion
during an overtopping event. Also, especially around section 13-16, (from Bell Road
to Raparapahoe confluence), the stopbank crest is variable, and again highlights the
need for a regular longitudinal survey.
The recommended criteria for stopbank top-ups is to top-up areas where there is less
than 50% of the freeboard remaining. Where no freeboard has been allowed, an
agreed level of acceptable settlement needs to be set (say 150 mm). A detailed
longsection resurvey has been undertaken to check bank levels and therefore service
levels. Several areas require top-ups to meet the design standard in the short term.
A regular longitudinal survey of the stopbank crests is required to monitor available
freeboard, and has been included in the 5 yearly maintenance requirements outlined
in appendices 2 and 3. The first round of top-up costs have been calculated from a
longsection of the banks and the revised 1998 design levels. Subsequent top-ups have
been calculated assuming 5% of the volume of a stopbank is required to be topped up
q:\mas\ors\docs\kaituna-asset Operations Report 98/4Environment B·O·P 23
every 20 years. The 40 mm drop referred to above represents a drop of 5% every 20
years.
Following feedback from scheme ratepayers, where the issue of debt servicing is of
major concern, this plan proposes that a phased stopbank renewals programme be
instituted to spread the higher than usual stopbank renewals costs. This may mean
that the criteria of topping up once less than 50% of freeboard remains, will not
always be met in the first few years.
Bank integrity is also compromised by toe erosion, by stock access and by the
existence of old, large trees on the bank. These problems are exacerbated by the lack
of an adequate berm in some locations. Ongoing maintenance will steadily address
these. However, it is possible that capital works may also be needed in the future . In
problem areas, major works may be needed to improve the stopbank geometry.
These issues will be readdressed in the ten year review of this Asset Management
Plan.
Stopbank asset condition will continue to be monitored by visual inspections,
physical surveys and scheme reviews including detailed computer modelling.
3.5.2 Structures
A regular programme of maintenance is carried out on all structures. In particular,
any working parts that wear out or that are showing signs of age are replaced. Asset
condition is monitored by regular inspection (see Appendix II). Structural concrete is
inspected periodically. At present all structures retain their structural integrity.
One structure that will require attention in the near future is the mole structure at the
rivermouth, which prevents the rivermouth from migrating eastwards. It has not, up
to now, been recognised as an asset of the scheme and has been the object of some
discussion between Environment B·O·P and the Western Bay of Plenty District
Council. The estimated maintenance and renewal costs and the asset have been
included in the plan in case it is decided that Environment B·O·P should be
responsible for the structure.
3.5.3 Edge Protection
The condition of the live edge protection in the scheme varies depending on its age
and its previous maintenance. In general, recent plantings have been in long
stretches, accompanied by appropriate fencing and these are included in the asset
register. Some minor, older plantings have not been included in the register as their
maintenance is likely to involve replacement or improvement as part of a larger
work. Further planting is expected to be beneficial in some areas and has been
allowed for in the river reaches.
Where rockwork exists, a works programme has been implemented to replenish areas
where levels have fallen below 50% of the original design placement rate. It is
intended that this threshold be increased to 75% of the original design placement rate
to maximise stopbank security.
Landowners and Environment B·O·P works staff have expressed concern that the
passage of jet boats and other craft that create a large wake increases bank erosion. A
monitoring programme is in place along the reaches involved.
Operations Report 98/4 q:\mas\ors\docs\kaituna-asset24 Environment B·O·P
3.5.4 Drains
Drains are regularly and frequently maintained by excavation by digger, weed
cutting, spraying and removal as required to maintain their hydraulic capacity.
Recently, increased use of weed cutting has seen maintenance standards improve
through more frequent clearing of drains. Peat shrinkage is an issue in the future
effectiveness of drains.
3.6 Asset Value
SSAP 28 “Accounting for Fixed Assets” outlines the accounting practice for asset
valuation. The guideline is currently under review by the Institute of Chartered
Accountants of New Zealand (formerly the NZ Society of Accountants), particularly
in its application to infrastructure assets.
The valuation of an infrastructural asset can be determined by using either a
depreciated value of the original construction (historical) cost; the replacement cost
of the components of the asset; or the depreciated replacement cost of the asset.
Usually the asset has been added to over a period of time, and has been upgraded and
maintained to a high level of serviceability in order to continue providing the
required level of service.
Council resolved in June 1993 to adopt the following policies:
• That “depreciated replacement cost” be used for the valuation of all structures.
• That drainage networks be valued at replacement cost.
• That depreciated historical cost be used for the valuation of stopbanks.
A revaluation of the assets was completed in June 1996. After discussions with Audit
Office, Council has decided to use “depreciated replacement cost” for the valuation
of the stopbanks. This “replacement cost” is based on the “historical cost” (see
below).
3.6.1 Stopbanks
All river schemes in the Bay of Plenty region have either had upgrading work
undertaken on them, or had new works built, within the last ten years. This gives
Environment B·O·P excellent data to establish the value of the stopbank assets.
It is noted that if the stopbanks were to be rebuilt now, the methods of construction
and available borrow may be completely different from when the banks were
originally constructed. The Kaituna Scheme stopbanks were built from borrow won
from the river; this material may no longer available and borrow may have to be
brought in from off site, thus significantly increasing the costs. The likelihood that all
the banks would be destroyed or damaged during a catastrophic flood (and therefore
would need total replacement), is highly unlikely. On balance on this point therefore
it is considered that historical cost is the appropriate measure.
The basis for valuation is historical cost, based on the same method of
construction as originally carried out. This historical cost is used as the
q:\mas\ors\docs\kaituna-asset Operations Report 98/4Environment B·O·P 25
replacement cost for valuation purposes with an adjustment made at each new
valuation for movements in accordance with the Construction Cost Index (CCI).
The stopbanks will be maintained to convey their design floods but settlement of up
to 50% of the freeboard will be allowed before stopbank reconstruction will be
undertaken. Therefore, the stopbanks value will depreciate to some extent. Initially,
this rate is expected to be higher than in later years. At this stage, the best estimate is
that reconstruction will be required every twenty years. On the riverbanks, a
depreciation rate of 1.25% has been used for the first five years and 0.3%
subsequently, i.e. after twenty years the stopbanks will have lost 10% of their value.
Therefore, the valuation of stopbanks is by “depreciated replacement cost”. In the
following twenty years, they are estimated to lose 5% of their value. The canal banks
have been found to have settled at a faster rate – they have been depreciated at 1.45%
a year for their first five years, then 0.3% subsequently. (After the first 20 years, the
canal banks are therefore assumed to have lost 12% of their volume).
The valuation for the Kaituna Scheme stopbanks has been done on a per metre basis,
including all associated costs such as minor culverts, fences, compensation and
rockwork undertaken at the same time as construction.
Table 6 summarises the costs for the Kaituna Scheme stopbanks.
Table 6 Costs of Kaituna Scheme Stopbanks
Quantity Length 1993 Costs 1996 Costs
1993 rate
(m3 ) (m) (CCI = 3470) $ (CCI= 3700) $
Kaituna Scheme $383/m 1,707,235 67320 25,783,560 27,492,557
Depreciation 2,351,263
Total 25,141,294
3.6.2 Structures
The current replacement cost of the structure and contents of each pump station is
calculated annually for insurance purposes.
For the contents of the pump stations there is regular and ongoing annual expenditure
necessary to keep the assets operating at the required level of service. There are also
other less frequent maintenance works (Table 9) which periodically returns the asset
to close to the original service potential. Nevertheless, an initial decline in value after
construction does occur since at any one time the pump station contents will consist
of components of mixed age.
For structures that are not valued annually, the original tender price plus 25% for
design, supervision etc is used as the base figure, adjusted by the appropriate factor
to take account of CCI changes, to today’s value, to establish the current replacement
cost.
All concrete structures have an estimated useful life of 50 years. Gabion
dropstructures have an estimated useful life of 20 years. Knowledge of the age of
each structure enables the “depreciated replacement cost” (DRC) costs to be
calculated.
Operations Report 98/4 q:\mas\ors\docs\kaituna-asset26 Environment B·O·P
The Kaituna rivermouth mole has been assumed to have zero residual value, since it
is nearly 50 years old, despite it still providing a useful service. It will need repair or
replacement shortly.
Table 7 Structure and Contents valuations as at September 1996
Structures Contents
Depreciated Depreciated
Replacement Cost Replacement Cost
Major floodgates, culverts, dropstructures $533,672
Pumpstations $1,585,496 $651,685
TOTAL $2,119,168 $651,685
3.6.3 Edge Protection
The method of valuation used for edge protection is the “replacement cost”. These
assets will be maintained in perpetuity so they will not be depreciated.
Replacement costs for these assets have been taken from the costs of current works
plus engineering of generally 15%:
Table 8 Live protection valuation as at September 1996
Live Protection Edge Planting $10/m 5,540 m $55,400
Fencing $4/m 5,540 m $22,160
Engineering 15% $11,634
Total $89,194
3.6.4 Drains
Drains have been valued by volume, assuming an average 6 m2 cross-section profile.
In addition, allowance has been made for culverts and fences alongside a proportion
of the drains. The drain profile is maintained during normal maintenance, however
allowance for replacement of culverts has been made as with other assets.
The drains and canals with associated culverts (but not including stopbanks on the
canals), have been valued at $645,716.
3.6.5 Summary of Valuations
Note: The foregoing valuations were prepared to a CCI of 3700, which occurred in
September 1996.
In summary, the valuations including allowance for depreciation as described
previously, at CCI 3700 are:
Stopbanks including rockwork $25,141,294
Structures $2,119,168
Structures - contents $651,685
Edge protection $89,194
Drainage system $645,716
TOTAL $28,420,085
q:\mas\ors\docs\kaituna-asset Operations Report 98/4Environment B·O·P 27
3.7 Asset Management Systems
Environment B·O·P has a number of tools, which are utilised for the management of
its assets.
Information systems have been purchased and developed to assist the asset managers
in general management, maintenance, operations and long term planning.
The system comprises:
3.7.1 Asset Register
The asset register constitutes the heart of the asset management system. It provides a
definition of assets (description, location), details of physical dimensions and
capacity. It also details age and replacement costs. At present the register is in two
formats. The initial gathering of information on all Environment B·O·P assets has
been incorporated into one document, Bay of Plenty Regional Council Asset Register
1993, which is stored in file 0360 04.
As noted in section 3.3, the information has then been summarised (in Excel
spreadsheet files) before being used for valuation purposes. An updated summary is
stored on file 5810 02 K01.
The assets are also shown on hard copy aerial photographs. Ideally this information
should be stored in the GIS for ease of access and analysis.
Finally, as below, a module of Decfin has been developed to act as an asset register.
3.7.2 Accounting
Environment B·O·P operates the Decfin Financial Management System as its
corporate financial and budgeting database. Integrated into this system is the Asset
Management Module that contains the database of infrastructural assets maintained
by Environment B·O·P. This database along with spreadsheet files and plans forms
the asset register.
The database records the category, description, location, and other asset details along
with a unique identifier for each asset.
Financially significant data relating to each asset is collected for analysis through the
integrated links of the asset register database and the financial system. This data can
be analysed to assess the real cost of maintenance, optimise maintenance procedures,
identify future workloads, prepare budgets and record the maintenance history of
each asset.
Future development of the Asset Management System will focus on developing
work-scheduling functionality and fine-tuning of the physical maintenance data
collected for each asset. It is envisaged that links to Environment B·O·P’s
Geographic Information System will be developed so asset managers are able to
access financial and physical data associated with each asset in a spatial
environment. Direct links from the database to the spreadsheets, to ensure both are
kept up to date, may also be created, although eventually the spreadsheets will
become redundant.
Operations Report 98/4 q:\mas\ors\docs\kaituna-assetYou can also read