Energy Division Central Files Document Coversheet
←
→
Page content transcription
If your browser does not render page correctly, please read the page content below
Energy Division Central Files Document Coversheet

Directions: Submit all documents and submittal questions to Energy Division Central Files via email
EnergyDivisionCentralFiles@cpuc.ca.gov
      1. Fill out coversheet completely. Coversheet can be embedded as page 1 of the electronic compliance filing, or
         can be submitted as a separate document that is attached to the email that delivers the compliance filing.
      2. All documents are required to be submitted in an electronically searchable format.
      3. Documents need to reference the reason for the mandate that ordered the filing in Section B or C. If you are
         unable to reference a proceeding or explain the origin of your filing, please contact Energy Division Central Files.
      4. To find a proceeding number (if you only have a decision number), go to
         http://docs.cpuc.ca.gov/DecisionsSearchForm.aspx; enter the decision number, and the results shown
         include the proceeding number.

 A. Document Name
 Today’s Date (Date of Submittal) 7/30/2019
 Name:
 1.    Utility Name: Southern California Edison Company
 2.    Document Submission Frequency (Annual, Quarterly, Monthly, Weekly, Once, Ad Hoc): Final
 3.    Report Name: SCE DRP Demonstration D Final Status Report
 4.    Reporting Interval (the date(s) covered by the data, e.g. 2015 Q1): 2019
 5.    Name Suffix: Cov (for an Energy Division Cover Letter), Conf (for a confidential doc), Ltr (for a letter from utility)
 6.    Document File Name (format as 1+2 + 3 + 4 + 5): SCE DRP Demonstration D Final Status Report 2019

 Sample Document Names:
 Utility Name + Submittal Frequency + Report Name + Year + Reporting Interval
 SCE Annual Procurement Report 2014
 SDG&E Ad Hoc DR Exception 2015Q1 Conf
 SEMPRA Monthly Gas Report 201602
 SEMPRA Daily Gas Report 20160230
 SEMPRA Daily Gas Report 20160230 Cov
 SEMPRA Daily Gas Report 20160230 Ltr

 7. Identify whether this filing is ☒original or ☐revision to a previous filing.
        a. If revision, identify date of the original filing:

 B. Documents Related to a Proceeding
 All submittals should reference both a proceeding and a decision, if applicable. If not applicable, leave blank and fill
 out Section C.

 1. Proceeding Number (starts with R, I, C, A, or P plus 7 numbers): R.14‐08‐013
 2. Decision Number (starts with D plus 7 numbers): D.17‐02‐007
 3. Ordering Paragraph (OP) Number from the decision: 9 and 28

 C. Documents Submitted as Requested by Other Requirements
 If the document submitted is in compliance with something other than a proceeding, (e.g. Resolution, Ruling, Staff
 Letter, Public Utilities Code, or sender’s own motion), please explain: N/A

           1
Energy Division Central Files Document Coversheet

D. Document Summary
Provide a Document Summary that explains why this report is being filed with the Energy Division. This information
is often contained in the cover letter, introduction, or executive summary, so you may want to copy it from there and
paste it here.
Consistent with Decision (D.)17‐02‐007, Ordering Paragraph Nos. 9 & 28, SCE is submitting a final status report for
Distribution Resource Plan Demonstration Project D.

E. Sender Contact Information
1.   Sender Name: Kavita Srinivasan
2.   Sender Organization: Southern California Edison
3.   Sender Phone: 626‐302‐3709
4.   Sender Email: Kavita.Srinivasan@sce.com

F. Confidentiality
1. Is this document confidential? ☒No        ☐Yes
         a. If Yes, provide an explanation of why confidentiality is claimed and identify the expiration of the
         confidentiality designation (e.g. Confidential until December 31, 2020.) N/A

G. CPUC Routing
Energy Division’s Director, Edward Randolph, requests that you not copy him on filings sent to Energy Division
Central Files. Identify below any Commission staff that were copied on the submittal of this document.

     1. Names of Commission staff that sender copied on the submittal of this Document: Jose Aliaga-Caro, Gabe
        Petlin, Dina Mackin, and Fred Wellington

                                                                                                           ver.7/6/2016

         2
DRP Demonstration D – Final Status Report

 DRP Demonstration D

     Final Status Report

                30 July 2019

                        1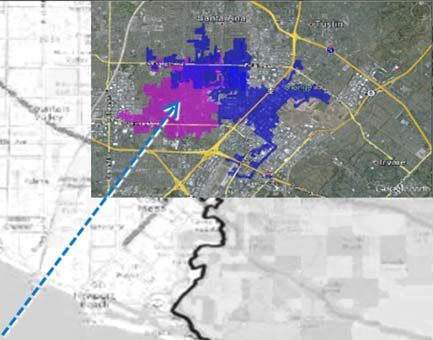
DRP Demonstration D – Final Status Report

Table of Contents

1   Executive Summary ......................................................................................................................................... 6
    1.1       Introduction ..................................................................................................................................................................... 6
    1.2       Demo D Project Objectives and Overview .......................................................................................................... 7
    1.3       Level of Completion of Key Activities.................................................................................................................... 8
    1.4       Key Accomplishments ................................................................................................................................................. 9
    1.5       Key Lessons Learned ................................................................................................................................................. 11
    1.6       Challenges Encountered .......................................................................................................................................... 14
    1.7       Funding .......................................................................................................................................................................... 14

2   Project Summary ............................................................................................................................................15
    2.1       Objectives ...................................................................................................................................................................... 15
    2.2       Scope............................................................................................................................................................................... 15
    2.3       Project Approval ......................................................................................................................................................... 15
    2.4       Demo D Location ....................................................................................................................................................... 16

3   System Design .................................................................................................................................................17
    3.1       Approach ....................................................................................................................................................................... 17
    3.2       System Requirements / Use Cases ...................................................................................................................... 17
    3.3       Design Considerations ............................................................................................................................................. 18
    3.4       Cybersecurity................................................................................................................................................................ 19

4   Laboratory Design / Setup / Testing ........................................................................................................ 20
    4.1       Control System Test Lab Design .......................................................................................................................... 20
    4.2       Top Level Approach to FAT Control System Testing ................................................................................... 21
    4.3       Control System Testing Overview ........................................................................................................................ 22
    4.4       Grid Technology & Modernization (GT&M) Laboratory Environment ................................................. 22
    4.5       Alhambra QAS – SAT Environment ..................................................................................................................... 24

5   FAT Test Results ............................................................................................................................................. 25
    5.1       FAT: GT&M Lab Test Results................................................................................................................................. 25

6   FAT to QAS Transition ...................................................................................................................................31
    6.1       FAN Radio Integration with Programmable Capacitor Controls ............................................................. 31
    6.2       DESI-2 Energy Storage Simulator Integration ................................................................................................ 33
    6.3       DNP3 Points List ......................................................................................................................................................... 34
    6.4       Volt-Var Optimization Testing in FAT ................................................................................................................ 34

7   QAS Test Results ............................................................................................................................................ 36
    7.1       Live Mode ...................................................................................................................................................................... 36
    7.2       Optimal Power Flow .................................................................................................................................................. 37
    7.3       Virtual Microgrid......................................................................................................................................................... 44

                                                                                             2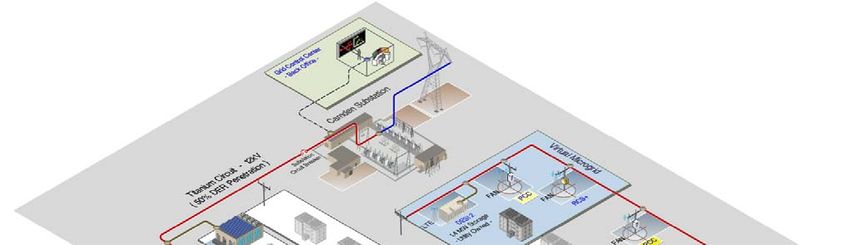
DRP Demonstration D – Final Status Report

     7.4        Power Smoothing....................................................................................................................................................... 46
     7.5        Volt-Var Optimization .............................................................................................................................................. 47
     7.6        Issues and Recommendations............................................................................................................................... 49

8    Measurement and Validation (M&V) ....................................................................................................... 52

9    Technology / Knowledge Transfer ............................................................................................................ 52

10   Appendix ......................................................................................................................................................... 53
     10.1       Demo D Diagrams...................................................................................................................................................... 54
     10.2       Test Execution Material ............................................................................................................................................ 57
     10.3       Test Cases / Procedures ........................................................................................................................................... 58
     10.4       Use Cases....................................................................................................................................................................... 70
     10.5       Metrics Overview ........................................................................................................................................................ 73

                                                                                             3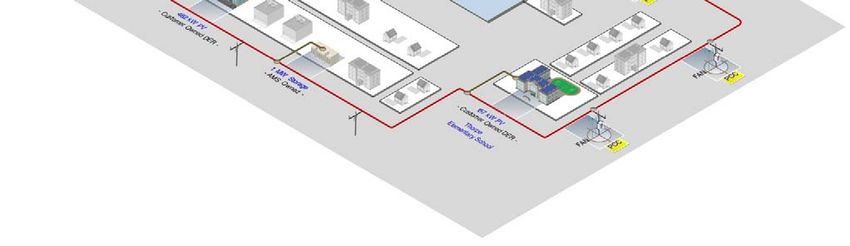
DRP Demonstration D – Final Status Report

Table of Figures

Figure 1:        Demo D and Preferred Resource Pilot (PRP) Demonstration Location ................................................. 16
Figure 2:        Demo D Control System Test Lab Setup ........................................................................................................... 20
Figure 3:        Overall Demo D Test Approach ............................................................................................................................ 21
Figure 4:        Demo D FAT (GT&M Lab Configuration) .......................................................................................................... 23
Figure 5:        Demo D SAT (QAS Configuration) ....................................................................................................................... 24
Figure 6:        2030.5 - Controller HMI Demonstrating DER’s Set points and Measurements ................................. 25
Figure 7:        Release 1 - Controller HMI Demonstrating DER’s Set Points and Measurements ........................... 28
Figure 8:        Forecasted and Metered Load on Titanium Circuit....................................................................................... 29
Figure 9:        Forecasted and Metered Load on Structure #P5497746 ............................................................................ 29
Figure 10: Forecasted and Metered Load on Structure #P5320417 ............................................................................ 29
Figure 11: Energy Storage Dispatching in Live Mode OPF .............................................................................................. 30
Figure 12: SGS Connect Hosted on CISCO IR510 FAN Radio ......................................................................................... 32
Figure 13: PCCs Connection to IR510 FAN Radios during SAT Testing...................................................................... 32
Figure 14: DESI-2 Simulator Setup for QAS ........................................................................................................................... 34
Figure 15: Energy Storage Dispatching in Live Mode OPF for one day ..................................................................... 36
Figure 16: Energy Storage Dispatching Active Power based on Day-Ahead LMP Price ...................................... 37
Figure 17: Planning Engine Managing Requested Current Limit at the Circuit Head........................................... 38
Figure 18: Real-Time Control Engine Responding to Topology Change and Null Voltage ............................... 39
Figure 19: Real-Time Control Engine Responding to Thermal Limit Violation at the Circuit ............................ 40
Figure 20: Thermal Limits Maintained below Set Value (473 A) at the Circuit ........................................................ 41
Figure 21: Real-Time Control Engine Responding to ‘One Minute’ Circuit Fault Scenario ................................ 42
Figure 22: Response of Energy Storage and Circuit Measurements during ‘One Minute’ Fault ...................... 43
Figure 23: Real-Time Control Engine Maintaining near Zero Power Flow at MP20 .............................................. 45
Figure 24: Power Flow and Control Setpoint during Microgrid Motor Starting Test ........................................... 45
Figure 25: Real-Time Control System Managing Circuit Load Profile using Energy Storage ............................ 46
Figure 26: Planning Engine Reducing Voltage along the Titanium Circuit ............................................................... 48
Figure 27: Real-Time Control Engine Unable to Maintain Voltage Limits ................................................................. 49
Figure 28: Demo D Structure Diagram .................................................................................................................................... 54
Figure 29: Top Level Demo D Architecture Diagram ......................................................................................................... 55
Figure 30: Top Level Demo D Layout & Communication Diagram .............................................................................. 56
Figure 31: Sample JIRA Test Tracking Screens (SAT).......................................................................................................... 57
Figure 32: Planning Engine’s Forecasted Result for BESS PS0028 ................................................................................ 59
Figure 33: Current at Bus 17916 Maintained below 300 A .............................................................................................. 60
Figure 34: Titanium Circuit (Single Line Diagram) - iDROP Setpoints at t = 0 ........................................................ 60
Figure 35: Titanium Circuit (Single Line Diagram) - Thermal Limits Violation ......................................................... 61
Figure 36: Titanium Circuit (DMS Screen) – Thermal Limits Violation......................................................................... 62
Figure 37: Titanium Circuit – Output Current and Power Charting .............................................................................. 62

                                                                                     4
DRP Demonstration D – Final Status Report

Figure 38: Titanium Circuit (Single Line Diagram) - iDROP Setpoints at t = 1 min .............................................. 64
Figure 39: Titanium Circuit – 50hp motor impact on power flow at t = 5 min ....................................................... 65
Figure 40: Titanium Circuit (Single Line Diagram) – iDROP Setpoints at t = 5 min ............................................... 65
Figure 41: Titanium Circuit (Single Line Diagram) – iDROP Setpoint at t = 6 min ................................................. 66
Figure 42: Titanium Circuit - 50hp motor impact on power flow at t = 6 min ........................................................ 67
Figure 43: SAT Testing – Example Test Procedure (TC 02-4) .......................................................................................... 68
Figure 44: SAT Testing – Example Test Procedure (TC 17) .............................................................................................. 69
Figure 45: Demo D Metric Status (Table 1 of 2)................................................................................................................... 73
Figure 46: Demo D Metric Status (Table 2 of 2)................................................................................................................... 74

                                                                                 5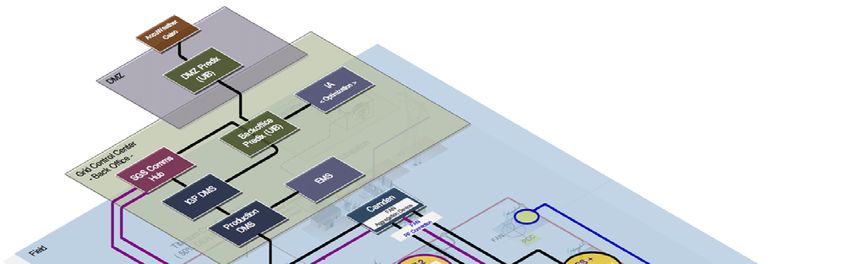
DRP Demonstration D – Final Status Report
1 Executive Summary
1.1 Introduction
Consistent with Decision (D.)17-02-007, SCE is providing the following report for Distribution
Resource Plan Demonstration D (Demo D), and includes a summary of learnings relating to
project planning, control software design/implementation, and laboratory testing of these
controls using a real-time simulator.1
SCE’s DRP Demo D project was designed to develop, test and demonstrate a system that could
monitor and operate multiple DERs under various ownership and control arrangements
(including SCE-owned, customer-owned, aggregator-managed and third-party-owned) and how
the distribution system can be managed with high penetrations of DERs.2
The value and learnings SCE has obtained from Demo D tasks are significant, as they include the
design, development and testing of new control and communication systems for the grid and
their first-time integration into SCE’s existing supervisory control and data acquisition system
(SCADA).3
The output from these activities could improve SCE’s capability to more accurately assess how
high penetration of DERs will influence distribution planning operations. For example, these
learnings are helping SCE move forward with the new Grid Management System (GMS) that
enables management of the electrical system with high penetrations of distributed energy
resources.4
SCE has determined that Demo D cannot not be completed because actual field testing cannot
be performed due to the following cybersecurity challenges:
As SCE designed the solutions for the EPIC Integrated Grid Project (IGP) / Demo D - including
the associated DRP demonstration projects, SCE conducted periodic cyber security
assessments to ensure our solutions do not create greater cybersecurity expose our
production grid systems. The threat environment these demonstration projects are slated to
operate in has evolved, necessitating additional cybersecurity controls. As such, in order to
protect grid systems and deploy field demonstrations that are secure, SCE concluded that it
must delay deployment until it can integrate and deploy the appropriate cybersecurity
controls with the demonstration technologies to minimize the risks to our grid production
systems. This delay is estimated to prevent deployment until at least 2021.
1
D.17‐02‐007, at Ordering Paragraph No. 9 (“Southern California Edison Company’s Demonstration Project D is approved.”); R.14‐08‐013,
COMMENTS OF SOUTHERN CALIFORNIA EDISON COMPANY (U 338‐E) PROPOSING DEMONSTRATION PROJECTS, filed June 17, 2016, at p. 32‐33
(“To keep the Commission informed on the progress of Demonstration D, SCE proposes to submit an annual status report depicting all the
achievements, issues, budget, and schedule updates. . . . SCE also proposes to submit a final report … [which] will outline the project, findings,
and lessons learned.”).
2
D.17‐02‐007 at p. 11 (“Demonstrate Distribution Operations and High Penetrations of DERs. This project calls for the utilities to integrate high
penetrations of DER into their distribution planning operations. The utilities must: a) assess locational benefits and values of DER at the
substation level using ICA and LNBA across multiple circuits; b) demonstrate the operations of multiple DER in concert; c) coordinate operations
with third parties and customers; d) develop and explain the methodology for selection of DER types used in the project; and e) utilize both
third‐party‐owned and utility‐owned resources.”) (Quoting Scoping Memo).
3
A complete list of the key lessons learned for this demonstration project is presented in Section 1.5.
4
Demo D learnings will also inform the development of DER control systems, communications protocols, cybersecurity, Field Area
Network (FAN) communications, and methods to work with customers and aggregators.
6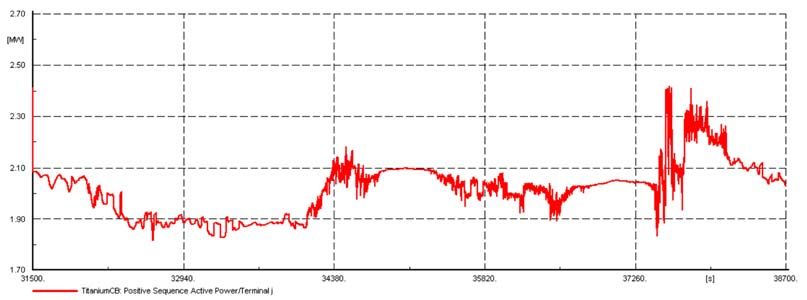
DRP Demonstration D – Final Status Report
Following the identification of this security issue, the Demo D project team worked
extensively with the teams from SCE’s Information Technology (IT) organization and
particularly with SCE’s Cybersecurity organization to identify alternative approaches and
architectures that would enable SCE to conduct the field demonstration activities without
waiting until the new recommended security tools were in place.
The Transmission and Distribution (T&D) team met with key SCE stakeholders to determine
an appropriate decision on how to proceed with Demo D and meet the DRP objectives and
perform a Field Demonstration.
Following this analysis, SCE concluded, that Demo D should be concluded at the end of the
current System Acceptance Testing (SAT) testing period. This decision was based on the
anticipated length of the cybersecurity delay and the substantial learnings already achieved
from the program.
Because SCE is not completing field testing, this demonstration will not provide additional
learnings regarding operational activities. But this operational experience can now be gained
during the testing phase of SCE’s GMS project.
1.2 Demo D Project Objectives and Overview
This project called for SCE to determine how to plan, design and deploy the next generation
grid infrastructure capable of enabling advanced operational functions such as bi-directional
power flow, thereby allowing for higher penetrations of distributed energy resources (DERs).
These DER would include DER under various ownership and control arrangements (including
SCE-owned, customer-owned, aggregator-managed and third party-owned). Specifically, high
penetrations for this project was developed to demonstrate reliable operation of the grid with
DER penetration levels in excess of 15%.
The output from the following activities would improve SCE’s capability to more accurately
assess how high penetration of DERs will influence distribution planning and investments:
a) Assess locational benefits and values of DER at the substation level using ICA and LNBA
across multiple circuits;
b) Demonstrate the operations of multiple DER in concert;
c) Coordinate operations with third parties and customers;
d) Develop and explain the methodology for selection of DER types used in the project; and
e) Utilize both third-party-owned and utility-owned resources.
7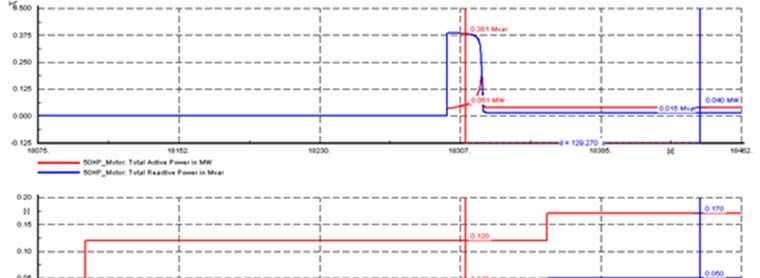
DRP Demonstration D – Final Status Report
The results of Demonstration Project D would inform SCE, the Commission, and stakeholders on
alternatives for operational processes, control systems and integration equipment to safely and
reliably manage high penetration circuits on the distribution grid.
More specifically, this demonstration project would provide knowledge, experience and
requirements to develop the following capabilities:
Develop the next generation of distribution grid control systems and algorithms.
Monitor and validate the DER performance for voltage and power flow control.
Improve methods for gathering DER field data and properly displaying it to grid operators.
Standardize the interface requirements between third party DER resources and the utility’s
operating systems.
Ultimately, Demo D would inform the industry grid standardization processes as well as inform
selection of future distribution grid upgrades needed to provide safe, reliable, and affordable
service to SCE’s customers. Demo D would also demonstrate the back office and cybersecurity
systems needed to manage large penetrations of DER in a scalable manner.
1.3 Level of Completion of Key Activities
Below, SCE lists key activities that were identified to accomplish the objectives, listed above in
Section 1.2, and the level of completion that was accomplished for each.
Provide a demonstration test bed for systems, equipment, and concepts for future
modernization efforts.
Level of Completion:
Assembled a demonstration test bed which allowed laboratory testing as well as testing
with production SCE systems in the Alhambra Control Center Quality Assurance System
(QAS). The control systems were not demonstrated in the field.
Verify technology readiness and potential architectures for production systems such as GMS
and Distributed Energy Resource Management System (DERMS).
Level of Completion:
Verified the system architecture and technology readiness via testing through SAT in the
QAS environment. The control system architecture was not verified in the field.
Test new communications technologies and standards such as the Field Area Network (FAN)
radio communications system and the IEEE 2030.5 standard for communications to
aggregators for smart inverters.
Level of Completion:
Tested new FAN communication technologies, and their integration, via laboratory and
production system testing in the SAT / QAS environment. These systems were not verified
in the field.
8DRP Demonstration D – Final Status Report
1.4 Key Accomplishments
Demo D contributed learnings to various distribution planning operations tools and
technologies as follows:
Grid Management System (GMS)
GMS utilized Demo D learnings for GMS DERMS development and associated supplier
selection
GMS utilized certain Demo D use cases as a foundation for the development of selected GMS
use cases
The Demo D Operational Service Bus (OSB) served as a demonstration of an efficient
architecture for the GMS, allowing the management of interfaces between multiple
applications.
GMS utilized Demo D requirements as a starting point for the requirements gathering
exercise for control systems and related architectures, FAN requirements, and communication
with 3rd parties.
Factory Acceptance Testing (FAT)/ Laboratory Testing
Designed and tested an IEEE 2030.5 implementation with controllers that met SCE
cybersecurity requirements
Designed and tested an IEEE 2030.5 implementation with controllers to be used by a DERMS
Successfully evaluated the use of the IEEE 2030.5 standard for end-to-end communications
and control of new smart inverter capabilities as defined by the Common Smart Inverter
Profile (CSIP) and demonstrated integration with SCE’s back office systems (as part of SAT).
Tested volt/VAR and power flow optimizations for high penetrations of DERs. This activity
assisted the development of the request for proposal requirements for the Advanced
Distribution Management System (ADMS)
Assessed and tested control application integration through an OSB architecture
Completed the development of detailed Interface Service Definitions for the GE Predix OSB,
which are now reusable for the DERMS and ADMS implementations
Assessment of field messaging bus technologies and their practical maturity level
Demonstration of Agile methodologies and their benefits for DERMS and ADMS
implementations through the laboratory and FAT testing
9DRP Demonstration D – Final Status Report
Site Acceptance Testing (SAT)
Connected an IP based device to the lab copy of the production distribution management
system (DMS); findings informed connection of the first IP based devices (battery energy
storage systems) to the production DMS.
Integrated and tested the DESI-2 battery system simulator with the control system in
QAS/SAT; lessons learned are now informing the Energy Storage Integration Program (ESIP)
measurement and validation (M&V) testing.
Integrated and tested IntelliCAP Plus (serial based programmable capacitor controller) and
IntelliCAP 2000 (Ethernet based programmable capacitor controller) with the control system
using the FAN network’s edge computing capability.
Identified bugs informed hardening of FAN application hardware/software
Identified process improvement and training needs
Improved requirements and documentation for the future FAN work
Successfully ran the control system 24/7 for two weeks in the QAS test environment
(Alhambra).
Developed a hardware and software-in-loop test bed that can now be utilized for testing of
GMS/DERMS production applications
Field Area Network
Assisted the development and integration of the new FAN technical design and specifications
Assisted the development of detailed system requirements for the FAN RFP
Conducted FAN vendor product assessment in SCE’s Grid Technology & Modernization
(GT&M) lab and in the QAS environment
Implemented new comprehensive FAN testing equipment setup and procedures in GT&M lab
Completed a radio frequency model for the FAN radios derived using automated testing
processes
Integrated the new FAN with the Common Substation Platform (CSP)
Designed and delivered an IPv4/IPv6 dual stack solution that increased flexibility of the FAN
solution and integration with SCE back-office software applications (e.g. ADMS)
Enabled a FAN testing platform for DERMS and ADMS by integrating the new FAN into back-
office systems including common shared and security services
Documented new business process flows needed for FAN field deployment
Developed an edge compute implementation in the FAN radios for cap controllers
Discovered and corrected errors with the FAN radio’s internal network address translation
(NGT&M) functionality preventing communication between the FAN network and IP based
devices
10DRP Demonstration D – Final Status Report
Other Accomplishments
Identified the demonstration site for the DESI-2 utility-owned storage system on the test
circuit
Developed system requirements and completed the system design for high penetration DER
control systems
Developed a high-level integration path for aggregators of DERs using IEEE 2030.5
Integrated the distributed control systems with the DMS through the integration platform in
the lab setting
Assembled a laboratory test environment based on the DigSILENT PowerFactory simulation
system to allow more comprehensive testing of the control systems
Completed FAT testing in the GT&M lab and SAT testing in the QAS environment of the
control systems and the OSB. This activity included system and integration testing with four
FAN radios and lab-based edge devices
1.5 Key Lessons Learned
The learnings from Demo D are being used by SCE to provide the requirements for future grid
modernization investments and activities. For example, while conducting a major system
upgrade (such as Grid Modernization), it is critical that early in the process new technologies,
and their integration, are thoroughly tested to confirm architecture assumptions and technical
requirements. Demo D conducted this early stage testing, including the development of DER
control systems, communications protocols, cybersecurity, FAN communications, and methods
to work with customers and aggregators.
Ultimately, the Demo D learnings provide a smoother, better-defined transition to a smarter
grid that can operate reliably and safely with high penetrations of DERs. These lessons will
continue to inform future modernization efforts.
A complete list of the lessons learned for this demonstration project is presented below:
General
DERMS is needed in the future to optimally manage and dispatch DERs to provide grid
services, facilitate non-wires alternatives, and enable DERs to participate in markets when not
needed for grid services.
DERMS provides capabilities that current utility DMS does not provide. A DERMS-like system
is also required to complete the Distribution Resource Plan Demonstration projects (Demos C,
D, and E), as these projects require control and dispatch of DERs to realize net locational
benefits, circuit optimization, and microgrid controls.
Significant difficulties recruiting customers with DERs to help demonstrate grid reliability
services point to problems with the programs used to incentivize customers to cooperate
Proposed programs to use customer DERs for grid services can conflict with their existing
warranty provisions, energy production contracts, and demand charge reduction goals
11DRP Demonstration D – Final Status Report
Behind the meter (BTM) DER resources will be extremely valuable to the reliability of the
future grid
Individual, not aggregated, DER measurements are critical to modeling grid behavior and
providing better situational awareness to grid operators
Constraint management on distribution circuits can be implemented by both charging and
discharging of battery systems
Field Area Network
FAN radio technology can provide higher speed communications that enables quicker, and
potentially automatic, response to an outage which reduces restoration times
Results from lab testing of various FAN vendors has established which criteria are most
important in selecting a final FAN vendor
The FAN radios are IP based and contain edge computing capabilities that allow control
actions to take place locally, avoiding the need and delay for messages to go all the way to
the Alhambra Grid Control Center and back to a device
The FAN radios currently do not support the required communication for high speed generic
object oriented substation event (GOOSE) communication (part of the IEC 61850 standard)
The GOOSE testing experience demonstrates the routable-GOOSE testing effort will take
longer than originally forecasted
To successfully prepare future IP based devices for the FAN system, IT needs to finalize
system architect well in advance of the required operational date
Cybersecurity
Cybersecurity threats are continually changing and thus pose significant challenges in regard
to determining preventative tools and the timing associated with developing and validating
them
Cybersecurity challenges with IEEE 2030.5 protocol, caused by interfacing Internet
communications with SCE grid control systems, has been difficult to resolve
The project team needed to get cybersecurity input to system design in the earliest phases of
the project to mitigate downstream delays
IEEE 2030.5
The IEEE 2030.5 communications protocol is in the early stages of implementation in the
industry
Aggregators have had a difficult time implementing the IEEE 2030.5 standard due to the
limited number of suppliers who have full protocol support packages available at this time
12DRP Demonstration D – Final Status Report
Piloting
Lab testing in an environment that mirrors production provides valuable insight to validate
capabilities on the distribution system
A lab development environment provides the following key benefits:
Allows testing of multiple applications, hardware configurations and communications
infrastructure
Allows testing of both centralized and distributed controls, optimization routines, and
simulation of hypothetical DER adoption or load growth scenarios
Hardware-in-the-loop testing allows the utility to gain confidence in the outcome of
deploying advanced control schemes into production
Lab testing has demonstrated that it may be viable to establish “temporary” microgrids with
DER to support isolated load, which likely requires in front of the meter energy storage
devices and a change in existing tariffs
Customer Participation
Signing up DER resources as only demand response resources limits the scope of services
available for grid management
Need tariffs or standard contracts for customers to provide services from their DERs
The primary challenge in effectively obtaining customer participation is creating clearly
defined measurable incentives and contract protections for them
A significant issue with customer participation is that existing DER customers do not have the
ability to change their existing tariffs or contract terms. In addition, DER service contracts
need to be structured to allow resource dispatch both at an individual and utility defined
group levels and not define DER services to a specific circuit, as distribution grid topology is
highly dynamic.
Technology Architecture
The current state of the industry for publish and subscribe services is immature and should be
introduced in a phased approach. An OSB should be confined to the back office and not
pushed down to the edge at this time.
The concept of a field message bus is in its infancy and not ready for prime time.
Forecasting and dispatching strategies require individual, not aggregated measurements.
Implementation of the IEEE 2030.5 protocol introduces security threats that require a new
network architecture and cyber tools to isolate communications.
13DRP Demonstration D – Final Status Report
Overall Project Lessons Learned
Lab testing with a real-time simulation approach allows examination of a broad range of
conditions before field deployment
Edge computing capability in the FAN field device is vital to allowing network adaptability
and future implementation of new applications and capabilities
Integration of multiple applications through the OSB is key to easing future integration
efforts, but needs to mature for production deployments
Recruiting customers for the demonstration requires establishing value for their
efforts/equipment use
Software vendors need to improve the user Human Machine Interface (HMI) for a better user
experience, situation awareness, and control capabilities
Vendors need to develop the capability for auto-discovery and auto-registration of field
devices
Control system vendors use various versions of system software (operating system, databases,
etc..) that are not easily portable to SCE's standard software and operating systems
1.6 Challenges Encountered
The following provides a summary of the critical challenges encountered:
The requirement to develop and integrate technologies that were new and previously
unproven resulted in an extremely challenging efforts. This included the following:
A stable communication path between the Demo D controllers and the Operational
Service Bus
A stable communication path between the Demo D controllers and the new FAN radio
The recruitment of DER customers utilizing current incentive programs was very difficult and
yielded significantly less sign ups than anticipated
The ability to maintain a stable and consistent schedule due to the following:
Anticipating and managing the significant technical challenges mentioned above
Estimating the timing to for approval and set up of test environments for brand new
technologies within SCE
The degree of new cyber threats and their impact on project progress via the need for and
timing of new technologies and their respective test environments (Please see prior
discussion concerning cybersecurity challenges in Section 1.1).
1.7 Funding
The Demonstration D project is part of the Integrated Grid Project which utilizes EPIC funding.
There was no incremental funding requested for non-procurement expenses under the
Distribution Resource Plan Track 2 proceeding, which is consistent with the approval obtained in
CPUC Decision 17-02-007, dated February 9, 2017.
14DRP Demonstration D – Final Status Report
2 Project Summary
2.1 Objectives
SCE’s Demonstration D project primary goal was to analyze the potential benefits and locational
values associated with high penetration DER at the substation level for up to five circuits, to
serve as a prototype model that is scalable upon completion.
To accomplish this, the project pursued to explicitly demonstrate the operations of multiple
DERs in concert with customers and third-party owners, operators or aggregators. Thus, a
central part of this project was to monitor and control resources under various ownership and
control arrangements, including SCE-owned resources, customer-owned resources, aggregator-
managed resources, and third party-owned resources.
The field portion of the project was intended to be in the Santa Ana/ Costa Mesa portion of
Orange County (see Section 2.4) and aimed to control DER owned by SCE, customers, and third-
party aggregators in a coordinated manner.
2.2 Scope
To achieve the stated goals for Demo D, the following tasks were pursued to demonstrate
distribution operations of high penetration DERs:
Assess the locational benefits and values of DERs at the substation level using the established
ICA and LNBA for up to five circuits.
In collaboration with third party owners, operators or aggregators, construct a DER portfolio
and the associated control system. This portfolio will include existing DER resources in the
area as well as new resources being installed.
Once deployed, the DERs will operate in concert with each other and with existing
infrastructure to demonstrate operation of multiple DERs. These operations will show how
DERs can be used for volt/VAR optimization and power flow optimization. In addition,
systems will be put in place to improve DER visualization for grid system operators. - 20 –
The impacted region will be analyzed before and after DER deployment to validate the DERs’
ability to achieve the previously identified net benefits.
2.3 Project Approval
SCE DRP Demonstration D was approved by CPUC Decision 17-02-007, dated February 9, 2017.
15DRP Demonstration D – Final Status Report
2.4 Demo D Location
Determining the Demo D location took several key considerations into account. Key criteria
included the system topology, the ability to install field equipment, meeting the DRP
Demonstration requirements, but most importantly, enough existing and planned PV and
storage installations to qualify as high penetration of DER.
The location, as proposed by SCE and approved in D.17-02-007, was a combination of the
adjacent Camden and Johanna Jr substations (Figure 1.).
These systems consisted of a mix of overhead and underground circuits with both residential
and commercial customers. In addition, the Camden substation area offered several large PV
installations already in place with more installations under way to help meet the definition of
high penetration of DER.
Demo D PRP
Camden Substation
Johanna Junior Substation
Figure 1: Demo D and Preferred Resource Pilot (PRP) Demonstration Location
16DRP Demonstration D – Final Status Report
3 System Design
3.1 Approach
In order to fulfill Demo D’s objectives and accommodate its requirements, a hybrid design
approach was adopted that combined existing systems and assets already in production with a
set of new systems and assets.
Examples of existing systems and assets included the XA-21 DMS, the NetComm radio
network, and edge devices such as Remote Fault Indicators (RFI), and Remote Integrated
Switches (RIS) already configured for operation over the existing NetComm radio network.
Examples of the new Demo D systems and assets included optimization and control
applications, the OSB, the CSP, the new FAN, and the set of edge devices that will be
configured for operation over the new FAN.
The design approach intended to leverage SCE’s various test facilities to test each Demo D
element in a controlled lab environment prior to field deployment.
The completed system design was documented and communicated through a series of design
artifacts, including a Systems Requirements Document (SRD), a System Design Document (SDD),
a System Interface Catalog, and eight individual service design interface documents.
3.2 System Requirements / Use Cases
Requirements Definition
The SRD provided the business context for the project, a high-level system description, and
listed the system requirements obtained from the Demo D use cases. The requirements were
divided into five logical categories: general, communications, control, security, and
integration.
Use Cases
Use cases were assembled to help determine how the control systems would operate and to
derive the functional and non-functional requirements for the system design. A short
summary of each of the applicable Demo D use cases is included in the following section with
more detailed descriptions found in Appendix 10.4.
Use Case 2-1: Voltage Optimization with DER
The substation-level volt/VAR optimization (VVO) controller optimizes circuit voltage
using capacitors and DERs (generation and storage devices) equipped with smart
inverters. The Demo D/ Integrated Grid Project (IGP) control application optimizes circuit
voltage by lowering and flattening the voltage profile along the circuit so it remains in
the lower portion of the 114 to 120 volt range for commercial and residential customers.
17DRP Demonstration D – Final Status Report
Use Case 3-3: DERs Managed to Shape Circuit Load
At the circuit level, the Demo D/ IGP control system and its Optimal Power Flow (OPF)
controller optimizes loads, generation, and storage to shape the load to meet
operational requirements at any given time. The OPF controller maintains circuit
demand below a user defined threshold and minimizes circuit operating cost.
Use Case 4-1: Microgrid Control for Virtual Islanding
A microgrid controller uses control of loads, generation and storage to reduce real and
reactive power flows to zero at a specified reference point on a distribution circuit for a
pre-determined period.
3.3 Design Considerations
The scope of Demo D presented sizable complexities and potential operational risks for the
intended field deployment. As such, key design decisions were undertaken to mitigate such risks
and minimize integration complexities during the planned implementation.
Based on lessons learned from the Irvine Smart Grid Demonstration (ISGD), the setup and
operational maintenance of a separate pilot-production environment for Demo D was deemed
too burdensome on SCE’s grid operations. As such, the new Demo D systems were integrated
into existing systems and assets wherever possible. Notable examples of these production assets
include DMS and common/shared enterprise cybersecurity services such as Active Directory, RSA,
and Radius.
Known that Demo D was intended only as a demonstration, the Demo D systems did not require
redundancy. Therefore, the design is such that, if all the new Demo D systems were to go offline
or become unavailable, the normal existing production operations would be unaffected. The
result is that, in the event of failure, Grid Operations would see the same conditions they have
known and managed prior to the introduction of the new Demo D components.
Given the lack of experience with such control operations, the Demo D design provided the ability
to maintain operational safety using a battery energy storage system disconnect switch controlled
over an alternate communication channel. This capability would provide grid operators the ability
to override the testing environment, should a need arise. Grid operators could disable all
automated functions introduced by the new Demo D applications.
18DRP Demonstration D – Final Status Report
3.4 Cybersecurity
The overarching goal of the cybersecurity requirements for Demo D was to demonstrate an end-
to-end cybersecurity system. These cybersecurity measures utilized industry standards as much
as possible (e.g. IEEE C37-240, IEEE 1686, IEC 62351, IEC 61850 90-5). To accomplish these goals,
nine cybersecurity measures were investigated and/or tested as part of the laboratory phase of
Demo D. These measures included:
Advanced application-level firewalls
Multi-factor authentication for user access
Centralized system log collection and aggregation from applications and devices
Application whitelisting
Application password vault
Vulnerability scanning
Web application firewall to link SCE control systems to third party DER partners over the
Internet
Public key encryption services
Network access control, visibility, and system profiling capabilities
A cybersecurity risk assessment was performed on Demo D technologies in the lab test
environment. This assessment was repeated as the control systems moved into the SCE QAS test
environment. These efforts have helped resolve issues relating to the proper application of
cybersecurity requirements and what methods were needed to securely interact with DER
aggregators over the internet. This testing has helped lay the groundwork and expose additional
requirements for implementation of cybersecurity tools for SCE’s grid modernization applications.
As addressed earlier in this report, they cyber delay that prevented field testing is formally
described as follows:
As SCE designed the solutions for the EPIC Integrated Grid Project (IGP) / Demo D - including
the associated DRP demonstration projects, SCE conducted periodic cyber security
assessments to ensure our solutions do not create greater cybersecurity expose our
production grid systems. The threat environment these demonstration projects are slated to
operate in has evolved necessitating additional cybersecurity controls. As such, in order to
protect grid systems and deploy field demonstrations that are secure, SCE concluded that it
cannot complete deployment until it can integrate and deploy the appropriate cybersecurity
controls with the demonstration technologies to minimize the risks to grid production
systems.
19DRP Demonstration D – Final Status Report
4 Laboratory Design / Setup / Testing
4.1 Control System Test Lab Design
Demo D used the Grid Technology & Modernization (GT&M) Laboratory and Alhambra QAS
testing environment to validate functionality and performance capabilities of the control
systems prior to intended field deployment. The benefits of this approach were that testing was
performed in a controlled environment without adversely affecting the service provided to
customers (e.g., creating actual faults on a circuit for testing is not permissible given the
presence of customers).
Demo D systems were tested utilizing the following:
(1) Substation Automation Laboratory (for CSP),
(2) Distribution Automation Laboratory (for field automation devices),
(3) Control Systems Laboratory (for simulation testing of the controls software),
(4) Computing Laboratory (for back-office system support), and
(5) Grid Edge Solutions Laboratory (for FAN performance and interface to DER and automation
devices).
The testing setup is depicted in Figure 2 below.
Control
Real-Time Network Model
Operational Service Bus
Optimization Substation Telemetry
Distribution Management System Large DER
External Input Data Non‐DER Devices
(Weather, LMP, etc.)
Smart Meter Data Aggregated DER
Figure 2: Demo D Control System Test Lab Setup
20DRP Demonstration D – Final Status Report
4.2 Top Level Approach to FAT Control System Testing
Demo D testing was divided into several stages as illustrated in Figure 3. Initial unit testing of
the system components was conducted at both the GT&M and vendor labs and was focused on
isolated testing of the integration bus, control applications, edge computing platform, and the
FAN.
Once these tests were successful, the testing moved to the system integration testing at the
GT&M labs. In these tests, all components were assembled as a functional system and tests of
the exchange of data between the components was conducted.
Once the controls team was satisfied that the applications were working properly and controls
were being properly executed in the GT&M lab environment, all software systems were
transferred to the SCE QAS environment for SAT. This environment is setup just like the formal
production environment, but is isolated so the actual production system is not disturbed.
Figure 3: Overall Demo D Test Approach
21DRP Demonstration D – Final Status Report
4.3 Control System Testing Overview
Testing was performed to ensure/determine the following:
Show hardware and software operates according to Demo D and manufacturer specifications.
Verify field devices could be monitored and controlled by remote command through the
control systems.
Determine if the controller is capable of controlling capacitors and DER to meet circuit
voltage requirements.
Determine if the controller is capable of controlling DER to optimize real/reactive power flow.
Verify the precision and stability of the real and reactive power control over a range of
durations and settings.
Measure the response speed of the control system.
Determine the DESI 2 battery system’s reaction to grid events and control system limits.
Verify that DER status can be communicated to the DMS and displayed to the operator.
Demo D tested the Optimal Power Flow, Volt/VAR optimization and Microgrid applications
using a controller-in-the-loop test environment.
This test environment used a simulation system to dynamically model circuit conditions as well
as simulate dispatch of real and reactive power at multiple resource locations within the
modeled distribution substation and its circuits.
The test bed implemented a detailed distribution system model of SCE’s Camden substation and
two of its circuits (Titanium and Aluminum). This model included cables, conductors, switches,
capacitors, and realistic PV and energy storage functionality. The control applications and
integration bus then interacted with the modeling environment in real-time to investigate their
performance.
4.4 Grid Technology & Modernization (GT&M) Laboratory Environment
The laboratory test setup utilized the DigSilent’s PowerFactory RMS real-time simulation
platform to perform circuit, substation, and DER device modeling in real-time. This modeling
environment was then connected to the OSB, the DMS, and the IGP optimization and control
applications being tested.
The controller was comprised of a planning engine and a real-time control engine. The planning
engine provided day-ahead optimization results (DER control commands and set-points in 15-
minute intervals) based on load and generation forecasts, weather, ISO price data, network
topology, and business rules. The real-time control engine performed autonomous deterministic
control of grid edge devices (such as capacitors and DERs) to support and maintain circuit
operational constraints.
The decentralized edge compute application was hosted on BeagleBones. The control system
monitored circuit conditions and dispatched controls both centrally and locally to ensure the
circuit operated in its desired operating range. Other external data sources (weather data,
22You can also read