INVESTIGATION OF LEAKAGE CONTRIBUTION FROM DIFFERENT AIR SEAL COMPONENTS - DIVA
←
→
Page content transcription
If your browser does not render page correctly, please read the page content below
DEGREE PROJECT IN MECHANICAL ENGINEERING, SECOND
CYCLE, 30 CREDITS
STOCKHOLM, SWEDEN 2019

Investigation of leakage
contribution from different air seal
components

AUÐUR GUÐJÓNSDÓTTIR

BENEDIKT ÁRNI HARÐARSON

 KTH ROYAL INSTITUTE OF TECHNOLOGY
 SCHOOL OF INDUSTRIAL ENGINEERING AND MANAGEMENT

Examensarbete TRITA-ITM-EX 2019:565

 Undersökning av läckagebidrad från olika
 lufttätningskomponenter

 Auður Guðjónsdóttir
 Benedikt Árni Harðarson
Godkänt Examinator Handledare
2019-08-28 Ulf Sellgren Ulf Olofsson
 Uppdragsgivare Kontaktperson
 Öhlins Racing AB Pontus Andersson

Sammanfattning
Mountainbike är en sport där utövare åker på stigar med varierande lutning och svårighet.
Terrängcyklar är generellt utrustade med stötdämpare eller fjädrar på framhjulet och ofta också på
bakhjulet. Vissa terrängcyklar har stötdämpare bak som använder trycksatt luft för att dämpa istället
för att använda traditionella stålfjädrar. Luften är sluten inuti stötdämparen med hjälp av X-rings
tätningar, vilket ger en fjäderkraft på hjulet. Det är viktigt att tätningen fungerar så att luftfjädern
inte snabbt tappar trycket när den används. En experimentplan skapades i ett försök att uppskatta
effekten av tätningsdimension, smörjning och ytjämnhet på luftläckage för mer robusta
stötdämpare. Accelererade tester gjordes i en dynamometer, som troddes kunna skapa signifikant
slitage på en stötdämpares tätning inom 24 timmar upprepade gånger. 19 test gjordes med en körtid
på upp till 72 timmar med variation av testparametrar som slaglängd och frekvens. De förväntade
felkällorna uppstod inte i något av testerna. 11 tester visade inga tecken på fel medan 8 tester
misslyckades på grund av att oväntade komponenter slets ut eller gick sönder. Stötdämparens
huvudtätning visade sig slitas fortare än lufttätningen, vilket resulterade i läckage inuti luftfjädern
mellan dess positiva och negativa kammare. Detta oförutsedda fel behöver vidare undersökning
med tester på fler olika typer av stötdämpare.

Nyckelord: Terrängcykel, luftfjäder, luftläckage, robust konstruktion, tätningsslitage.

 3
4

Master of Science Thesis TRITA-ITM-EX 2019:565

 Investigation of leakage contribution from different air
 seal components

 Auður Guðjónsdóttir
 Benedikt Árni Harðarson
Approved Examiner Supervisor
2019-08-28 Ulf Sellgren Ulf Olofsson
 Commissioner Contact person
 Öhlins Racing AB Pontus Andersson

Abstract
Mountain biking is a sport where riders bike on trails, varying in slope and difficulty. Mountain
bikes are generally equipped with suspension on the front wheel and often also on the rear. Some
types of rear shocks use pressurized air for a spring action instead of the traditional metal coil. Air
is sealed inside the shock’s air can by means of X-ring seals, providing a spring force on the wheel.
It is of great importance that the sealing system performs as intended so the air spring does not
quickly lose pressure during use. An experimental plan is conducted in an attempt to estimate the
effects of seal dimension, lubrication and surface roughness on air leakage for more robust shocks.
Accelerated tests were performed in a dynamometer, believed to repeatedly cause significant wear
on the shock’s air seal within 24 hours. Nineteen tests were carried out, for a duration up to 72
hours, with variations to test parameters such as stroke length and frequency. The expected failure
modes did not occur in any of them. Eleven tests showed no signs of failure while the other eight
failed due to unexpected components breaking or wearing out. The shock’s main seal was found to
wear out faster than the air seal, causing leakage within the air spring, between its positive and
negative air chambers. This unforeseen failure needs further examination with tests conducted on
more shock types.

Keywords: Mountain bike, air spring, air leakage, robust design, seal wear.

 5
6
FOREWORD
This report is a part of the course MF223X at KTH Royal Institute of Technology. The project is a
master thesis project within the department of Machine Design and was conducted in collaboration
with Öhlins Racing AB during the spring semester of 2019.

We would like to thank our supervisor at KTH, Ulf Olofsson, for his guidance and endless support
as well as sharing his insights throughout the project.

We would like to thank Martin Forsberg for the opportunity to do this project. We are grateful for
the help and support we received from the entire MTB department; Pontus Andersson, Erik
Walterson, Pär Åslund, Erik Nordgren, Daniel Bax, Johan Jarl, Andreas Pettersson and Rickard
Norstedt.

Furthermore, we would like to thank Mathias Raine for his help with our tests as well as Ali Hobbi
and Hanna Rylander Ericsson for their assistance with our measurements.

Lastly, we want to thank Andreas Bolin for his endless help and patience with our test plan and
setup.

 “I have not failed.
 I’ve just found 10,000 ways that won’t work.”

 - Thomas A. Edison

 7
8
NOMENCLATURE

Notations
Symbol Description
x̅ Mean value
σx̅ Standard error of the mean
N Sample size
σ Standard deviation of a population
μ Mean value of a population
s Sample standard deviation
Var(X) Variance of X
Φ(x) Normal distribution’s CDF
S Sample skewness
K Excess kurtosis
Cpk Process capability index
id Inner diameter [mm]
t Thickness [mm]

Abbreviations

XC Cross country
MTB Mountain bike
SEM Standard error of the mean
PDF Probability density function
CDF Cumulative density function
SES Standard error of skewness
SEK Standard error of kurtosis
RSS Root sum square
USL Upper specification level
LSL Lower specification level

 9
10
TABLE OF CONTENTS
FOREWORD .................................................................................................................................. 7
NOMENCLATURE ....................................................................................................................... 9
TABLE OF CONTENTS ............................................................................................................. 11
LIST OF FIGURES ...................................................................................................................... 13
LIST OF TABLES ........................................................................................................................ 14
1 INTRODUCTION .................................................................................................................... 15
 1.1 Background........................................................................................................................... 15
 1.2 Purpose ................................................................................................................................. 17
 1.3 Delimitations ........................................................................................................................ 17
 1.4 Methodology......................................................................................................................... 18
2 FRAME OF REFERENCE ..................................................................................................... 19
 2.1 MTB air shocks .................................................................................................................... 19
 2.1.1 Function and main components ..................................................................................... 19
 2.1.2 Shock design .................................................................................................................. 20
 2.1.3 Test methods .................................................................................................................. 21
 2.2 X-ring seals ........................................................................................................................... 22
 2.3 Probability and statistics ....................................................................................................... 24
 2.3.1 Fundamental concepts ................................................................................................... 24
 2.3.2 Normal distribution ....................................................................................................... 25
 2.3.3 Skewness and kurtosis ................................................................................................... 26
 2.3.4 Process capability index ................................................................................................ 27
 2.4 Surface topography ............................................................................................................... 28
 2.5 Robust design ....................................................................................................................... 33
 2.5.1 Objective........................................................................................................................ 33
 2.5.2 The Taguchi method ...................................................................................................... 33
 2.5.2 Design of experiments ................................................................................................... 35
 2.6 Tolerance analysis ................................................................................................................ 37
3 METHOD .................................................................................................................................. 39
 3.1 Design of experiments .......................................................................................................... 39
 3.2. Test sample preparation ....................................................................................................... 40
 3.2.1 Air shock components ................................................................................................... 40
 3.2.2 Lubrication .................................................................................................................... 40
 3.2.3 Air seal diameter............................................................................................................ 41
 3.2.4 Cylinder tube surface roughness ................................................................................... 44
 3.3 Experiments .......................................................................................................................... 44
 3.3.1 Preparation ..................................................................................................................... 44
 3.3.2 Test selection ................................................................................................................. 46
 3.3.3 Test adjustments ............................................................................................................ 47
4 RESULTS .................................................................................................................................. 51
5 DISCUSSION ............................................................................................................................ 55
6 CONCLUSIONS ....................................................................................................................... 57
7 FUTURE WORK...................................................................................................................... 59
 7.1 Recommendations ................................................................................................................ 59

 11
7.2 Future work .......................................................................................................................... 59
8 REFERENCES ......................................................................................................................... 61
APPENDIX A: Assembly drawing.............................................................................................. 65
APPENDIX B: Air seal dimensions ............................................................................................ 67
APPENDIX C: Assembly instructions........................................................................................ 71
APPENDIX D: Experiment checklist ......................................................................................... 77
APPENDIX E: Experiment results ............................................................................................. 79
 Test 1 .......................................................................................................................................... 79
 Test 2 .......................................................................................................................................... 80
 Test 3 .......................................................................................................................................... 81
 Test 4 .......................................................................................................................................... 82
 Test 5 .......................................................................................................................................... 83
 Test 6 .......................................................................................................................................... 84
 Test 7 .......................................................................................................................................... 85
 Test 8 .......................................................................................................................................... 86
 Test 9 .......................................................................................................................................... 87
 Test 10 ........................................................................................................................................ 88
 Test 11 ........................................................................................................................................ 89
 Test 12 ........................................................................................................................................ 90
 Test 13 ........................................................................................................................................ 91
 Test 14 ........................................................................................................................................ 92
 Test 15 ........................................................................................................................................ 93
 Test 16 ........................................................................................................................................ 94
 Test 17 ........................................................................................................................................ 95
 Test 18 ........................................................................................................................................ 96
 Test 19 ........................................................................................................................................ 97

 12
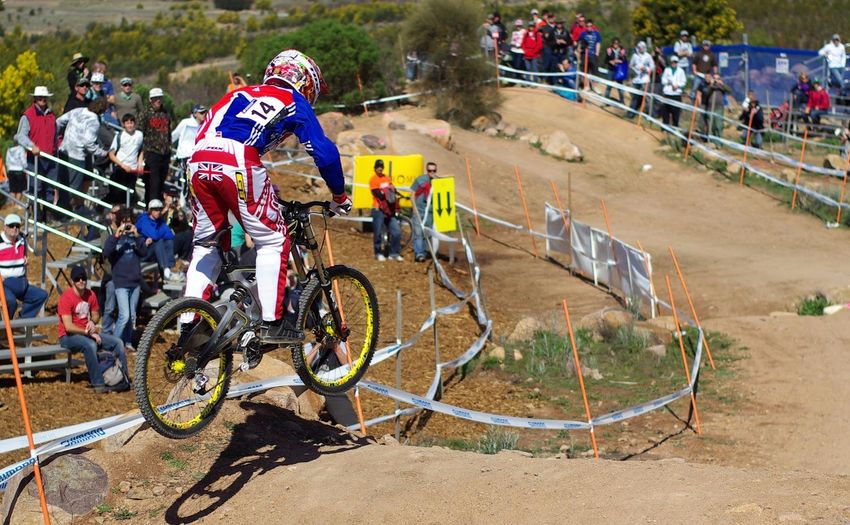
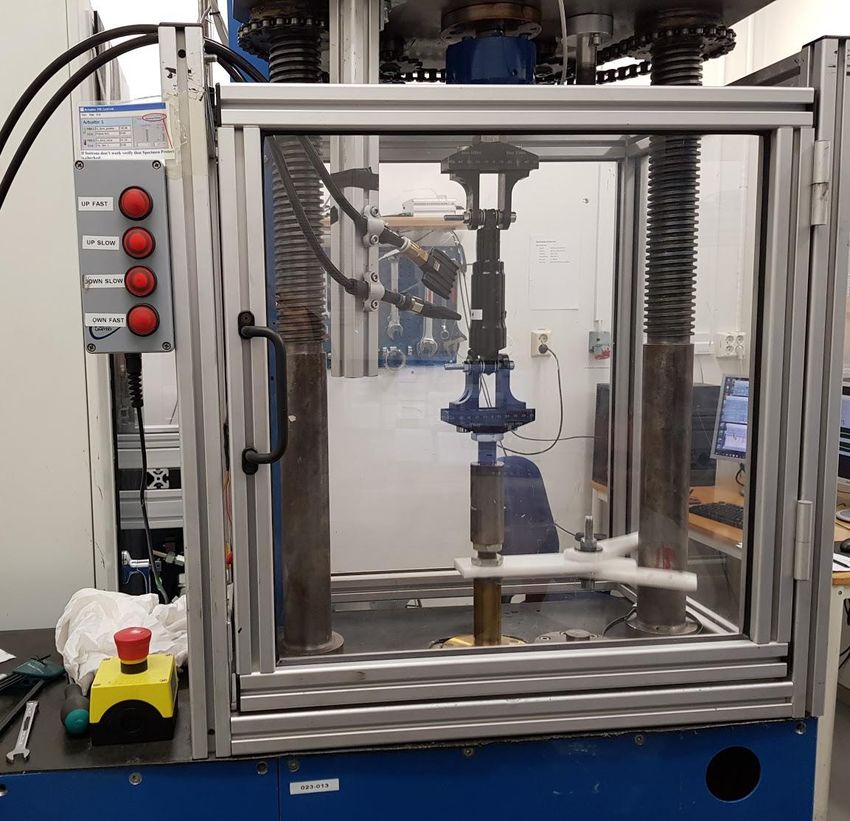
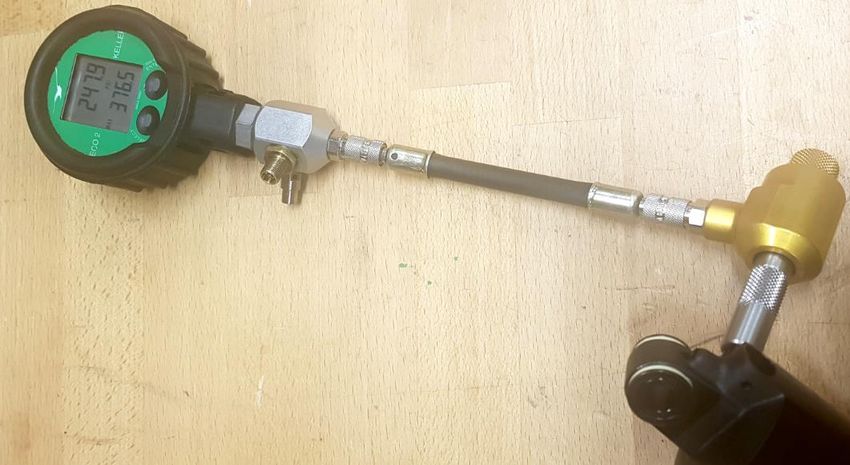
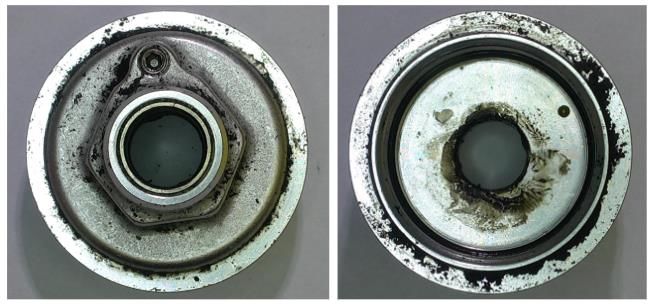
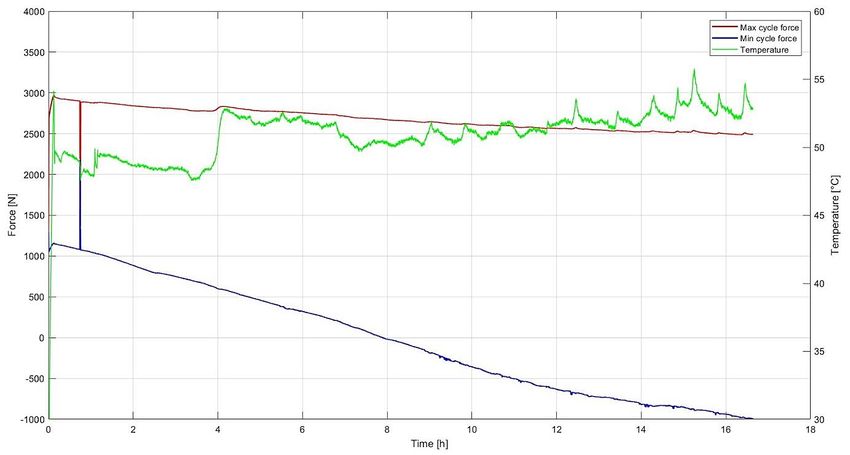
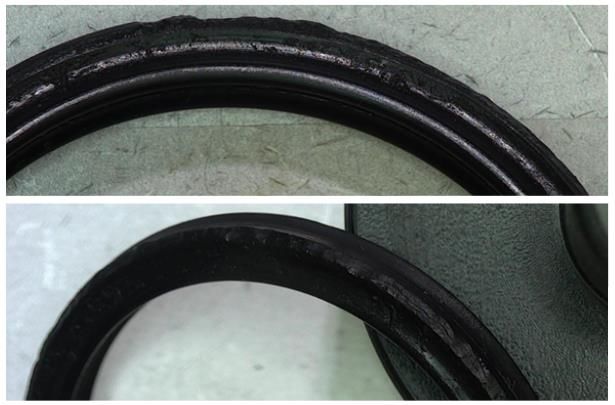
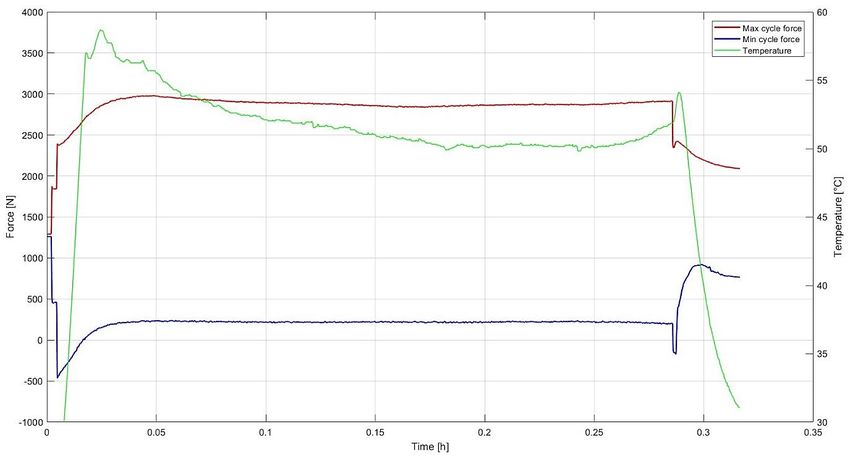
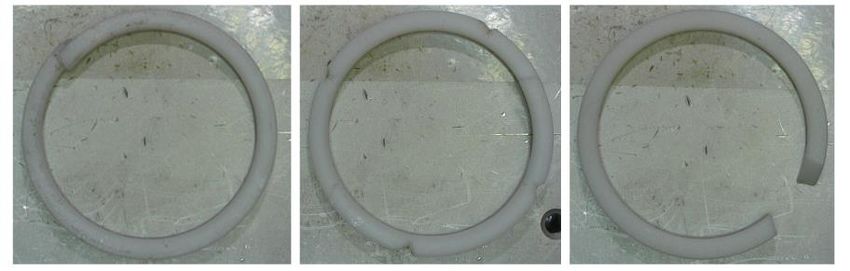
LIST OF FIGURES
Figure 1. Specialized Enduro Pro bike with Öhlins STX air shock and RXF 36 fork. [2] ............ 15
Figure 2. A downhill track in Australia. [6] ................................................................................... 16
Figure 3. An Öhlins air shock mounted on a mountain bike. [7] ................................................... 17
Figure 4. Outline of the project’s working process. ....................................................................... 18
Figure 5. Öhlins TTX Air shock and TTX 22 coil shock. [11] ...................................................... 19
Figure 6. A drawing of an MTB air shock. .................................................................................... 20
Figure 7. Single-tube (left) and twin-tube (right) shocks. .............................................................. 21
Figure 8. X-ring seals have four lobes, providing two sealing surfaces on each side. [17] ........... 22
Figure 9. Back-up rings are used at the lower pressure side of the seal to prevent seal extrusion
into the extrusion gap. [19] ............................................................................................................. 23
Figure 10. For the normal distribution, 95.4 % of data is within 2 standard deviations of its mean
value. [22] ....................................................................................................................................... 26
Figure 11. Skewness is a measure of a probability distribution’s symmetry. [23] ........................ 26
Figure 12. Distributions with positive or negative kurtosis differ in form from the normal
distribution with the same mean and standard deviation. [26] ....................................................... 27
Figure 13. Surface topography is characterized with the surface lay, waviness and roughness. [34]
 ........................................................................................................................................................ 29
Figure 14. Schematic of a contact profilometer. [36] ..................................................................... 29
Figure 15. A primary profile, roughness profile and waviness profile from the same measurement.
[37] ................................................................................................................................................. 30
Figure 16. The Abbott-Firestone curve is used to obtain the parameters of the Rk family. [40] ... 31
Figure 17. The symbol used to indicate a surface requiring material removal. Information on (a, b)
surface texture, (c) machining method, (d) lay and (e) machining allowance can be included. [41]
 ........................................................................................................................................................ 31
Figure 18. The superfinishing process leaves a cross-hatched pattern on the treated surface. [43]33
Figure 19. The Taguchi methods process. [44] .............................................................................. 34
Figure 20. A typical P-diagram, if there aren’t any signal factors they are not included in the
diagram. .......................................................................................................................................... 35
Figure 21. Demonstration of how tolerance stack-up can lead to excessive tolerance. [28].......... 38
Figure 22. An Ishikawa diagram for an MTB rear shock’s air leakage. ........................................ 39
Figure 23. One X-ring seal is located on either side of the shock’s negative air chamber. ........... 41
Figure 24. A Mitutoyo PJ300 profile projector was used to measure seal diameter and thickness.
[51] ................................................................................................................................................. 42
Figure 25. The inner diameter and thickness of 111 X-ring seals were measured, four ways for
each seal.......................................................................................................................................... 42
Figure 26. Histograms of the measured air seals’ inner diameter and thickness. .......................... 43
Figure 27. The cylinder tube has detailed surface roughness tolerances for the outer surface. ..... 44
Figure 28. The shock is pumped through a digital pressure gauge ................................................ 45
Figure 29. The shock is tested in a dynamometer. ......................................................................... 46
Figure 30. When removing the main seal, its backup ring had to be adapted to let air pass over it.
 ........................................................................................................................................................ 48
Figure 31. A part of the damping piston broke in the same way during test #13 and #14. ............ 52
Figure 32. The separating piston bent excessively during test #14. ............................................... 52
Figure 33. The main seals from tests #17 (above) and #18 (below). ............................................. 52
Figure 34. The seal head was covered in particles from the main seal after test #17. ................... 53
Figure 35. Overview of the assembled air shock. .......................................................................... 71
Figure 36. Maximum and minimum cycle forces with temperature from test 1. ........................... 79
Figure 37. Maximum and minimum cycle forces with temperature from test 2. ........................... 80
Figure 38. Maximum and minimum cycle forces with temperature from test 3. ........................... 81
Figure 39. Maximum and minimum cycle forces with temperature from test 4. ........................... 82

 13
Figure 40. Maximum and minimum cycle forces with temperature from test 5. ........................... 83
Figure 41. Maximum and minimum cycle forces with temperature from test 6. ........................... 84
Figure 42. Maximum and minimum cycle forces with temperature from test 7. ........................... 85
Figure 43. Maximum and minimum cycle forces with temperature from test 8. ........................... 86
Figure 44. Maximum and minimum cycle forces with temperature from test 9. ........................... 87
Figure 45. Maximum and minimum cycle forces with temperature from test 10. ......................... 88
Figure 46. Maximum and minimum cycle forces with temperature from test 11. ......................... 89
Figure 47. Maximum and minimum cycle forces with temperature from test 12. ......................... 90
Figure 48. Maximum and minimum cycle forces with temperature from test 13. ......................... 91
Figure 49. Maximum and minimum cycle forces with temperature from test 14. ......................... 92
Figure 50. Maximum and minimum cycle forces with temperature from test 15. ......................... 93
Figure 51. Maximum and minimum cycle forces with temperature from test 16. ......................... 94
Figure 52. Maximum and minimum cycle forces with temperature from test 17. ......................... 95
Figure 53. Maximum and minimum cycle forces with temperature from test 18. ......................... 96

 LIST OF TABLES
Table 1. Some failure modes of O-ring and X-ring seals. [20] ...................................................... 23
Table 2. Process capability index and sigma levels relation to process yield. ............................... 28
Table 3. Some roughness parameters with definitions. [38] .......................................................... 30
Table 4. Some manufacturing methods with resulting roughness values. [30] .............................. 32
Table 5. An example of a combined array. .................................................................................... 35
Table 6. A demonstration of a two level orthogonal array. ............................................................ 36
Table 7. The experiment includes tests of eight different shock setups. ........................................ 40
Table 8. The shocks are tested in random order. ............................................................................ 40
Table 9. Characterizing values of the air seal dimensions. ............................................................ 43
Table 10. Some characteristics of the accelerated seal wear test performed on MTB shock
absorbers. ........................................................................................................................................ 47
Table 11. Summary of setup changes to the accelerated seal wear tests. ....................................... 49
Table 12. Summary of accelerated seal wear tests. ........................................................................ 51
Table 13. Measurements of X-ring seals’ dimensions using a profile projector. ........................... 67

 14
1 INTRODUCTION

1.1 Background
Mountain biking is an adventure sport which has been increasing in popularity for the past years
and decades. It includes riding bikes off-road, often on rough and uneven trails in various
conditions. There exist multiple different categories in mountain biking such as cross-country,
enduro, downhill and trail. [1]

 Figure 1. Specialized Enduro Pro bike with Öhlins STX air shock and RXF 36 fork. [2]

Cross-country (XC) cycling takes place on a terrain where the course consists of both rough trails
as well as more smooth roads. The XC bikes are usually rather light, between 7 and 16 kg. [1] The
front fork of the bike can be either fully rigid or have a suspension which relies on an air spring.
When the front fork is fully rigid the rider has more sensitivity and feeling for the trail and is much
lighter as well. The same goes for the rear end of the bike where it depends on the rider if he/she
prefers having no suspension, hardtail, or including suspension. If the bike is without rear
suspension the power from the pedalling all goes into moving the rear wheel. Like the fully rigid
fork the hardtail offers trail sensitivity, but it may get too much if the trail is particularly rough. In
those cases, a rear suspension is recommended. [3] XC cycling requires a great deal of physical
strength and good technical skills. It is the only form of mountain biking that is competed in at the
Summer Olympic Games. [1]

Another type of mountain biking is trail riding. The difference between XC and trail riding can be
unclear since XC bikers ride on trails as well. However, trail riders often look for bigger features
and obstacles. XC bicycles are faster on flat trails and up hills but not as fast on descends. Trail
bikes don’t go particularly fast uphill but can really work up speed going down. [4] Trail riders
often seek out more challenging and technically difficult trails than cross-country. The front
suspension on trail bikes is also much heavier, usually equipped with an air spring but using a coil
spring is an option as well. The fork will have more travel in order to handle rougher and more
technical trails as well as jumping. Trail bikes are always equipped with rear suspension as well.
Most often with an air shock that has some adjustment controls. [3]
Enduro racing is rather different from XC. It involves racing on descending trails on time, but the
race is divided into stages. In between the downhill races there are several transfer stages which are

 15
mostly uphill. These transfer stages can often be challenging and hard on the rider, but they do not
however directly affect the final result since they are untimed. Usually though, there is a time-limit
on these transfer stages. [5] In the end the rider with the fastest combined time of the downhill
stages wins the race.

 Figure 2. A downhill track in Australia. [6]

When competing in a downhill race (Fig. 2) the rider races down a steep hill on rough tracks. The
trail consists of rocks in various sizes as well as tree roots and other obstacles. The course also
includes jumps and often takes place at a ski resort in the summer. This type of racing is often
considered the most dangerous type of mountain bike racing. The bikes used in downhill racing are
much heavier than most mountain bikes and can weigh around 15-20 kg. Therefore, the rider needs
to be physically strong to have good control of the bike. These downhill bikes are always equipped
with both front and rear suspension. [1]

As stated above, the suspension system plays a significant role when it comes to mountain biking
and the rider’s experience. Many mountain bikes (MTB) have a front fork suspension with rigid
non-suspended rear wheels. To enable even smoother rides, full suspension MTB were introduced.
Including, in addition to the front forks, shock absorbers attached to the rear wheel. (Fig. 1)

At first, coiled spring systems were dominant on the market. Coil shocks have a metal spring
wrapped around the cylinder, thus making them considerably heavier than air shocks. (Fig. 3) The
air shock includes pressurized air for a spring which is more tuneable than the coil spring. A sealing
system is used to restrain the pressurized air and allow for linear movement of the piston. A minor
leakage of air from extended use is considered acceptable and it is a part of standard maintenance
to pump the shock with air to regain appropriate air pressure. If the air leakage becomes too much
however, the suspension performance and the rider’s safety get compromised. This can therefore
lead to dangerous circumstances and harmful accidents.

 16
Figure 3. An Öhlins air shock mounted on a mountain bike. [7]

1.2 Purpose
Excessive leakage from an MTB air shock can increase the chance of accidents and limit product
performance. It is therefore important to minimize this to the furthest extent possible. By analysing
the variation of the most influential factors of the shock sealing system and their effect on the air
leakage, a set of parameters could be chosen, based on their characteristics. This way, the
performance might be improved and made less sensitive to production variations.

This project is an investigation of the causes of air leakage in MTB air shocks. A shock’s sealing
system is studied to determine the biggest contributors and experiments are carried out to see how
these factors affect air leakage. The thesis aims to answer the following questions:

 - How does surface topography, seal preload and choice of lubrication influence air leakage
 from an MTB air shock?
 - Can a certain set of parameters for these factors be chosen to minimize the sensitivity of
 production variation to air leakage?

1.3 Delimitations
Setting delimitations is important in order to know what can be expected from the project. The
delimitations are used to clarify the parameters that are out of scope of the project, which will not
be studied further. The project’s delimitations are listed below.

 17
- The project should be carried out over a period of equivalent to 20 work weeks.
 - This investigation will be limited to a single type of MTB air shock. However, the method
 should be applicable to other shocks.
 - The impact of different types of seals or seal setups will not be investigated.
 - The experiments are aimed at testing air leakage with accelerated tests in a hydraulic
 dynamometer. Effect on other performance factors is not under examination.

1.4 Methodology
After specifying the objectives for the project, a plan is created for the work to be done. (Fig. 4) A
background study on e.g. probabilistic design, damper testing, sealing systems and air leakage from
air shocks is conducted. Papers and studies on similar content are examined as well as lab reports
from experiments that have been performed on the matter. From the background study, the frame
of reference is developed.

 Figure 4. Outline of the project’s working process.

An Ishikawa diagram is created for an overview of potential causes of failure. From the information
gathered, a design of experiments strategy is implemented. Physical experiments on the MTB air
shocks are carried out and the results analysed for a set of parameters that give the most robust air
sealing.

 18
2 FRAME OF REFERENCE

2.1 MTB air shocks
2.1.1 Function and main components
The MTB air shock has two key elements, a spring and a damper. There are two main types of
springs, mechanical and air. (Fig. 5) A coil shock has a metal spring wrapped around the piston rod
whilst the air shock uses a pressurized chamber so the weight difference between the two can be
significant. The adjustability in terms of progression is greater in air shocks. The air pressure can
be easily changed and its progression altered with volume spacers. [8]

The main difference between the damping and the spring function is that damping turns kinetic
energy into heat whilst the spring stores energy. Fundamentally, damping aims to slow down the
movement of the suspension. There is damping during both the compression and rebound of the
shock. When the wheel comes in contact with some obstacle in the trail the compression damping
slows the suspension down. These obstacles can be of various shapes and sizes which means that
the compression damping needs to be equipped to deal with a wide range of velocities. As the
suspension starts extending again, the rebound damping controls the energy of the compressed
spring and slows it down. This means that the velocity of the rebound stroke is connected to how
much travel is used. [9]

Mountain bikes typically come with either front suspension only (hard tail) or full suspension; on
both front and rear wheel. The front suspension is generally a telescopic fork while the rear wheel
is connected to the bike’s frame by a smaller shock absorber. The suspension forks and the rear
shocks come in different types. Depending on the intended usage, the structure and travel can vary.
[10]

 Figure 5. Öhlins TTX Air shock and TTX 22 coil shock. [11]

Figure 6 shows a cross sectional drawing of the MTB air shock, used for this project. It can also be
seen in more clearly in Appendix A, with more detailed drawings. The surface of the shock’s
cylinder tube needs to have a relatively fine surface since it is in contact with the air seal during its
reciprocating motion, in and out of the air sleeve. A separating piston is placed inside the damper
cylinder, holding the nitrogen which provides pressure on the suspension fluid. The suspension

 19
fluid provides damping and lubrication to the shock’s internals. A piston on a shaft/rebound tube
moves through the damper fluid when the shock compresses and rebounds. The seal head is
threaded onto the damper cylinder and closes off the suspension fluid. Placed in a groove on the
seal head is the main seal with two backup rings. Two stacks of shims are placed on the shock’s
damping piston for controlling damping settings. These shims come in a various sizes and
thicknesses, providing endless stacking options. The shim stacks are separated by a damping piston
and when the shock is moving, the oil flows through ports on the piston. During compression, the
oil flow through the rebound ports are completely blocked by the rebound shims while the
compression shims bend open and allow the oil to flow through the compression ports. The opposite
happens in rebound damping. The thickness of the shims plays an important role when it comes to
the damping effect. With thin shims, the oil can easily bend the shims open which allows the oil to
flow through the piston ports creating very little damping effect. When the shims are thicker, they
become much harder to bend so much more force is required from the oil to bend them open which
increases the damping effect. Adjusting the shims, adding or removing shims, making them thicker
or bigger, all contribute to the tuning of the shock. [12]

 Figure 6. A drawing of an MTB air shock.

The air can is divided into two chambers by the seal head, a positive and a negative air chamber.
Transfer ports that are placed on the inside of the air sleeve, transferring air between the two
chambers at every stroke and self-adjusting the shock’s spring action. When air is pumped into the
shock it goes into the positive chamber and the pressure created acts as an easily adjustable spring.
When riding the bike, the seal head travels up and down the air can, compressing the air inside
which reacts with a spring force. While the air in the positive chamber works on keeping the shock
extended the air in the negative chamber creates a force in the opposite direction, preloading the
positive spring.

2.1.2 Shock design
Two examples of shock designs are the single-tube and twin-tube shocks. (Fig. 7) The twin-tube
shock is one of the most popular styles available. The twin-tube has a shell case covering the
cylinder where nothing is separating the oil and the gas. Outside the oil chamber the shock has
compressible air that is used to deal with the displacement of the piston shaft. [9] The single-tube
has the shell case working as a cylinder with the oil, gas and piston, all inside. The free piston works
as a separating piston, separating the oil and the gas. [12] The oil chamber is not completely filled

 20
with oil since the shock requires, like with the twin-tube, an air space for the shaft’s displacement.
[9]

 Figure 7. Single-tube (left) and twin-tube (right) shocks.

Another shock type is the DeCarbon reservoir shock. This type of shock has a floating piston which
separates the nitrogen from the main shock body. A problem with the DeCarbon design is that due
to the floating piston the shock can get longer than e.g. the twin-tube shock. A solution to this was
attaching a separate reservoir with a hose which was then improved by making the reservoir
integral. [5]

2.1.3 Test methods
To measure the shocks performance and test the shock in theory, damper testing is an important
tool. There are many different possibilities when it comes to damper testing, usually a dynamometer
is used with various setups and tests based on the desired outcome.

A durability test is designed to run for an extended number of cycles where a number of factors are
under observation during the test. When the test has run for the desired number of cycles the
characteristics of the damper are checked in order to verify that the damper is performing as
expected. [13] Another test type is a fatigue test which has the purpose of testing for instance a
single part of the shock. A requirement for the component is set with e.g. a fixed number of cycles,
compression and tensile load. If the shock has shown no sign of failure after the test the test is
considered approved regarded the stated requirements. [14]

A stroking test is used when the shock has the same stroke frequency during the entire test. A similar
test to the stroking test is an accelerated seal wear test. It is an effective method to evaluate
parameters related to air seal wear and function. It has been proven to wear out the shocks’ seals
rather quickly. The accelerated test moves the shock absorbers differently from the simple sinus

 21
wave of the stroking test and is a lot harder on the seals. [15] If a more realistic test is desired a ride
test can be performed. A ride test is implemented by using real data from riding the MTB as the
drive file. This is a good way to see how the shock performs under real circumstances.

2.2 X-ring seals
Seals are made in innumerable different shapes and sizes. They are used for joining different parts
or systems while keeping certain things inside and other outside. Gas is often sealed off and kept at
a certain pressure. Fluid is also kept from leaking and contamination prevented. The seal’s cross
section, material and size is determined by its intended usage. Proper sealing is evidently vital for
proper functioning of various machinery. Failure in this regard can thus result in great cost and
dangerous circumstances.

The most common type of seal is the O-ring which has a circular cross section and can be used both
for static and dynamic applications. [16] Dynamic applications relate to sealing of surfaces moving
in relation to each other. This motion can be rotary, reciprocating or a combination of both. O-rings
are sometimes used for low-speed reciprocating motions. While it can be a great solution, problems
can arise when O-rings are improperly sized for their seal groove and experience motion. Examples
of seals more resistance to motion like this are the rectangular seal rings and the X-ring seal. (Fig.
8)

 Figure 8. X-ring seals have four lobes, providing two sealing surfaces on each side. [17]

X-ring seals (also called Quad-Ring seals) are different from O-rings for they have four lobes,
providing two sealing surfaces on each side compared to the one of the O-rings. This larger sealing
surface for the same size of seal requires less force for sufficient sealing thus generating less friction.
This is a real benefit as it means less heat generation and extended seal lifetime. Due to these four
lobes the seal is also less likely to roll in its groove during reciprocating movements. Additionally,
the seal’s parting line will never be a problem since it is placed in between the lobes, away from
the sealing surfaces. [18]

An MTB air shock includes many seals for a proper function. Its seals have different requirements
and are therefore of different types and sizes. Each component needs to work in harmony with the
next one and every connection point needs to be sealed off, whether it is static or dynamic. The

 22
damping system requires good sealing for its damping oil and nitrogen gas and the same goes for
other parts of the shock. The cylinder tube moves in a reciprocating motion in and out of the air
sleeve. This requires the air inside to be sealed inside the shock as well as the two air chambers to
be sufficiently separated as the seal head moves back and forth with the cylinder tube.

Back-up rings are often used for protection purposes and for preventing seal extrusion. (Fig. 9)
Back-up rings are required when pressure or temperature is high or if the temperature is fluctuating.
It’s also recommended if there are a lot of contaminants in the system. If the pressure is only acting
from one side, it is sufficient to install only one back-up ring on the opposite side - away from the
pressure. When the pressure is acting from both sides, two back-up rings may be needed.

Figure 9. Back-up rings are used at the lower pressure side of the seal to prevent seal extrusion into the extrusion gap.
 [19]

X-ring seals are available in the same dimensions as the conventional O-rings. Although the X-ring
seals have some benefits over the O-ring, the two types are interchangeable and experience most of
the same failure modes. Some of these failure modes, common between the two seal types are listed
in Table 1 below. Seal failure can occur if the seal and its groove are improperly designed for the
acting forces and environmental factors.

 Table 1. Some failure modes of O-ring and X-ring seals. [20]

 Failure mode Description

 Gland design Inappropriate sizing or groove design resulting in poor seal
 performance without any visual damage.

 Over Design resulting in too high compression forces. May result
 compression in flat contact areas and/or cracks on the same surface.

 Explosive Pressure drop too rapid for the elastomer’s
 decompression modulus/hardness. Results in blisters, pits or pockets on the
 seal.

 23
Installation The seal gets small cuts from sharp edges of connecting
 damage components or installation tools.

 Abrasion The seal wears down on the sealing surface due to high
 temperature, poor elastomer surface and/or abrasive
 particles in the environment.

 Extrusion Ragged edges on the low-pressure side of the seal caused by
 gap extrusion. This could be a result of high pressure,
 immoderate clearance and gland fill or low elastomer
 hardness/modulus.

 Thermal Radial cracks in the seal on surfaces experiencing high
 degradation temperatures or temperature cycling.

 Chemical Seal degradation such as blisters, cracks and discoloration
 degradation as a result of chemical reaction of the elastomer.

2.3 Probability and statistics
2.3.1 Fundamental concepts
Arithmetic mean is the average value of a data set,

 N
 1
 x̅ = ∑ xi (1)
 N
 i=1

Other types of means, e.g. geometric and harmonic, will not be used in the report so the word mean
will always refer to the arithmetic mean value.

The standard error of the mean (SEM) describes the standard deviation of the mean’s sampling
distribution. In other words, if the sampling were to be repeated multiple times, the standard error
describes the variation of the obtained means. It is calculated as

 σ
 σx̅ = (2)
 √N

where is the population’s standard deviation and N the sample size.

For a set of data, the median value is the number in the middle when arranged from smallest to
greatest. When the dataset has an even number of values, the median is the mean of the two in the
middle.

 24
The mode of a set of data is the most frequently occurring value.

Standard deviation is used in statistics to quantify variation in a set of data. If a dataset is widely
spread out, it has a high standard deviation while a low value indicates the data being close to its
mean value. Standard deviation of a population is

 N
 1
 σ = √ ∑(xi − μ)2 (3)
 N
 i=1

where N is the size of the population and µ its mean value.

To estimate the standard deviation of a population, without all of its data, the sample standard
deviation is used,
 N
 1
 s= √ ∑(xi − x̅)2 (4)
 N−1
 i=1

with N being the sample size and x̅ the sample mean. The sample standard deviation allows
generalizations to be made on the population. Using N − 1 instead of just N is known as Bessel’s
correction after Friedrich Bessel and corrects the bias in the estimation of the population’s standard
deviation. [21]

Variance is the square of the standard deviation and represented by σ2 , s2 or Var(X). While it is not
possible to add the standard deviation, the variances of uncorrelated variables can be summed up
for the variance of their sum.

 N N

 Var (∑ Xi ) = ∑ Var(Xi ) (5)
 i=1 i=1

2.3.2 Normal distribution
The normal distribution is a frequently appearing distribution in natural phenomena. It is
characterized with its mean, µ, and standard deviation, σ, which can be used with the probability
density function (PDF) of the normal distribution,

 1 (x−μ)2
 2 −
 f(x | μ, σ ) = e 2σ2 (6)
 √2πσ2

 25
Figure 10. For the normal distribution, 95.4 % of data is within 2 standard deviations of its mean value. [22]

The cumulative distribution function (CDF) is the integral of the probability. For normal
distribution it is
 x
 1 2
 Φ(x) = ∫ e−t /2 dt (7)
 √2π ∞

The same way the CDF is used for finding the probability of a distribution’s value being lower than
x, the PDF can be integrated over any other range.

2.3.3 Skewness and kurtosis
Skewness is a quantifying factor for the asymmetry of a probability distribution of a variable around
its mean. A normal distribution has a skewness of zero as it is symmetric. Negative skewness
appears in a tail to the left in the probability distribution and which is often said to be left-skewed.
The same way, a positive skewness leads to a tail to the right, right-skewed distribution. (Fig. 11)

 Figure 11. Skewness is a measure of a probability distribution’s symmetry. [23]

The sample skewness is calculated as
 N
 N xi − x̅ 3
 S= ∑( ) (8)
 (N − 1)(N − 2) s
 i=1

where N is the sample size, x̅ is the mean and s the sample standard deviation. [24]

 26
Kurtosis describes the form of a distribution’s tails, relative to the one of a normal distribution. A
normal distribution has a kurtosis of three, the same as excess kurtosis of zero. Positive kurtosis
describes a distribution having, in relation to a normal one with same mean and standard deviation,
more extreme tail data. Probability distribution with negative excess kurtosis on the other hand has
tail data, smaller than that of its equivalent normal distribution. [25] Distributions with kurtosis of
three, as the normal distribution, are called mesokurtic. Ones with positive excess kurtosis are called
leptokurtic and negative, platykurtic. (Fig. 12)

 Figure 12. Distributions with positive or negative kurtosis differ in form from the normal distribution with the same
 mean and standard deviation. [26]

The excess kurtosis can be calculated using

 N
 N(N + 1) xi − x̅ 4 3(N − 1)2
 K= ∑( ) − (9)
 (N − 1)(N − 2)(N − 3) s (N − 2)(N − 3)
 i=1

The standard error of skewness (SES) can be estimated with the sample size as √6/N and the
standard error of kurtosis (SEK) as √24/N. [27]

The skewness and excessive kurtosis of a distribution can be used with the relevant standard errors
to evaluate its normality. Normality is considered up for rejection if the ratio of absolute skewness
to its standard error is greater than 2. An absolute value of the absolute excess kurtosis, twice the
standard error, is also an indication that the distribution is not normal.

2.3.4 Process capability index
The process capability index describes a processes capability to make an output within its
specification limits.

The process capability index for normally distributed processes is

 USL − μ μ − LSL
 Cpk = min [ , ] (10)
 3σ 3σ

 27
where µ and σ are the distribution mean and standard deviation. USL and LSL are the output’s
upper and lower specification limits. The Cpk can be used with the standard normal cumulative
distribution function, Φ(x) to calculate the percentage of parts outside the tolerance limit, closer to
the mean,

 p = Φ(−3Cpk ) (11)

Table 2 shows the relationship between Cpk, sigma levels and process yield. A Cpk value of 1.33 is
generally recommended for production of individual components and system inputs, equivalent to
a sigma level of 4. A value of 1.67 is often the goal for a final design or an output signal as a buffer
for any unknown variations. [28]

 Table 2. Process capability index and sigma levels relation to process yield.

 Cpk Sigma level Process yield [%] Defects per million opportunities
 0.33 1 68.27 317311
 0.67 2 95.45 45500
 1.00 3 99.73 2700
 1.33 4 99.99 63
 1.67 5 99.9999 1
 2.00 6 99.9999998 0.002

2.4 Surface topography
Surface topography has a strong effect on the interaction between two mating surfaces, wear and
lubrication. [29] It is described using three characteristics; lay, waviness and roughness. (Fig. 13)
[30] Lay is the term used to express the main surface pattern, determined by the surface’s
manufacturing process. This pattern can for example be linear in a certain direction, crossed,
circular or multi-directional. [31] Waviness of a surface is expressed with different parameters
which all give information on irregularities from the general geometry but with greater spacing than
the roughness. The waviness is generally recurring and caused by machine deflection, vibrations or
heat treatment. [32] Surface roughness is the measurement of deviation of a surface from its ideal
geometry. The roughness is generally thought about as the more frequent component of the
deviation compared to the waviness. [33]

 28
Figure 13. Surface topography is characterized with the surface lay, waviness and roughness. [34]

Roughness can either be measured on a surface area or, as is more common, on a profile. The profile
is commonly measured using a contact profilometer, (Fig. 14) dragging a stylus along the surface,
detecting any displacements. This system is really simple compared to the non-contact ones but still
sufficient for measuring 2-dimensional profiles. The non-contact methods, using optical
microscopes can measure 3 dimensional surfaces very fast and require no touching of the surface.
[35]

 Figure 14. Schematic of a contact profilometer. [36]

The measured profile differs from the actual one because of the mechanical filtering of the probe
tip radius. After filtering the measured profile with a low-pass filter using cut-off wavelength λ we s

get the primary profile (P-profile). The primary profile can then be further filtered with a high-pass
filter with a cut-off wavelength λ , resulting in the roughness profile (R-profile). Filtering the
 s

primary profile with a low-pass filter with a cut-off wavelength λ , and then a high-pass filter with
 c

a cut-off wavelength λ , results in the waviness profile (W-profile). An example of the different
 f

profiles from the same surface measurement can be seen in Figure 15 below.

 29
Figure 15. A primary profile, roughness profile and waviness profile from the same measurement. [37]

The profile is measured for the evaluation length, ln, which is divided up into several sampling
lengths, lr or lw, depending on the profile. The sampling length of the roughness profile, lr, is
usually one fifth of the evaluation length. From these primary, roughness and waviness profiles,
several parameters are calculated and designated with P, R or W, respectively. The most commonly
used in design and manufacturing are the roughness parameters. Some of these roughness
parameters are listed in Table 3 below with their definitions.

 Table 3. Some roughness parameters with definitions. [38]

 Roughness parameter Definition

 Ra Mean deviation of the roughness profile.
 Rp Maximum peak height of the roughness profile.
 Rv Maximum valley depth of the roughness profile.
 Rt Total height of the roughness profile.
 RSm Average width of the roughness profile elements.
 Rsk Skewness of the roughness profile’s amplitude distribution.
 Rz Average of the maximum height of the roughness profile within
 each sampling length.
 Rk Height of the roughness core profile.
 Rpk Average height of peaks above the roughness core profile.
 Rvk Average depth of valleys below the roughness core profile.
 Mr1 Areal percentage of peaks over the roughness core profile.
 Mr2 Areal percentage of valleys under the roughness core profile

 30
There does exist a lot of roughness parameters, more than described above. Some of them are very
easily understood and calculated while others are a bit more complicated. To understand the Rk
parameter family for instance, one has to know what the core profile is. These parameters are based
on the Abbott-Firestone curve which, mathematically, is the cumulative probability density function
of the profile’s height. [39] Its tangent with the smallest slope is used to divide the profile into three
sections from which the Rk, Rpk, Rvk, Mr1 and Mr2 parameters are calculated. (Fig. 16)

 Figure 16. The Abbott-Firestone curve is used to obtain the parameters of the Rk family. [40]

Figure 17 shows the symbol used for surfaces that require material removal. This symbol can be
included with information on surface texture tolerances, machining method and lay. The horizontal
line closing the triangle in the symbol indicates that material removal by machining is required. If
material removal is not permitted, a circle takes the place of this line. Without either the line or the
circle, the stated surface can be obtained by any process.

Figure 17. The symbol used to indicate a surface requiring material removal. Information on (a, b) surface texture, (c)
 machining method, (d) lay and (e) machining allowance can be included. [41]

A really smooth surface is often desirable but different manufacturing methods can deliver different
values of the roughness parameters. Table 4 below shows what values of Ra can be achieved with
some common manufacturing methods. Extra time and effort can be needed for the machining of
these surfaces which also require high quality tools and even still, additional surface treatment can
be required. In general, the lower roughness parameters needed on a surface, the higher the cost.

 31
You can also read