Economic impact analysis of 2050 emissions targets - A dynamic Computable General Equilibrium analysis
←
→
Page content transcription
If your browser does not render page correctly, please read the page content below
Economic impact analysis of 2050
emissions targets
A dynamic Computable General Equilibrium analysis

NZIER final report to Ministry for the Environment
18 June 2018

About NZIER
NZIER is a specialist consulting firm that uses applied economic research and analysis
to provide a wide range of strategic advice to clients in the public and private sectors,
throughout New Zealand and Australia, and further afield.
NZIER is also known for its long-established Quarterly Survey of Business Opinion and
Quarterly Predictions.
Our aim is to be the premier centre of applied economic research in New Zealand. We
pride ourselves on our reputation for independence and delivering quality analysis in
the right form, and at the right time, for our clients. We ensure quality through
teamwork on individual projects, critical review at internal seminars, and by peer
review at various stages through a project by a senior staff member otherwise not
involved in the project.
Each year NZIER devotes resources to undertake and make freely available economic
research and thinking aimed at promoting a better understanding of New Zealand’s
important economic challenges.
NZIER was established in 1958.

Authorship
This paper was prepared at NZIER by John Ballingall and Dr Daniel Pambudi. Dr Erwin
Corong (NZIER Associate) and Dr Adolf Stroombergen (Infometrics) provided valuable
technical assistance and peer review.
It was quality approved by Peter Clough.
The assistance of officials in numerous government agencies is gratefully
acknowledged.

L13 Willeston House, 22-28 Willeston Street | PO Box 3479, Wellington 6140
Tel +64 4 472 1880 | econ@nzier.org.nz
© NZ Institute of Economic Research (Inc). Cover image © Dreamstime.com
NZIER’s standard terms of engagement for contract research can be found at www.nzier.org.nz.
While NZIER will use all reasonable endeavours in undertaking contract research and producing reports to ensure the
information is as accurate as practicable, the Institute, its contributors, employees, and Board shall not be liable (whether in
contract, tort (including negligence), equity or on any other basis) for any loss or damage sustained by any person relying on
such work whatever the cause of such loss or damage.
Executive summary
Research objectives and methodology
NZIER has been asked to explore the economic impacts of New Zealand adopting
different greenhouse gas emissions targets in 2050.

We use a detailed model of the entire economy and its emissions
We use a dynamic Computable General Equilibrium (CGE) model of the New Zealand
economy, split into 111 industries, to investigate a range of potential scenarios and
2050 targets. CGE models have been widely used in New Zealand and overseas for
climate change analysis.
Our model allows us to explore the inevitable trade-offs involved with adjusting to a
lower-emissions future.
We examine how the economy changes in response to the imposition of various
emissions targets – and hence carbon prices – under a range of scenarios that consider
innovation in energy, transport and agriculture, along with increased rates of net
sequestration from forestry.

CGE scenario modelling is helpful for answering “What if…?” questions…
The scenarios (outlined overleaf in Table 1) were developed with officials, drawing on
Vivid, Motu and Concept (2018). We do not assess the likelihood of the various
assumptions underpinning these innovation scenarios occurring. They are not NZIER’s
view on what will happen.
For example, our model cannot predict if or when a methane vaccine might be
introduced to New Zealand, but it can estimate how the economy and its emissions
profile would likely adjust in response to such a vaccine’s introduction.
Our modelling allows us to consider the question:
           If various innovations occur, what will be the economic impacts of
           a net zero 2050 emissions target?

...based on a set of assumptions about New Zealand’s economy and
emissions profile out to 2050
Projecting how the New Zealand economy will develop over the next 35 years is
inherently complex. We cannot predict with any certainty future global financial crises
or new industries that may emerge in response to technological changes such as
artificial intelligence.
When we also introduce industry-level greenhouse gas emissions projections into the
picture, the modelling task becomes even more challenging. Predicting the global
response to the threat of climate change is difficult. This means there is considerable
uncertainty about international carbon prices and how much investment will occur in
emissions-reducing technology.
Further, we do not know how global consumer preferences will change regarding high-
or low-emissions products.

NZIER report – Economic impact analysis of 2050 emissions targets                     i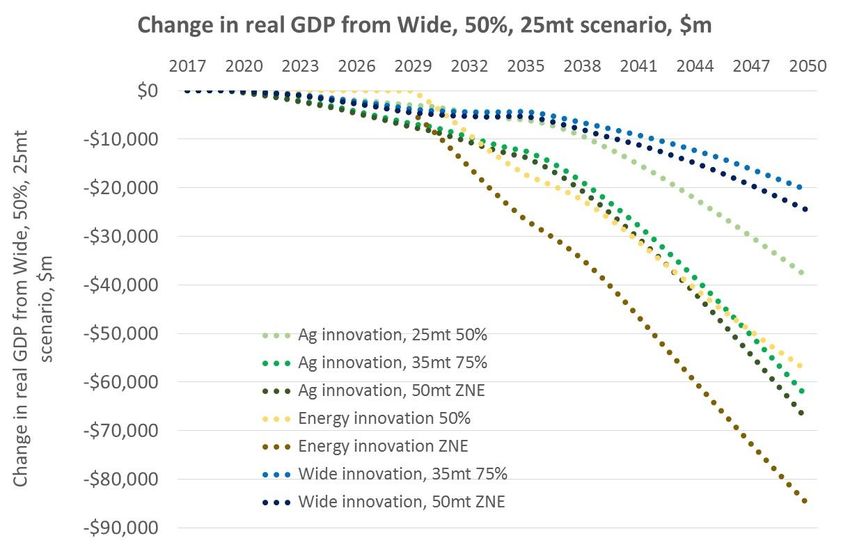
To the extent that we do not predict breakthrough technologies that significantly
reduce emissions at very low cost, our results will over-estimate the costs of
transitioning to a lower-emissions economy.
Further, we do not consider the physical impacts of climate change on crop yields,
coastal erosion, human and animal health, or infrastructure damage from storms.

This provides part of the evidence base to inform policy discussions
Under these circumstances, we need to make many assumptions about how to model
the economic and emissions outlook to 2050. Many of these assumptions will be
shown to be incorrect over time. However, this is true of all economic and climate
change models.
The role of an economic model such as ours is to compare and contrast different
scenarios in order to provide empirical insights about costs and benefits under a
consistent theoretical framework. Or as Nixon and Yeabsley (2005) put it:
     In economics, we attempt to illustrate through the modelling process a
     system of relationships which, although abstract, tries to capture the
     economically salient elements of the real world….
     The potential cost of this approach, of course, is that the process of
     abstraction has eliminated characteristics that are vital to the full
     understanding of the question under discussion.
With this in mind, we hope our analysis contributes to a discussion in New Zealand
about the nature and magnitude of the economic trade-offs we are prepared to accept
to meet different 2050 emissions targets.
We have sought to be as transparent as possible about our methodology, data and
assumptions. A full list of caveats is presented in chapter 1.2.
Additional scenarios and sensitivity analysis around key assumptions and parameters
can be considered in future research.

We explore 2050 targets of 50%, 75% and 100% of 1990 emissions
The scenarios described below are assessed against a range of potential emissions
targets, which reflect different levels of ambition:
     •     100% reduction on 1990 gross levels by 2050, or ‘zero net emissions’
     •     75% reduction on 1990 gross levels by 2050
     •     Existing target of 50% reduction on 1990 gross levels by 2050.
These targets use the ‘gross-net’ methodology. We determine the 50/75/ZNE
reduction in emissions by 2050 from a 1990 starting point of 64.6Mt CO2-e.
We then subtract assumed forestry sequestration to give us the maximum permissible
gross emissions in 2050 after having accounted for the effects of forestry in meeting
each target. We refer to the 100% target as ‘zero net emissions’ or ZNE in this report.
We do not attempt to estimate the costs of the various innovations that we model, or
determine who would bear them and when. We simply assume they occur, and
examine their implications. As such, this CGE modelling should not be seen as a cost-
benefit analysis.

NZIER report – Economic impact analysis of 2050 emissions targets                     ii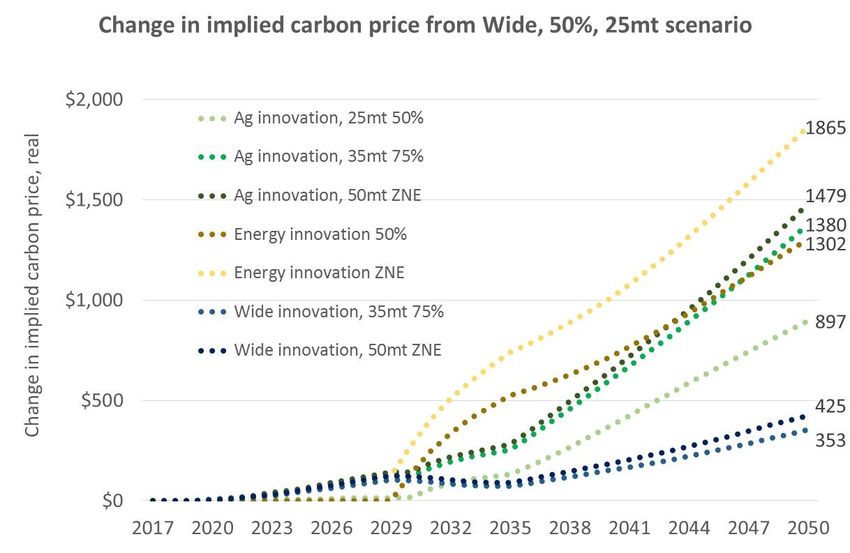
Our scenarios incorporate a considerable amount of technological
change and afforestation
Table 1 Overview of scenarios
 Scenario name                Key features
 Baseline                     Current policy settings and energy efficiency trends; biological emissions
                              excluded; $20 carbon price; strong rest of world action on climate
                              change; phase out of free allocation; EV uptake of 65% of light vehicle
                              fleet by 2050; no access to international permits.
 Core scenarios
 Ag innovation                Biological emissions included; methane vaccine introduced in 2030,
                              reducing biological emissions by 30%; lower global demand for dairy and
                              meat exports; expansion of horticulture; large expansion in net
                              sequestration.
 Energy innovation            Biological emissions included; widespread, more rapid energy efficiency
                              improvements; EV uptake to 95% of light vehicle fleet and 50% of heavy
                              vehicle fleet; 98% renewable electricity from 2035. No additional net
                              sequestration above the baseline.
 Wide innovation              All measures in Ag and Energy innovation scenarios combined.
 Sensitivity analysis
 Wide innovation + trade      Wide innovation plus access to international permits which increase in
                              price from $20 now to $50 by 2030 and either $100 or $150 by 2050.
 Wide innovation + weak       Wide innovation but global response to climate change is weak; New
 RoW                          Zealand exporters face competitiveness challenges; free allocation held
                              steady.
 Wide innovation,             Wide innovation for 50% and 75% targets that incorporates higher net
 alternative forestry         sequestration (40Mt) than in core scenarios; wide innovation for ZNE
                              target with lower net sequestration (40Mt) than in core scenario.

Source: NZIER

Note that there is no additional net sequestration to the baseline assumed in the
Energy innovation scenarios. This is so that the economic impacts of changes in the
energy and transport industries can be identified separately in this scenario from
changes to afforestation.

Projecting the likely response of innovation and afforestation to higher
carbon prices is challenging
Our model does not incorporate ‘endogenous technological change’. That means
innovation does not respond to the higher carbon prices associated with imposing an
emissions target within the model itself.
The same applies for the response of forestry owners to higher carbon prices. Our
model cannot predict the extent of new planting or avoided harvesting as carbon
process rise.
We have to make choices about innovation and afforestation outside of the model,
and build them into our scenario design.

NZIER report – Economic impact analysis of 2050 emissions targets                                      iii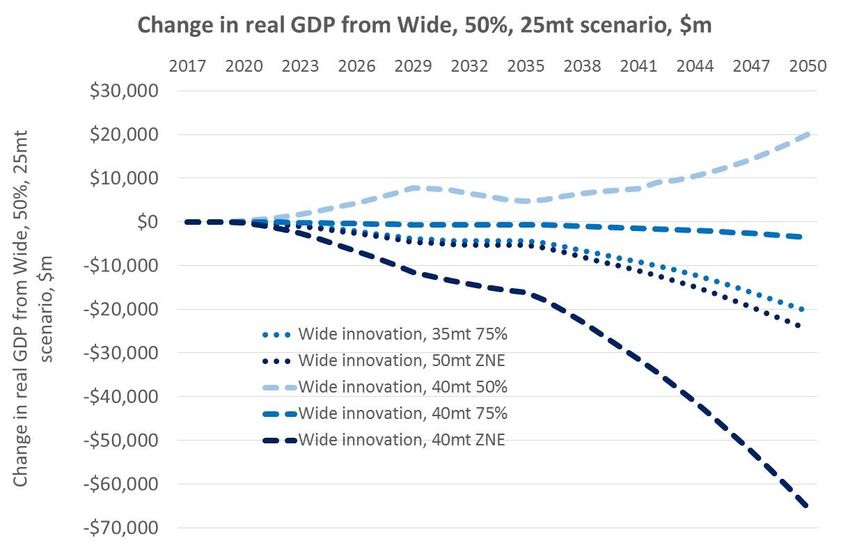
In reality, all discussions about innovation will be conditional on the expected carbon
price. If you look at the innovation assumptions in Table 1 relative to current, low
carbon prices, they look optimistic.
But if – as our modelling indicates – carbon prices will rise substantially to incentivise
firms to move towards lower-emissions production techniques that are consistent with
ambitious emissions targets, then some assumptions we have used might be
considered conservative.
We recognise these limitations to our analysis, but ultimately we have to assume
something, even if we know it’s unlikely to be a perfect approximation of economic
agents’ behaviour.

We explore the economic impacts against a status quo that represents
the current government emissions target of 50% by 2050
It is customary in CGE modelling to compare scenario results against a baseline in
which nothing else changes.
However, it can be argued that the likelihood of the New Zealand economic and
emissions profiles developing as per the baseline assumptions is not high. The
government’s existing stated emissions target for 2050 is for a 50% reduction, and we
would expect policy changes to push us towards that target over time.
Therefore, an alternative way of thinking about economic impacts is to compare the
results for the 75% and ZNE targets against those from the 50% ‘status quo’ target,
rather than the ‘do-nothing’ baseline.
This aligns more closely to the approach that is required for regulatory impact analysis
in New Zealand, where the focus is on the marginal change of policy options from the
status quo, rather than from a do-nothing baseline.
Based on guidance from officials, we refer to the Wide innovation, 50% target as the
status quo in this report.
As Table 1 summarises, this status quo incorporates a considerable amount of
innovation and afforestation, including EV uptake by 2050 of 95% of the light vehicle
fleet and 50% of the heavy vehicle fleet, a methane vaccine phased in between 2030
and 2035, a shift to 98% renewable electricity from 2035, and afforestation of 25Mt
by 2050.
However, given the relatively high carbon prices that our modelling delivers when we
impose ambitious emissions targets, such changes from the situation today are
probably not unreasonable.

NZIER report – Economic impact analysis of 2050 emissions targets                       iv
Key findings
We estimate that moving from the current situation to the status quo
scenario will cost $28 billion by 2050
Taking this comparison against status quo approach assumes that the economy will
look more like the Wide innovation, 50% target scenario than the baseline, and does
not explicitly recognise the costs of getting to the 50% target.
However, our modelling suggests that there will be significant costs involved in getting
to the Wide innovation, 50% target status quo.
We estimate real GDP in the status quo to be $28.0 billion lower than baseline by 2050.
On an annual average basis, this equates to $8.6 billion per year.
Employment will be 1.2% and real wages 6.1% below baseline by 2050.
The marginal impacts reported on below need to be seen as additional to these costs.

Achieving ambitious emissions targets will see real GDP fall by between
an additional $20-80 billion by 2050, compared to the status quo
The real GDP impacts are shown in Figure 1. The impacts, relative to the 2050 status
quo, range from $20.5 billion (4.0%) for the Wide innovation, 75% target scenario to
$85.2 billion (16.8%) for the Energy innovation, ZNE scenario.

Figure 1 Economic impacts of emissions targets compared to status
quo
Change in $ millions from Wide innovation, 50% target scenario

Source: NZIER

The GDP impacts are moderate in the early part of the projection period.
The kinked time profile of the GDP impacts in the Ag innovation and Wide innovation
scenarios demonstrate the economic gains from introducing a methane vaccine

NZIER report – Economic impact analysis of 2050 emissions targets                      v
gradually between 2030 and 2035. The vaccine improves the productivity of the dairy
  and sheep and beef sectors, which temporarily mitigates some of the negative impacts
  of the higher emissions targets.
  This is partly offset by the shift in global demand preferences away from emissions-
  intensive food such as meat and dairy products, and the GDP impacts resume their
  downward trend once the vaccine is fully implemented by 2035.
  The small differences between the 75% and ZNE scenarios in the Ag and Wide
  innovation scenarios, relative to the differences between 50% and 75%, are due largely
  to the forestry assumptions employed. Between 50% and 75%, net sequestration
  increases by 10Mt; between 75% and ZNE it increases by 15Mt, which reduces the
  abatement burden on the rest of the economy.
  Note that, by design, the Energy innovation scenarios do not incorporate any
  significant change in net sequestration, hence their economic costs are considerably
  higher. However, given the high carbon prices this scenario generates, we would
  expect the forestry sector to respond by planting more trees. This would reduce the
  economic costs in the Energy scenarios

  In all core scenarios, the economy continues to grow
  In the baseline, average economic growth between 2017 and 2050 is 2.2%. In all
  scenarios, the average growth rate remains at 1.5% or higher (Table 2).
  Across the core scenarios, the difference between the ZNE target average growth rates
  and the 50% target growth rates is around -0.2%.

  Table 2 Average economic growth across scenarios
  Compound Average Growth Rate in real GDP, 2017-2050

                    Baseline    Ag       Ag       Ag      Energy      Energy   Wide     Wide     Wide

Target                 -        50%      75%      ZNE      50%         ZNE      50%      75%      ZNE

Average GDP per
                     $386      $367     $359     $357     $359        $349     $377     $371     $370
year, $bn

Average GDP
                     2.2%      1.8%     1.6%     1.6%      1.7%       1.5%     2.1%     1.9%     1.9%
growth rate

Difference in av.
growth rate from    +0.17%     -0.24%   -0.41%   -0.44%   -0.37%      -0.57%     -      -0.13%   -0.15%
status quo

Difference in av.
growth rate from       -       -0.41%   -0.58%   -0.61%   -0.54%      -0.73%   -0.17%   -0.29%   -0.32%
baseline

  Source: NZIER

  Households will be better off than they are now, but worse off than
  they would have been in the status quo scenario
  We measure the impacts on households through changes in real Gross National
  Disposable Income (RGDNI) per household.

  NZIER report – Economic impact analysis of 2050 emissions targets                                  vi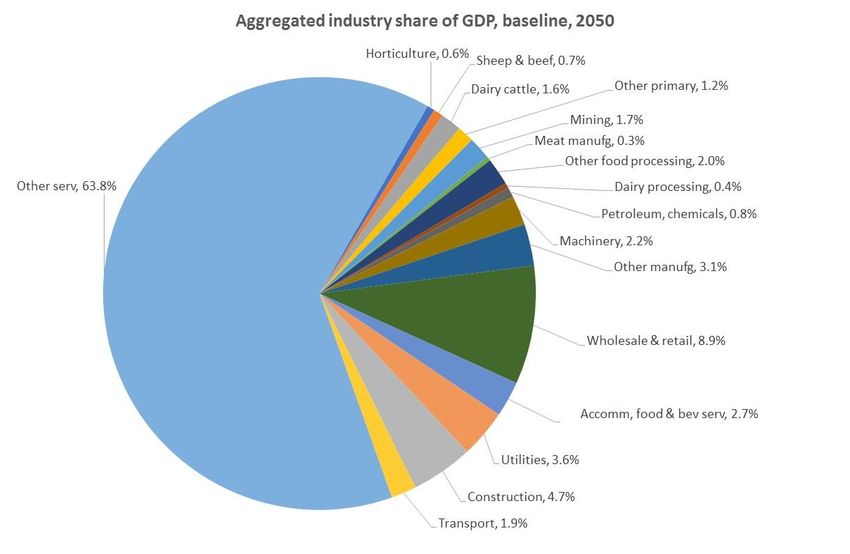
RGDNI is a measure of household welfare as it adjusts changes in GDP (or income) for
movements in export and import prices that affect households’ purchasing power. It
is not the same as household income.
Per-household welfare is projected to be $275,000 in the status quo by 2050. As Figure
2 shows, it will be between $13,600 (4.9%) and $46,800 (13.6%) lower by 2050 for the
ZNE scenarios.
Note, however, that the 2050 level of per-household RGNDI will be higher than the
current level of around $183,000.
On an annual average basis, the per-household RGDNI impacts are shown in Table 3.
For the ZNE scenarios, the per-household annual average RGNDI costs are between
$4,600 and $16,300, compared to the status quo.
Table 3 Welfare impacts per household
Per household RGDNI, annual average, 2017-2050
Scenario Baseline Ag Ag Ag Energy Energy Wide Wide Wide
Target - 50% 75% ZNE 50% ZNE 50% 75% ZNE
Average annual
per-household 232 220 216 215 216 210 226 223 222
RGNDI, $000s
Difference from
+5.2 -6.0 -10.8 -11.7 -10.5 -16.3 - -3.8 -4.6
status quo, $000s
Source: NZIER
These welfare decreases are due to higher costs of goods and services that are pushed
up by higher carbon prices, and a softer labour market outlook.
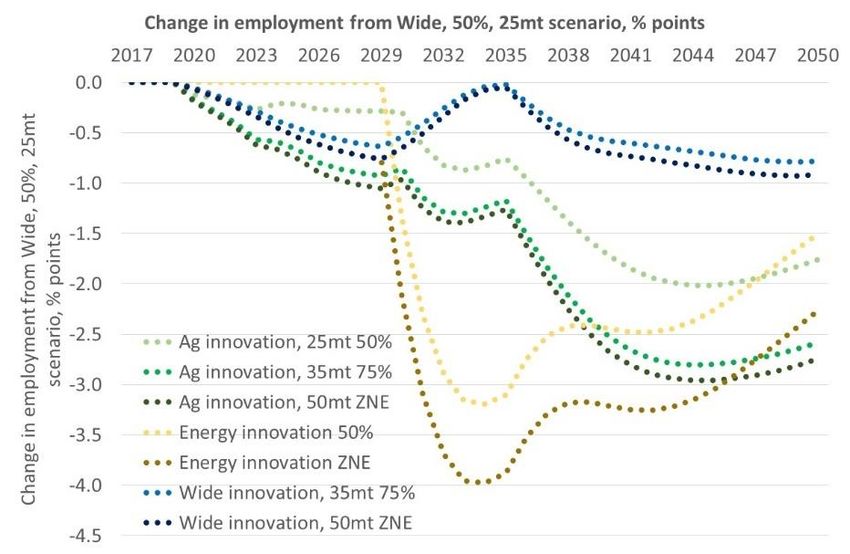
Employment is expected to fall by between 0.9% and 2.7% below the status quo by
2050 in the ZNE scenarios (Figure 3). The lower the target, the lower the employment
impact.
Note that we incorporate expected labour force growth into our baseline scenario, so
these reported employment declines are from a higher level than current
employment:
• In our baseline, employment grows by 22.2% between 2017 and 2050.
• In the status quo, employment grows by 20.7% from 2017.
• In the Wide innovation, ZNE scenario, this growth from 2017 drops
marginally to 19.6%.
We assume labour is able to move freely between industries as they expand or
contract in response to the introduction of emissions targets. Our modelling
framework also pushes employment back towards its baseline over time, with the
lingering effects of weaker labour demand being felt through real wage declines.
The large drop in employment in the Energy innovation scenarios from 2030 occurs
because we are comparing against the Wide innovation, 50% status quo scenario, in
which employment improves when a methane vaccine is introduced in 2030.
Real wages also fall substantially across these core scenarios – by a minimum of 6.7%
below status quo by 2050 for the Wide innovation, 75% target scenario.
NZIER report – Economic impact analysis of 2050 emissions targets viiFigure 2 Household impacts of emissions targets: core scenarios Change from 2050 status quo scenario per household RGNDI of $275,000 Source: NZIER Figure 3 Impact on employment: core scenarios % change from status quo Source: NZIER NZIER report – Economic impact analysis of 2050 emissions targets viii
Lower income households are proportionately harder hit
Modelling carried out by our research partner, Infometrics, using a different CGE
model, indicates that the impacts on households varies considerably by income level.
Figure 4 shows those in the lowest income quintiles (1, 2) are most severely affected –
over twice as much as the average income household in relative terms.
While these household impacts may present challenges during the transition to a
lower-emissions economy, the New Zealand Productivity Commission (2018, p.9) has
recently noted that:
The adverse impact of such [price] increases on the real incomes of
vulnerable households can be offset through the tax and welfare
system.
Existing policies, such as tax credits and benefits, should be
adequate to compensate lower-income households for these
increased costs, provided both are regularly adjusted in line with
inflation.
Figure 4 Impacts of Wide innovation ZNE target scenario on
household spending, by income quintile
% change in real household consumption, relative to 2050 baseline 1
Source: Infometrics
1
NZIER’s model does not have households broken down by income. Because of different model structures and specifications,
the overall consumption decrease result estimated by Infometrics differs from our RGNDI per household impacts. What is
more important here, however, is the relative impacts between income groupings, rather than the precise level.
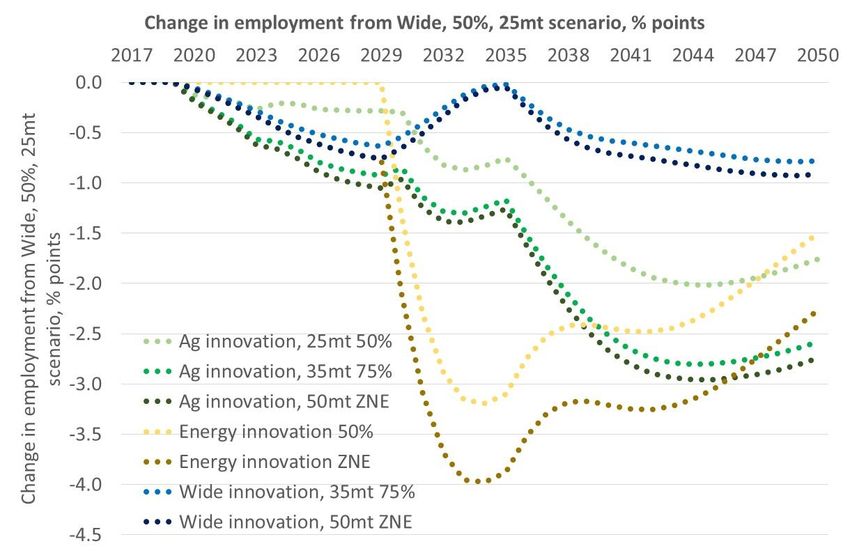
NZIER report – Economic impact analysis of 2050 emissions targets ixCarbon prices will need to lift substantially to meet ambitious targets
The time profile of implied domestic carbon prices that the CGE model solves for under
each combination of scenario and target is shown in Figure 5 and Figure 6.
The implied carbon price is best characterised as an economy-wide average price on
firms’ emissions. They will pay this price when it is lower than the cost of abating.
Before this point on their abatement cost curve, it makes more sense for firms to
switch away from emissions-intensive inputs or production techniques.
If the government seeks to reduce emissions by regulations instead of via an emissions
price, the implied price each firm will face depends on what the government does to
share the cost burden. This would vary across industries. But since we don’t know what
measures the government may take, we simulate an economy-wide price.
The more stringent the emissions target, the higher the carbon price required to
incentivise the behavioural changes necessary to move to a lower emissions economy
(Table 4).
Table 4 Average implied carbon prices
Per tonne CO2-e, average between 2020-2050
Scenario Ag Ag Ag Energy Energy Wide Wide Wide
Target 50% 75% ZNE 50% ZNE 50% 75% ZNE
Av carbon price $386 $568 $605 $612 $845 $109 $243 $272
Source: NZIER
Prices are higher in the Energy innovation scenarios because they do not involve any
additional net sequestration to the baseline. This forces the rest of the economy to
move higher up its collective marginal abatement cost curve to meet any given
emissions target. In addition, the Energy innovation scenarios do not include the
methane vaccine.
The impact of introducing the methane vaccine in 2030 in the Ag innovation and Wide
innovation scenarios is noticeable. It makes abatement in New Zealand much less
costly, and is a clear example of how innovation and R&D in emissions-reduction
technologies will ease the burden of adjusting to climate change.
In the Ag and Wide innovation scenarios, the reduction in export demand for dairy and
sheep and beef products also contributes to lower emissions (and hence lower implied
carbon price).
We discuss the reasons for the differences between our implied carbon prices and
those produced by Vivid, Motu and Concept (2018) below.
NZIER report – Economic impact analysis of 2050 emissions targets xFigure 5 Implied carbon prices – levels $ per tonne CO2-e Source: NZIER Figure 6 Implied carbon prices – differential from status quo $ per tonne CO2-e, relative to status quo scenario Source: NZIER We also consider alternative specifications around the core Wide innovation, ZNE target scenario regarding rest of the world action on climate change, access to international permits and further net sequestration. NZIER report – Economic impact analysis of 2050 emissions targets xi
Sensitivity analysis: Free allocation remains crucial for limiting
competitiveness impacts when the rest of the world does not take
strong action to price carbon
We explore a scenario where the rest of the world does not take strong action on
climate change. In this scenario, New Zealand imposes an emissions target and hence
faces increasing carbon prices, while our competitors do not.2
At first glance, one might expect New Zealand to suffer a considerable loss in export
competitiveness as our exporters face additional costs that their competitors don’t.
However, because we also assume that free allocation of emissions permits to
emissions-intensive, trade-exposed firms continues at current rates, much of this
competitiveness effect is mitigated.
The key macroeconomic impacts in this scenario are hence similar to that of the Wide
innovation scenario with the same ZNE target. Aside from the implied carbon price, a
weak rest of the world response that is mitigated by the continuation of free allocation
very slightly reduces the economic costs of meeting an emissions target.
This highlights the importance of policy settings around free allocation when the
actions of the rest of the world are uncertain.

Figure 7 Effects of weak global action on GDP impacts: Wide
innovation scenario, ZNE target
$ millions change from status quo

Source: NZIER

   2
       Future modelling will refine this scenario, as we will use a global CGE model that allows us to explore different countries
       taking different levels of action to address climate change. In the single-country model used for this report, it is not possible
       to design more nuanced scenarios – the rest of the world (as an aggregate) either takes strong action or it doesn’t.

NZIER report – Economic impact analysis of 2050 emissions targets                                                                    xii
Table 5 Weak global action – summary of economic impacts
Change from status quo, 2050; ZNE target; SA = sensitivity analysis scenario
RoW action Real GDP Average GDP Real GNDI Employment Real wage Average
growth per h/h carbon price
% change, % 2017- 2050 $ change, % change, % change, 2020-2050
2050 2050 2050 2050
Core (strong) -4.9% 1.90% -$13,600 -0.9% -8.0% $272
SA (weak) -4.1% 1.93% -$11,400 -0.8% -7.3% $283
Source: NZIER
Note that despite macroeconomic costs that are slightly lower when the rest of the
World takes weak action, this should not taken as inferring New Zealand is better off
if the rest of the World does nothing. Our single-country model does not capture the
physical impacts of global climate change such as rising sea levels, the costs of
infrastructure damage from more frequent/intensive storm events, etc.
Sensitivity analysis: Our forestry assumptions are critical in determining
economic impacts
Of particular importance when interpreting the results in this report is the response of
forestry to very high carbon prices.
In our model, forestry planting and harvesting is not linked to the carbon price directly.
We have to impose net sequestration on our model rather than letting the model
determine it. This is an important area for future model development.
We take our net sequestration estimates from Vivid, Concept and Motu (2018). Net
sequestration in 2050 increases from 25Mt in the 50% target scenarios to 35Mt in the
75% target scenarios and 50Mt in the ZNE scenarios, to reflect the expected rough
magnitude of the response of forest owners to the higher carbon prices that more
stringent emissions targets would deliver.3
This level of afforestation is considerable. For example, the 50Mt scenario would see
New Zealand’s harvested forestry area increase by around 140% from today’s area.4
However, when carbon prices are in the hundreds of dollars, the likely forestry
response will be even larger than we have imposed on the model, provided there is
suitable land available.
To demonstrate the effects of forestry, we consider the Wide innovation scenario for
the 50%, 75% and ZNE targets with net sequestration constant at 40Mt. We compare
the results against those from our core scenarios, where net sequestration is 25Mt,
35Mt and 50Mt respectively for the three targets.
As would be expected, for the 50% and 75% targets, a higher assumed rate of net
sequestration reduces economic costs considerably (Figure 8 and Table 6):
3
We recognise that this is a simplistic approach. However, given time constraints, endogenising forestry’s response to the
carbon price was not feasible.
4
Inferred from Motu (forthcoming).
NZIER report – Economic impact analysis of 2050 emissions targets xiii• For the 50% target, using 40Mt of net sequestration instead of 25Mt shifts
average annual economic growth between 2017 and 2050 from 2. 1% to
2.2%.
• For the ZNE target in this sensitivity analysis, assuming 40Mt of net
sequestration instead of 50Mt in the core scenario pushes up economic
costs significantly. The change in GDP below status quo in 2050 worsens
from -4.9% in the core scenario to -12.9% in the sensitivity analysis.
• Average annual economic growth between 2017 and 2050 drops from 1.9%
in the core ZNE scenario to 1.6% in the sensitivity analysis ZNE scenario.
This could be thought of as reflecting potential environmental or societal
challenges associated with planting and not harvesting the volume of trees
required to abate 50Mt of CO2-e.
• The average implied carbon price from 2020 to 2050 falls as net
sequestration increases. In the 75% scenarios, moving from 35Mt to 40Mt
reduces the average carbon price from $243 to $131.5
Figure 8 The effect of alternative net sequestration assumptions on
economic impacts
All results are for the Wide innovation scenario; $ millions change in real GDP from status quo
Source: NZIER
5
Note that in the sensitivity analysis for a 50% target, there is so much net sequestration that the rest of the economy is not
forced to abate anything more to reach the target. Hence there is no carbon price required.
NZIER report – Economic impact analysis of 2050 emissions targets xivTable 6 Alternative net sequestration sensitivity analysis – summary
of economic impacts
Wide innovation scenario. Change from status quo, 2050; SA = sensitivity analysis scenario.
Target & net Real GDP Av GDP Real GNDI Employm Real wage Average
sequestration growth per h/h ent carbon
price
% change, %, 2017- $ change, % change, % change, 2020-2050
2050 2050 2050 2050 2050
SA (50%, 40Mt) +3.9% 2.2% +$11,000 +1.0% +6.1% -
Core (75%, 35Mt) -4.0% 1.9% -$11,300 -0.8% -6.7% $243
SA (75%, 40Mt) -0.7% 2.0% -$1,933 -0.2% -1.2% $131
Core (ZNE, 50Mt) -4.9% 1.9% -$13,600 -0.9% -8.0% $272
SA (ZNE, 40Mt) -12.9% 1.6% -$36,000 -2.3% -20.1% $569
Source: NZIER
Another interpretation of this sensitivity analysis is that it provides some insights into
isolating the impact of changing the target, holding innovation and afforestation
assumptions constant. In each of the sensitivity analysis (SA) scenarios in Table 6, net
sequestration is held constant at 40Mt and the innovation assumptions do not change.
Moving from a 75% target to a ZNE target reduces average real GDP growth between
2017 and 2050 by 0.4% and reduces per household RGDNI by $34,100 in 2050.
Sensitivity analysis: access to international permits significantly reduces
the economic impacts
In previous modelling exercises of New Zealand’s climate change policy (see NZIER and
Infometrics 2009, 2011), New Zealand firms had access to international emissions
permits. When the cost of abating domestically was higher than the international
permit price, firms bought permits to minimise costs.
In the core scenarios in this report, we assume no access to permits. We relax this
assumption in this sensitivity analysis, using the Wide innovation, ZNE target as the
comparator core scenario.
We assume, based on guidance from officials, two potential price paths for
international permits:
• $20 today, rising linearly to $50 in 2030, then linearly to $100 by 2050.
• $20 today, rising linearly to $50 in 2030, then linearly to $150 by 2050.
The GDP impacts of allowing trading are shown in Figure 9. The economic costs of
meeting a ZNE target fall sharply with permits trading. This is because firms choose to
buy emissions permits from overseas rather than facing the high domestic abatement
costs implied by imposing a stringent emissions target.
NZIER report – Economic impact analysis of 2050 emissions targets xvFigure 9 Sensitivity analysis: allowing international purchases of
emissions permits
Change in $ millions from status quo; Wide innovation, ZNE target
Source: NZIER
Other results are summarised in Table 7. The economic costs are marginally higher
when the international price is assumed to rise to $150 instead of $100, but both
sensitivity analysis scenarios show significantly lower imposts on the economy than in
the core scenario. Firms are able to avoid the high domestic abatement costs that
occur in the core scenario when no trade is allowed.
Table 7 Permits trading sensitivity analysis – summary of economic
impacts
Wide innovation scenario, ZNE target. Change from status quo, 2050; SA = sensitivity analysis scenario.
Target & net Real GDP Average Real GNDI Employm Real wage Average
sequestration GDP per h/h ent carbon
growth price
% change, %, 2017- $ change, % change, % change, 2020-2050
2050 2050 2050 2050 2050
Core (ZNE, 50Mt, no
-4.9% 1.90% -$13,600 -0.9% -8.0% $272
trade)
SA (ZNE%, 50Mt, trade,
+0.9% 2.08% +$2,400 +0.9% +0.7% $60
price path to $100)
SA (ZNE%, 50Mt, trade,
+0.3% 2.06% +$800 +0.7% -0.2% $73
price path to $150)
Source: NZIER
This sensitivity analysis demonstrates the importance of policy decisions related to
access to international permits.
NZIER report – Economic impact analysis of 2050 emissions targets xviWhile abating all emissions domestically to meet a given 2050 emissions target is more
consistent with a drive to a lower-emissions economy, allowing access to international
permits allows New Zealand Inc to remove the same volume of emissions from the
global atmosphere at a far lower economic cost.
Caution is required in interpreting our results
We note that at the very high carbon prices in some scenarios, it is difficult to be
confident in how firms and households will respond. The implied changes in relative
prices are well beyond the range over which our model has been calibrated.
For example, if someone gets a pay increase of $5,000, their previous patterns of
consumption will give a good approximation of what they will spend this additional
income on. Our model would work well here.
If that person wins $20 million on Lotto, however, they are likely to buy a very different
bundle of goods and services, which would be hard to predict. Our model would be
less useful here.
The same logic applies to carbon prices. If they go up 5%, we have a good idea of how
households and firms will respond. If they go up 200%, it’s hard to predict with
certainty what choices people and businesses would make.
We estimate higher carbon prices than other research suggests…
These implied carbon prices are higher than those estimated by other researchers such
as Vivid, Concept and Motu [VCM] (2018, p.4), who concluded that:
New Zealand is likely to be able to decarbonise its economy at a cost
comparable to that expected in the rest of the developed world…
reach[ing] a more stringent net zero emissions constraint by 2050
with a 2050 emissions price of between NZ$150/tCO2e to
NZ$250/tCO2e.
…due to different model purposes and structures
VCM’s estimates were generated by linking a highly detailed energy and industry
model with a detailed national scale, spatial, partial equilibrium model of rural land
use. This modelling approach generates deep insights into how changes in economic
incentives drive land use change, and how emitting sectors can meet demand at least
cost (VCM, 2018, p.13).
As the authors of that study note (p.14), their bottom-up linked model focuses on
“accurately depicting the incentives and outcomes within their specific sectors of
focus. This means that while they provide a richness of detail that can be lacking in
other models, they are unable to provide estimates of aggregate whole-of-New
Zealand economic cost of different pathways”.
That is, it will not produce macroeconomic results such as GDP, GNDI, employment,
exports, etc., which is what we have been asked to focus on in this report.
VCM’s modelling framework does not incorporate the types of constraints that a CGE
model includes, such as those related to households’ budgets, government spending,
balance of payments, terms of trade, labour and capital constraints.
NZIER report – Economic impact analysis of 2050 emissions targets xviiThese constraints will tend to increase price changes relative to those generated by
partial equilibrium models as there is no ‘escape valve’ in CGE models.
Another difference between the modelling approaches is that in VCM, “emission price
trajectories in the period to 2030 are exogenously determined” (VCM, 2018, p.22).
That is, in the early part of the projection period these prices are assumed, rather than
being outputs of the models.
In contrast, in our CGE approach, the emissions price is endogenously determined in
all years – we let the model solve for the emissions price, given a specific emissions
target and a wide range of other assumptions.
Our models also incorporate different sets of assumptions. For example, the VCM
modelling “pathways constrain the expansion of dairy farming, with no new land
converted to dairying beyond 2025” (VCM, 2018, p.53). This will likely reduce dairy
farming emissions, and hence reduce the required carbon price to meet a given 2050
target, relative to our approach, as we do not apply such a constraint.
None of this is to diminish the value of alternative modelling approaches. The VCM
approach has considerably more detail on land use change than our model, and a much
more granular representation of energy production, for example.
All models have strengths and weaknesses, and for policy issues such as climate
change, there is considerable value in having a range of models to provide different
insights into the main issues in play. The main strength of our approach, for this
research objective, is that it generates whole-of-economy costs.
Structural change will be necessary to meet ambitious emissions targets
Our analysis of the industry impacts of meeting more ambitious 2050 emissions targets
are consistent with the findings of the New Zealand Productivity Commission (2018, p.
10), which concluded that:
An effective transition to a low-emissions economy will mean that
New Zealand will look very different in 2050. During the transition,
action to mitigate GHG emissions will require real and significant
changes. Those changes will have disruptive impacts on some
businesses and households.
Figure 10 shows the modelled changes in industry value-added (the industry
equivalent of real GDP) for the Wide innovation, ZNE scenario.6
There are two key drivers of these results:
1. The income effect – as the economy grows less rapidly under scenarios with
more ambitious emissions targets, there is lower demand for all goods and
services.
2. The substitution effect – industries which are relatively low emissions-
intensive face a lesser cost imposition from high carbon prices. This allows
them to expand, or at least contract less than more emissions-intensive
industries.
6
For the sake of simplicity, we aggregate our database’s 111 industries into 15 broader sectors for reporting these results.
We need to acknowledge the risk of aggregation bias in doing so: within these broad sectors, some industries will be more
affected; others less affected.
NZIER report – Economic impact analysis of 2050 emissions targets xviiiAs would be expected, given the magnitude of carbon price increases required to meet a ZNE emissions target, the industries most affected are those that are emissions- intensive, such as dairy and sheep and beef farming, along with their downstream processing industries. The petroleum and chemicals sector also suffers significant negative adjustment. Note that we do not model any potential change in government assistance to these most-affected industries. The services sectors and some less emissions-intensive machinery and manufacturing are far less affected. Horticulture benefits (in relative terms at least) from our assumed shift in global consumer preferences away from dairy and meat towards lower- emissions foodstuffs. Figure 10 Industry GDP impacts: wide innovation ZNE scenario % change in industry value added from status quo in 2030, 2040, 2050 Source: NZIER Similar patterns of structural change are found in all ZNE scenarios. The magnitude of change is lower with less stringent targets. A more detailed industry disaggregation of the results shows that renewable energy generation industries (geothermal, hydro and wind) expand when emissions targets are imposed. There are also small gains for lower emissions-intensive manufacturing industries such as electrical equipment manufacturing and clothing manufacturing; and services industries such as accommodation, movies and rental services. The forestry and wood processing industries will benefit In addition, we would expect the forestry and wood processing industries to expand considerably if we modelled additional afforestation within the model, rather than imposing it exogenously. NZIER report – Economic impact analysis of 2050 emissions targets xix
In the Wide innovation, ZNE scenario, we assume an additional 50Mt of net
sequestration by 2050. This would represent a 140% increase in the forested harvest
area relative to the current area.7
Based on this expansion, an indicative out-of-model calculation suggests:
       •       The forestry industry would grow from $1.3 billion of value-added in 2017
               to $3.1 billion in 2050 in the Wide innovation, ZNE scenario.
       •       The wood processing industry would grow from $1.3 billion in 2017 to $3.2
               billion in 2050.
       •       Total log and processed wood exports would increase from $3.8 billion in
               2017 to $9.1 billion in 2050.

Additional government support may be required to support workers
who are negatively affected
These significant changes in the structure of the New Zealand economy may require
further policy attention, especially if workers are dislocated from emissions-intensive
industries. While our model allows labour to move between industries as they grow or
contract, albeit with a lag, in practice there are challenges in doing so due to a lack of
transferable skills between industries, geographical ‘stickiness’ of workers, etc.
Recall that we have not explored any specific government policies that could be used
to ease the transitional costs to most-affected industries or households.

What next?
The scope of this stage of the analysis was necessarily limited due to time constraints.
In the next phase of this research, we will seek to consider:
       •       Alternative scenarios that consider the actions of specific countries or
               groups of countries to address climate change concerns, and how this
               affects the economic impacts on New Zealand of meeting 2050 emissions
               targets.
       •       The economic costs of New Zealand inaction on climate change, such as
               changes to crop yields and the costs of infrastructure damage associated
               with more frequent or more intense storms.
       •       The regional economic impacts of meeting emissions targets.
       •       Different combinations of the various assumptions employed in this report,
               or alternative perspectives on innovation beyond those assumed in Table 1.

   7
           This estimated increase in harvested area is inferred from Motu (forthcoming).

NZIER report – Economic impact analysis of 2050 emissions targets                           xx
Contents
Research objectives and methodology ................................................... i
Key findings............................................................................................. v
1. Scope and objectives ...................................................................................... 1
1.1. Objectives ................................................................................ 1
1.2. Scope and caveats ................................................................... 4
2. Overview of methodology .............................................................................. 7
3. Scenario design and targets ......................................................................... 10
4. Results .......................................................................................................... 13
4.1. The choice of counterfactual is important ............................ 13
4.2. Economic impacts of getting to the status quo ..................... 14
4.3. Core scenarios: National GDP impacts .................................. 15
4.4. Household impacts ................................................................ 20
4.5. Export impacts ....................................................................... 21
4.6. Labour market impacts .......................................................... 22
4.7. Implied carbon price .............................................................. 24
4.8. GDP impacts by broad industry ............................................. 28
4.9. Industry impacts at a more detailed level ............................. 33
4.10. Distributional impacts on households ................................... 37
4.11. Sensitivity analysis ................................................................. 38
5. Conclusions and next steps .......................................................................... 44
6. References .................................................................................................... 46
Appendices
Appendix A Baseline development .............................................................................. 48
Appendix B Forestry assumptions in baseline ............................................................. 59
Appendix C Industry emissions assumptions ............................................................... 60
Appendix D Industry aggregation ................................................................................ 62
Figures
Figure 1 Economic impacts of emissions targets compared to status quo ................................. v
Figure 2 Household impacts of emissions targets: core scenarios ........................................... viii
Figure 3 Impact on employment: core scenarios ..................................................................... viii
Figure 4 Impacts of Wide innovation ZNE target scenario on household spending, by income
quintile........................................................................................................................................ ix
Figure 5 Implied carbon prices – levels ...................................................................................... xi
NZIER report – Economic impact analysis of 2050 emissions targets xxiFigure 6 Implied carbon prices – differential from status quo ................................................... xi Figure 7 Effects of weak global action on GDP impacts: Wide innovation scenario, ZNE target ................................................................................................................................................... xii Figure 8 The effect of alternative net sequestration assumptions on economic impacts ....... xiv Figure 9 Sensitivity analysis: allowing international purchases of emissions permits ............. xvi Figure 10 Industry GDP impacts: wide innovation ZNE scenario .............................................. xix Figure 11 Economic impact of getting to the status quo of a 50% emissions reduction target by 2050 ........................................................................................................................................... 15 Figure 12 GDP impacts in 2050 against status quo – levels....................................................... 17 Figure 13 Average economic growth, 2017-2050 ...................................................................... 18 Figure 14 GDP growth differentials from baseline and status quo ........................................... 19 Figure 15 Change in household welfare .................................................................................... 20 Figure 16 Impacts on export volumes – levels .......................................................................... 21 Figure 17 Impacts on export volumes – % ................................................................................. 22 Figure 18 Impact on employment ............................................................................................. 22 Figure 19 Impact on real wages ................................................................................................. 23 Figure 20 Employment impacts compared against baseline ..................................................... 23 Figure 21 Implied carbon price .................................................................................................. 24 Figure 22 Composition of economy by broad industry ............................................................. 28 Figure 23 Industry GDP impacts for Ag, Energy and Wide innovation scenarios, ZNE target compared to status quo ............................................................................................................ 30 Figure 24 Industry GDP impacts for Ag, Energy and Wide innovation scenarios, ZNE target compared to baseline ................................................................................................................ 31 Figure 25 Change in industry value added from 2017 ............................................................... 32 Figure 26 Detailed industry results for Wide innovation, ZNE target scenario - levels ............. 35 Figure 27 Detailed industry results for Wide innovation, ZNE target scenario - % change ....... 36 Figure 28 Impacts on household consumption: wide innovation, ZNE target .......................... 37 Figure 29 Sensitivity analysis: allowing international purchases of emissions permits ............ 38 Figure 30 Effects of weak global action on GDP impacts: Wide innovation scenario, ZNE target ................................................................................................................................................... 41 Figure 31 The effect of alternative net sequestration assumptions on economic impacts ...... 43 Figure 32 Baseline macroeconomic projection ......................................................................... 49 Figure 33 Economic activity by broad sector in baseline projection ......................................... 50 Figure 34 Baseline emissions projection ................................................................................... 55 Figure 35 Emissions by broad sector in baseline projection ..................................................... 55 Figure 36 Historical and projected emissions intensity by industry .......................................... 56 Tables Table 1 Overview of scenarios .................................................................................................... iii Table 2 Average economic growth across scenarios .................................................................. vi Table 3 Welfare impacts per household .................................................................................... vii Table 4 Average implied carbon prices........................................................................................ x Table 5 Weak global action – summary of economic impacts ................................................. xiii Table 6 Alternative net sequestration sensitivity analysis – summary of economic impacts ... xv Table 7 Permits trading sensitivity analysis – summary of economic impacts ......................... xvi Table 8 Overview of scenarios ..................................................................................................... 2 Table 9 Scenario description ..................................................................................................... 10 Table 10 Overview of targets in core scenarios ......................................................................... 12 Table 11 GDP impacts in 2050 – levels ...................................................................................... 16 Table 12 GDP impacts in 2050 – % ............................................................................................ 16 NZIER report – Economic impact analysis of 2050 emissions targets xxii
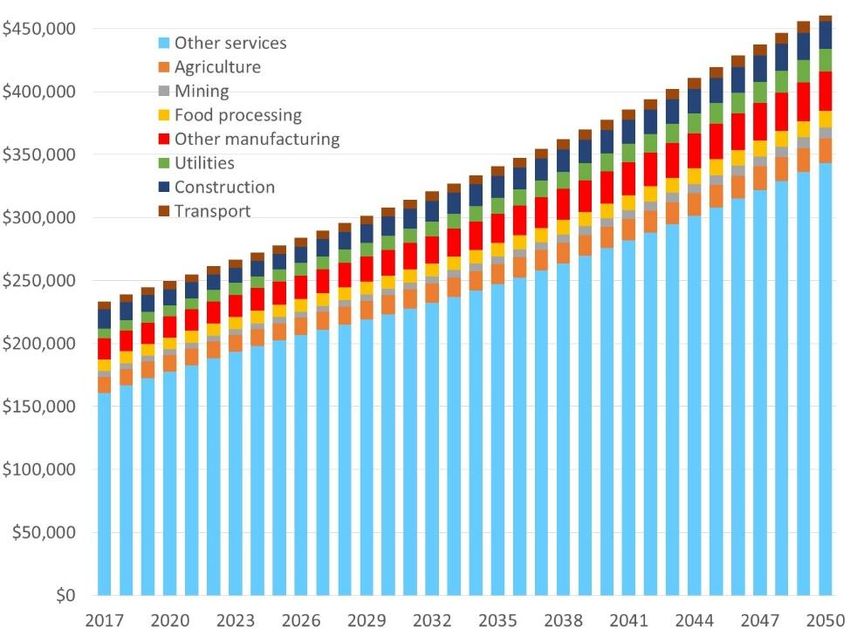
Table 13 GDP impacts – annual averages .................................................................................. 16
Table 14 GDP indicators ............................................................................................................ 17
Table 15 Per household welfare impacts in 2050 against status quo ....................................... 21
Table 16 Average implied carbon prices.................................................................................... 25
Table 17 Carbon price in 2030 and 2050 ................................................................................... 25
Table 18 Differential in carbon price from status quo............................................................... 26
Table 19 Permits trading sensitivity analysis – summary of economic impacts ........................ 39
Table 20 Weak global action – summary of economic impacts ................................................ 41
Table 21 Alternative net sequestration sensitivity analysis – summary of economic impacts . 43
Table 22 Baseline economic growth projections ....................................................................... 49
Table 23 Sector-specific baseline emissions assumptions sources ........................................... 51
Table 24 Summary of Workstream 1 baseline emissions assumptions ..................................... 58
Table 25 Forestry’s contribution to 2050 target, baseline scenario .......................................... 59
Table 26 Farming assumptions .................................................................................................. 60
Table 27 Energy efficiency assumptions .................................................................................... 61
Table 28 Mapping of input-output table industries into 15 broad aggregate industries .......... 62

NZIER report – Economic impact analysis of 2050 emissions targets                                                                xxiii
1. Scope and objectives
1.1.          Objectives
The task: estimate the economic impacts of meeting 2050 emissions
targets
The Ministry for the Environment has commissioned NZIER, with assistance from
Infometrics, to explore the economic impacts of New Zealand adopting a new 2050
emissions target.
We were asked to:
     •     consider a number of potential 2050 targets
     •     take into account expected and potential mitigation opportunities in New
           Zealand
     •     explore the distribution of economic impacts at the industry and household
           levels
     •     consider the implications of international developments to address climate
           change on New Zealand’s export competitiveness and the wider economy.
This project comprises two workstreams. Workstream 1 focuses on the domestic
aspects of climate change – what can New Zealand do to meet potential 2050
emissions targets? Workstream 2 will then explore the implications for New Zealand’s
economy of different degrees of other countries’ action or inaction on climate change,
as well as regional economic impacts.
This report covers only Workstream 1.

We use a dynamic CGE model to examine these economic impacts
We use a newly-developed dynamic Computable General Equilibrium (CGE) model of
the New Zealand economy for Workstream 1. This single-country model contains
economic and emissions projections to 2050 for 111 industries and 15 regions in New
Zealand.
As noted in NZIER and Infometrics (2009, p. 3), “The most important advantage of CGE
modelling is that it considers how policy shocks affect the allocation of resources
between all sectors and markets in an economy. This is essential if we are to get a good
macroeconomic understanding of how policy changes might affect the structure of an
economy”.
A CGE modelling approach is useful for comparing different scenarios about what may
happen in the future, using a consistent theoretical framework and the same sets of
data, parameters and assumptions.

We consider three core scenarios comprising a range of innovation and
technology developments
We estimate the economic impacts of three core scenarios against three emissions
targets. These economic impacts are compared against a status quo scenario to 2050

NZIER report – Economic impact analysis of 2050 emissions targets                       1
You can also read