WIDESEE: Towards Wide-Area Contactless Wireless Sensing - Zheng ...
←
→
Page content transcription
If your browser does not render page correctly, please read the page content below
W IDE S EE: Towards Wide-Area Contactless Wireless Sensing

                         Lili Chen†,‡ , Jie Xiong§ , Xiaojiang Chen†,‡ , Sunghoon Ivan Lee§ , Kai Chen†,‡
                                Dianhe Han†,‡ , Dingyi Fang†,‡ , Zhanyong Tang†,‡ , Zheng Wang$
                                   † Northwest       University, ‡ International Joint Research Centre for Battery-free IoT
                                                 § University  of Massachusetts Amherst, $ University of Leeds
ABSTRACT                                                                                      1   INTRODUCTION
Contactless wireless sensing without attaching a device to the tar-                           Besides traditional data communication functions, in recent years,
get has achieved promising progress in recent years. However, one                             wireless signals have been employed for sensing and have enabled
severe limitation is the small sensing range. This paper presents                             diverse new applications including indoor navigation [22, 51, 54],
W IDE S EE to realize wide-area sensing with only one transceiver                             health monitoring [9, 39], and human-computer interactions [14].
pair. W IDE S EE utilizes the LoRa signal to achieve a larger range of                        Wireless sensing relies on analyzing the characteristics of the signal
sensing and further incorporates drone’s mobility to broaden the sens-                        reflected from the target to understand the contextual information of
ing area. W IDE S EE presents solutions across software and hardware                          one’s interest (e.g., localization). A wide range of wireless signals
to overcome two aspects of challenges for wide-range contactless                              have been exploited for contactless sensing (i.e., without attaching
sensing: (i) the interference brought by the device mobility and                              any device to the target objects), including ultrasound and various
LoRa’s high sensitivity; and (ii) the ambiguous target information                            types of radio frequency (RF) signals (e.g., WiFi and RFID). The RF
such as location when employing just a single pair of transceivers.                           signals attract particular attention in real-world sensing applications
We have developed a working prototype of W IDE S EE for human tar-                            since they do not require to secure a Line-of-Sight (LoS) between
get detection and localization that are especially useful in emergency                        the device and targets as opposed to conventional camera-based
scenarios such as rescue search, and evaluated W IDE S EE with both                           systems [37], and have stronger penetration capability compared to
controlled experiments and the field study in a high-rise building.                           acoustic signals [43, 50].
Extensive experiments demonstrate the great potential of W IDE S EE                              Although promising, one evident issue with existing RF-based
for wide-area contactless sensing with a single LoRa transceiver pair                         sensing is its limited sensing range, which hinders its applications
hosted on a drone.                                                                            in wide-area sensing such as disaster rescue. This is mainly because
                                                                                              the signals reflected from the target, which contain information
CCS CONCEPTS                                                                                  related to the context of the target, are much weaker than the direct-
                                                                                              path signals between the transmitter and receiver. The fact that
• Human-centered computing → Ubiquitous and mobile com-
                                                                                              wireless sensing captures information from the reflected signals
puting; • Hardware → Communication hardware, interfaces and
                                                                                              makes the sensing range much smaller compared to when the signals
storage.
                                                                                              are used for communication purposes. For example, the current
                                                                                              WiFi-based systems are only capable of performing sensing in a
KEYWORDS                                                                                      room-level range (i.e. approximately 3-6 m) [26, 51], whereas RFID
Wide-area; Wireless sensing; LoRa; Mobility                                                   or mmWave-based systems show an even smaller sensing range of
                                                                                              1-3 m [27, 47, 55].
ACM Reference Format:
                                                                                                 Recently, efforts have been made to extend the contact sensing
Lili Chen†, ‡ , Jie Xiong§ , Xiaojiang Chen†, ‡ , Sunghoon Ivan Lee§ , Kai
Chen†, ‡ and Dianhe Han†, ‡ , Dingyi Fang†, ‡ , Zhanyong Tang†, ‡ , Zheng                     range of RF signals [11, 24, 56, 57]. Ashutosh et al. introduced an
Wang$ . 2019. W IDE S EE: Towards Wide-Area Contactless Wireless Sensing.                     approach to employ multi-hop nodes to track the sensor attached tar-
In The 17th ACM Conference on Embedded Networked Sensor Systems                               gets that are located deep inside a building structure [11]. In another
(SenSys ’19), November 10–13, 2019, New York, NY, USA. ACM, New York,                         example, Ma et al. leveraged drones to relay sensing information,
NY, USA, 13 pages. https://doi.org/10.1145/3356250.3361931                                    which extends the sensing range from 5 m to 50 m [57]. Employing
                                                                                              multiple devices or multi-hop transmission schemes can increase
                                                                                              the sensing coverage range. However, these approaches require a
                                                                                              complicated process of sensing infrastructure deployment and could
Permission to make digital or hard copies of all or part of this work for personal or
                                                                                              be vulnerable to changes or failure of even a single device, which
classroom use is granted without fee provided that copies are not made or distributed         make them unsuitable for emergency rescue applications.
for profit or commercial advantage and that copies bear this notice and the full citation        In this paper, we present W IDE S EE– a contactless wireless sens-
on the first page. Copyrights for components of this work owned by others than ACM
must be honored. Abstracting with credit is permitted. To copy otherwise, or republish,       ing system based on the emerging LoRa technology with only a
to post on servers or to redistribute to lists, requires prior specific permission and/or a   single transceiver pair. W IDE S EE is designed to push the bound-
fee. Request permissions from permissions@acm.org.                                            ary of wide-area sensing. Our key insight is that the low-power,
SenSys ’19, November 10–13, 2019, New York, NY, USA
© 2019 Association for Computing Machinery.
                                                                                              long-range wireless communication capability of LoRa offers a long
ACM ISBN 978-1-4503-6950-3/19/11. . . $15.00
https://doi.org/10.1145/3356250.3361931
SenSys ’19, November 10–13, 2019, New York, NY, USA                                                                                 Chen et al.

propagation distance (i.e., several kilometers) and a strong penetra-
tion capability through obstacles, which in turn can be employed to
significantly increase the sensing range compared to other wireless
technologies. In this work, as a proof-of-concept, we explore the
opportunities and limitations of the LoRa technology for non-contact
human detection and localization in wide-area scenarios. To further
increase the sensing area coverage, we leverage the mobility of a
drone to carry the transceiver and move around the target area to
perform wireless sensing. As we demonstrate later in this paper, we
successfully realize building-scale, through-wall sensing to detect       Figure 1: Motivation example of W IDE S EE: a building-scale hu-
and localize human targets. We believe the proposed study is partic-      man target sensing scenario.
ularly useful for human target sensing (detection and localization)
for applications in urban search and rescue missions.
    Translating our high-level idea into a functional system, however,    identify at which room the human target locates in many typical
is nontrivial due to a number of challenges. First, the larger sensing    building structures. This is a promising result considering we use
range of LoRa also means the interference range is also larger due        only a single transceiver pair, and the target moves most of the time
to the higher signal receiving sensitivity. Second, a transceiver pair    in a large environment. We hope this study can encourage further
equipped with a single antenna does not provide us sufficient infor-      research in exploiting wide-area wireless sensing in detecting and
mation regarding the target location since the number of unknown          tracking human targets to enable applications like disaster rescue
variables is greater than that of the constrained equations for local-    search and security surveillance [48]. The main contributions of this
ization. Third, although employing a drone can increase the sensing       paper can be summarized as followings:
coverage, the vibration introduced by the drone during its operation          • We present a contactless system for sensing human targets in
(i.e., flying) affects the resultant signals and accordingly the target         a wide area using just one transceiver pair, by combining the
sensing performance.                                                            agility of drone with the long-range propagation characteristic
    To address the aforementioned challenges in wide-range sensing,             of LoRa.
we introduce solutions across the software and hardware stacks. To            • We introduce new algorithms and design methodologies across
tackle the interference brought by LoRa’s high sensitivity, we re-              the software and hardware stacks to effectively tackle a series
design the antenna system and the sensing algorithm. Specifically,              of interference issues when applying LoRa and a flying drone
we employ a compact, reconfigurable directional antenna at the re-              for wide-range sensing, and to address the sensing ambigu-
ceiver to narrow down the target sensing region. Our system can                 ity issue when only one single transceiver pair is employed.
quickly (i.e., within 10 ms) switch the radiation pattern with a narrow         The proposed techniques are generally applicable, and can be
beamwidth of 48◦ . Such a design allows W IDE S EE to stay focus                applied to other wireless sensing tasks.
on the area of interests and reduce the impact of interference. To            • We demonstrate, for the first time, building-scale, through-
further eliminate the multipath effect within the sensing area, we              wall contactless wireless sensing can be achieved with just
take a unique approach to first extract the direction-related infor-            one LoRa transceiver pair together with a drone.
mation from available time-series of amplitudes and then use the
information to isolate the target path from the interfering multipath.    2 BACKGROUND AND OVERVIEW
As a departure from the commonly used angle-of-arrival (AoA) or
time-of-flight (ToF)-based methods, our design avoids the pitfall of      2.1 LoRa Technology
relying on accurate channel phase information and large bandwidth,        LoRa offers a long communication range for up to several kilome-
which are unfortunately not available on LoRa.                            ters [45] with the ability to decode signals as weak as −148 dBm.
    To reduce the ambiguities in localization, we build analytic mod-     While the ability of decoding weak signals is beneficial for long
els that can predict and determine target locations. This is based        range communications, it makes LoRa more likely to suffer inter-
on our key observations that the speed of the moving target (e.g.,        ference from uninterested area in sensing. Even using a directional
humans) is relatively constant and the resulting trajectory is smooth     antenna at the receiver, there still exist strong multipath effects [30]
within a short period of time (e.g., < 1 s). We model the signal char-    within the detectable area that greatly affect the sensing accuracy.
acteristics of the (vibration) noise and human target movements in        Much effort has been made to similar problems associated with mul-
frequency domain and filter out the vibration artifacts on the received   tipath effects in other RF signals (e.g., WiFi [49] or RFID [58]) or
signals to improve the sensing accuracy.                                  acoustic signals [43], which are based on AoA or ToF information
    We integrate the proposed techniques to implement a working           of the received signals. However, such information requires accu-
prototype and deploy it to detect and localize human targets in three     rate channel phase readings and clock synchronization between the
different real-world environments: an open square, an underground         transmitter and receiver, both of which are unavailable on LoRa.
parking garage, and a high-rise building structure with a size of            In this work, instead of making efforts on obtaining AoA or ToF
20 × 42 × 85 m3 . Our experimental results show that W IDE S EE           to tackle the multipath effects, we consider a approach to leverage
can effectively detect and localize human targets using just one          the received (albeit susceptible) signal strength (i.e., amplitude) for
transceiver pair. For 90% of the test cases, the localization error       effectively addressing the inherent issue of multipath effects. This is
of W IDE S EE is within 4.6 m. Such accuracy would allow one to           described in Section 3.3.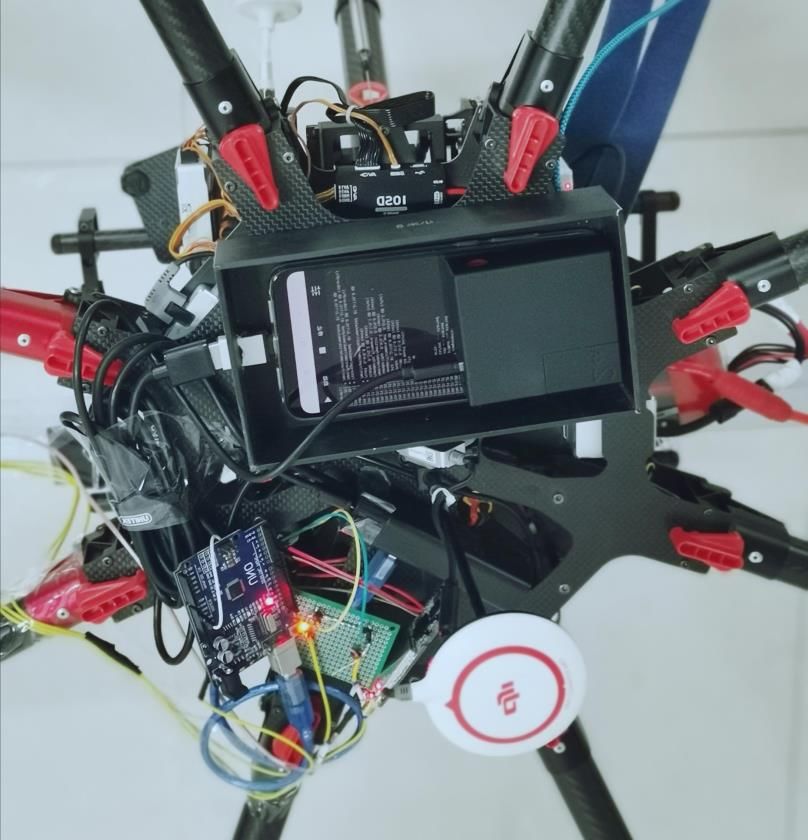
W IDE S EE: Towards Wide-Area Contactless Wireless Sensing SenSys ’19, November 10–13, 2019, New York, NY, USA
Data collection and antenna control system Parasitic Driven Switch
patch patch
RF line
Transmitter (connected to device)
Feed
point
Top Bottom
Reconfigurable
antenna system
(Receiver) Figure 3: The fabricated antenna system on the receiver side.
Remote data
processing
platform direction and radiation pattern quickly. Our design is detailed
at Section 3.1.
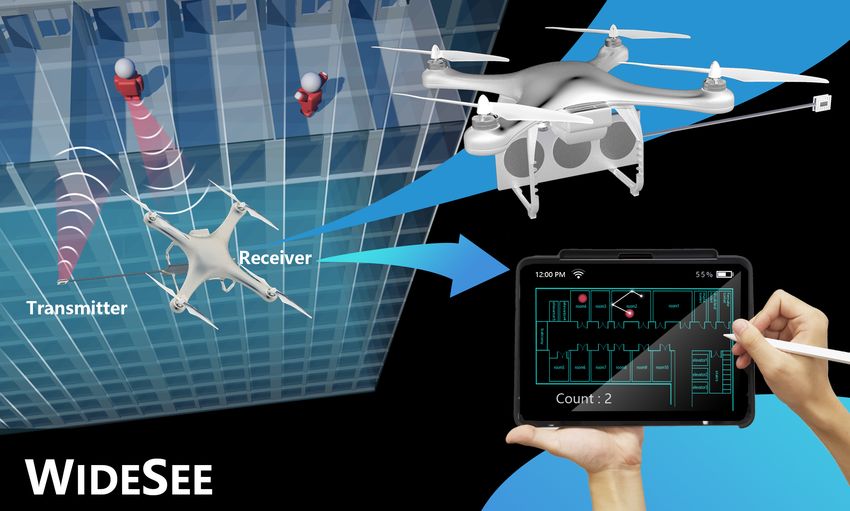
Figure 2: Overview of W IDE S EE. We use a drone to carry the • A data collection and antenna control system, which includes
LoRa transceiver pair and its control system. The data are sent a LoRa transceiver pair, a data collection subsystem, and a
back to the remote data processing platform to perform real- drone. The drone carries the LoRa transceiver pair and the
time target detection and localization. data collection subsystems to fly around the target region. The
collected LoRa signal data are sent back to a laptop (through
a LTE network) to be processed on the ground. The antenna
control system employs an Arduino board carried by the
2.2 Motivation and Problem Scope
drone to configure the antenna radiation pattern accordingly.
As depicted in the conceptual illustration in Figure 1, W IDE S EE The details are described in Section 3.2.
could be used to target emergency scenarios, such as disaster res- • A target detection and localization system, which runs on
cue and terrorist search in (high-rise) building structures. In these a data processing platform, i.e., a laptop in our case. The
scenarios, identification of the presence of human targets and their system analyzes the collected data to detect and localize the
locations is of high importance, but doing so is challenging because human target. This is discussed in detail in Section 3.3.
(a) the localization sensing infrastructure (e.g., surveillance cameras)
may not be readily available or has been destroyed, and (b) visual 3 SYSTEM DESIGN OF WIDESEE
inspection of human targets is restricted if not impossible. W IDE S EE
W IDE S EE leverages LoRa’s long communication range and high
is designed to offer decision supports in such difficult settings.
penetration capability for sensing targets that are within a wide area
In our application of human sensing, we aim to achieve the fol-
or deep inside building structures. As discussed in Section 2.1, this
lowing two goals. The first is to detect the existence of human targets.
advantage also brings in more interference from uninterested objects
The second is to identify the target’s location if a presence is de-
due to the larger sensing range. Overcoming this limitation requires
tected. We do not consider a multiple-device or multi-hop transmis-
novel design methodologies, analysis and processing algorithms.
sion scheme, because such a strategy requires a careful and complex
setup process, which is often infeasible in emergency situations. As
a proof-of-concept, W IDE S EE is designed to be capable of detecting
3.1 Reconfigurable Antenna System
the presence of multiple human targets located in different rooms in To reduce the interference, we look for innovations at the antenna
the same building, but only localizing one target at a time. We leave side. Our first intuition is to employ a directional antenna at the
the simultaneous localization of multiple targets as our future work. receiver to narrow down the sensing region. However, commonly
used horn directional antennas such as RFMAX [5] have a fixed
2.3 Overview of W IDE S EE radiation pattern and mechanically rotating the antenna orientation
to focus on a region is too slow. Furthermore, the beamwidth offered
W IDE S EE is a wide-range contactless human target sensing system by a horn antenna is usually not narrow enough [5]. An alternative is
built upon a single LoRa transceiver pair. The transceiver pair (both to use a phased-array antenna that can change the radiation pattern
the transmitter and receiver) is carried by a drone so that W IDE S EE by adjusting the amplitude and phase of each antenna element, to
can scan and sense a large area by flying the drone. Having a small, achieve fast scanning with narrower beams [19, 25]. However, there
lightweight design for W IDE S EE is essential to maintain a good is a problem for using a phased-array antenna with LoRa. The LoRa
endurance for the battery-powered drone. signal has a wavelength of 33 cm and to achieve a 25◦ beamwidth,
W IDE S EE operates by first transmitting the LoRa signal, and then the linear array will have a size of approximately 2 m. The resulted
capturing and analyzing the received resultant signal from the direct antenna design is not only expensive, but also too bulky to be fitted
signal path and reflections off the target and surrounding objects. on a domestic drone.
To detect the presence of a human target, W IDE S EE models how We wonder if we could bring together the advantages of horn
a human activity like breathing, waving or ambulating affects the antenna (small size and low cost) and phased array (high resolution
power spectral density (PSD) of the received signal. W IDE S EE then and scanning speed). In answer, we adopt a reconfigurable antenna
tries to locate a detected human target by extracting and analyzing approach [12], which is capable of switching the radiation pattern
the target’s direction-related information. As depicted in Figure 2, and frequency properties through adjusting its internal current flow
W IDE S EE consists of three innovative components: distribution to offer a narrow beamwidth.
• A compact, reconfigurable antenna system to reduce the in- Specifically, we choose to use a parasitic-planar-patch antenna [29]
terference from uninterested areas. To prevent moving targets for our reconfigurable antenna design. Figure 3 shows our recon-
from being missed, the antenna should be able to adjust its figurable antenna implementation that is used at the receiver side,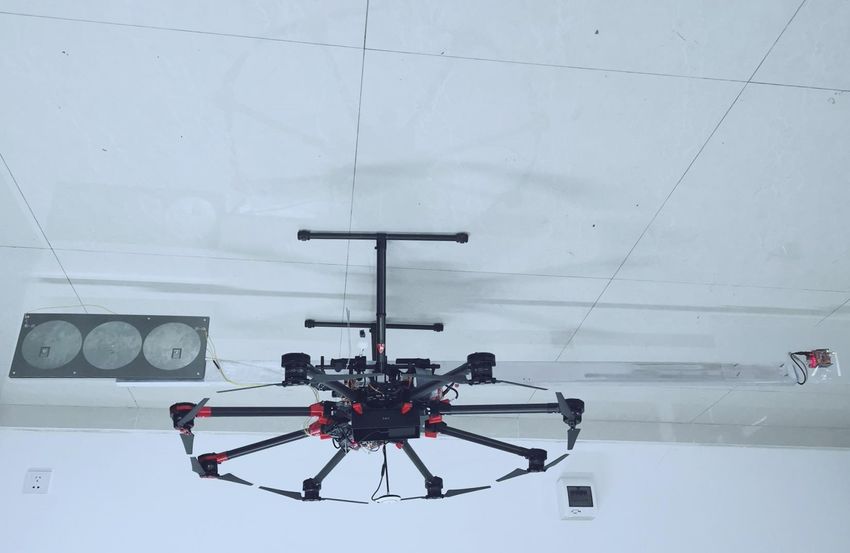
SenSys ’19, November 10–13, 2019, New York, NY, USA Chen et al.
0 0 0
Arduino LimeSDR
-5 -5
board
dB(S(1,1))
dB(S(1,1))
dB(S(1,1))
-10
-5
-10
mini
-15
-10
-15 Antenna
-20
0.896 0.926 0.892 0.928
-20
0.896 0.926
LimeSDR-mini
-25
0.8 0.85 0.9 0.95 1
-15
0.8 0.85 0.9 0.95 1
-25
0.8 0.85 0.9 0.95 1 + Antenna
Frequency (GHz) Frequency (GHz) Frequency (GHz) control board
(a) (b) (c) +Smartphone
LoRa
node
Smart Power
Tx Rx phone bank
(a) The transceiver pair (b) Data collection and control
Figure 5: We use a DJI S1000 to carry the LoRa transceiver
(d) (e) (f) pair (a) and the data collection/control subsystem (b).
0 0 0
-30 30 -30 30 -30 30
-3.00 -3.00 -3.00
10 ms. We empirically determined this switching frequency which is
-60 60 -60 60 -60 60
-90 90 -90 90 -90 90 sufficient for sensing human targets. This is based on the observation
-120 120 -120 120 -120 120
that the human body movements often have a frequency less than
-150 150 -150 150 -150 150
10 Hz [17].
-180 -180 -180
(g) (h) (i) Table 1 compares our antenna system (in three different modes)
against a similar-sized RFMAX [5] – a widely used horn directional
Figure 4: Frequency and radiation properties of our reconfig- antenna. From the table, we see that the frequency range and gain of
urable antenna system. Here (a-c), (d-f) and (g-i) respectively our antenna system for the three modes are comparable to those of
represent the frequency property, radiation pattern and nor- RFMAX, but our design has the advantages of offering quick radia-
malized radiation pattern of mode1-3. tion pattern switching and a narrower beamwidth. These advantages
make our antenna system more suitable for target sensing with LoRa.
Table 1: Properties of our antenna system and a similar-sized
Note that, the total radiation angle range of our system is twice
RFMAX [5] – a popular horn directional antenna.
RFMAX’s, and the radiation pattern switching is much quicker (
i.e., 10 ms) than horn antenna which requires mechanical rotation
Frequency Gain Beamwidth Size for direction change.
range (MHz) (dBic) (at 3 dB) (cm 3 )
W IDE S EE (mode 1) 896-926 9.2 48◦
W IDE S EE (mode 2) 892-928 8.8 45◦ 20 × 50 × 1 3.2 Data Collection and Antenna Control System
W IDE S EE (mode 3) 896-926 9.2 48◦
RFMAX 902-928 9 70◦ 26 × 26 × 5
As depicted in Figure 2, we use a consumer drone to carry the
transceiver pair and its control and data collection modules.
which consists of a driven patch in the center and two parasitic 3.2.1 Transceiver pair. Our LoRa transceiver pair is shown in
patches on both sides. Beam steering is achieved by manipulating Figure 5 (a). We use an off-the-shelf device, Semtech SX1276 [6],
the status of the parasitic patches to act either as reflectors (when with an omnidirectional antenna as the LoRa signal transmitter. The
shorted to ground) or directors (when not shorted to ground). The transmitter sends signals in a continuous mode at 890 MHz frequency
radius of each patch is 78 mm. Two shorting pins are shorted to – the best working frequency of our reconfigurable antenna system.
ground from each parasitic patch, to ensure that the currents can At the receiver end, we use LimeSDR-mini (a software defined radio
flow from the parasitic patches to the ground according to the RF board [4]) as the LoRa gateway to collect signal at a sampling rate
switching configuration. Two SMP1345 PIN diode switches are sol- of 250 KHz through running the GNU radio software development
dered on the parasitic patch layer close to each of the shorting pins toolkit [2]. We connect the board to our reconfigurable antenna (see
and the RF/direct-current (DC) input. Each diode occupies a small Section 3.1) through one of its RF connectors, and to an Android
space of around 2 × 2 mm. The PIN diode is achieved by using a smartphone (with 8G of RAM and 128G of storage) via a USB 3.0
resistance (1.5 Ω) and a capacitor (1.5 pF ) for ON and OFF states, port.
respectively. The resulting antenna system is small (20 × 50 cm) and The receiver end works as follows. After initializing the LimeSDR-
has a comparable weight to a similar-sized horn directional antenna mini board, the antenna control software running on the Arduino
(< 1 kд), but has the advantage of quickly switching the radiation board continuously switches among the three radiation modes of
patterns. It costs us less than 300 USD to build the antenna and its the antenna, at a frequency of 10 ms. The LimiSDR-mini board
control system, and we expect the price to be significantly reduced collects the signal samples at each radiation mode, which are read by
during massive production. the smartphone to be transferred (labeled with the radiation modes)
Figure 4 shows the frequency and radiation properties of our to a laptop via LTE connection for data processing. In this way,
antenna system. Our current implementation supports three different W IDE S EE can detect and localize targets within an interested area
radiation modes. We use an Arduino board to switch between the covered by each radiation mode. Note that it is possible for our target
three modes in a round-robin fashion, where switching occurs every detection and localization algorithms to run on the smartphone or an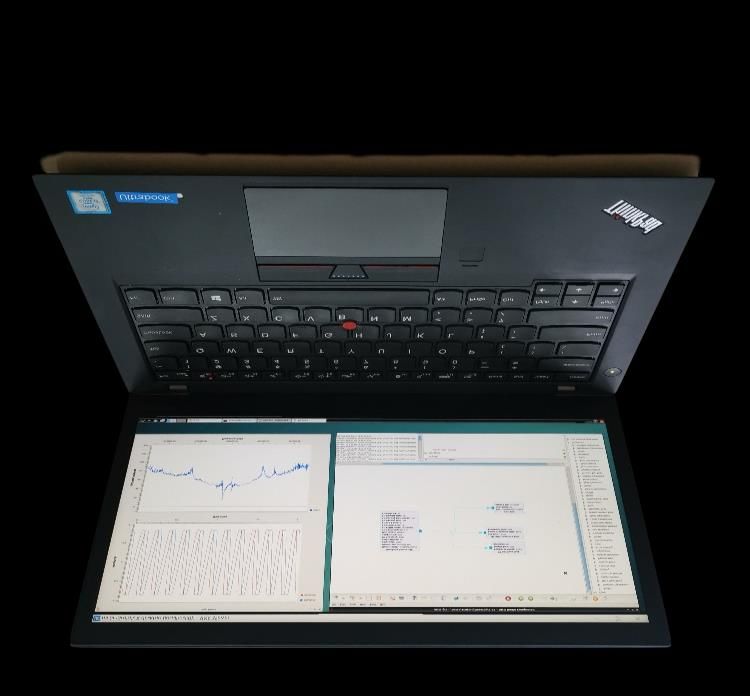
W IDE S EE: Towards Wide-Area Contactless Wireless Sensing                                     SenSys ’19, November 10–13, 2019, New York, NY, USA

                                                                                               1                                               1                                                1

                                                                             Normalized PSD

                                                                                                                             Normalized PSD

                                                                                                                                                                              Normalized PSD
                                                                                              0.5                                             0.5                                              0.5

                                                                                               0                                               0                                                0
                                                                                                    0        2.5         5                          0      1    2     3   4                          0    0.5   1   1.5   2
                                                                                                        Frequency (Hz)                                   Frequency (Hz)                                  Frequency (Hz)

                                                                                                (a) Ambulating.                                         (b) Waving.                                  (c) Stationary.
      (a) Without human target.       (b) With a moving human target.
                                                                             Figure 7: Frequency distribution of signal changes caused by
Figure 6: Comparison of the PSD of the received signal when                  three states of a human target. Different states lead to different
there exists no human target (a) and a moving target (b). The                signal frequency distributions.
PSD patterns in two scenarios differ significantly. W IDE S EE ex-
ploits this observation to detect the presence of human targets.
                                                                             of a human body movement (< 10 Hz). Therefore, we first use a low-
embedded device to remove the need of data transfer, and we leave            pass filter (i.e., second-order Butterworth low pass filter with a cutoff
this as our future work.                                                     frequency of 10 Hz) to remove the high-frequency motion artifacts
                                                                             in the frequency domain and then convert the filtered signal back to
3.2.2 Drone System. We use a DJI S1000 drone [7] to increase                 the time domain to be processed in the next stage. Our evaluation in
the area a single transceiver pair can effectively cover. As illustrated     Section 4 shows that this is a simple yet effective strategy.
in Figure 5 (b), the LimeSDR-mini, smartphone, Arduino board are
put on top of the drone and are powered by a 5200 mAh portable               3.3.2 Human target detection. Human activities like hand wav-
power bank with a 2.4 A output. We employ the collision avoidance            ing and walking will alter the wireless propagation paths and lead
system provided by DIJ to avoid drone collision with obstacles. The          to the change of signal amplitude at the receiver [10]. Prior work
drone is controlled by software running on a laptop, programmed              shows that when no human target is present, the received signal
through the DJI software development kits. One limitation of the             can be approximated as the superposition of constant signals and
drone system is that it can not operate for a long time when loaded          the white Gaussian noise, yielding an invariant PSD with time [41].
with the devices and one battery charge can support around 15                By contrast, the PSD of the received signal resulted from a moving
minutes of flight. Our future implementation will look into reducing         human target, will lead to fluctuations on the measured signal. As
the drone’s load by running the data collection and antenna control          an example, consider Figure 6 drawn from our own experiments.
software on a single computing device (e.g., the Arduino board),             It illustrates the difference in the PSD with and without a moving
which can be powered directly by the drone’s battery. Multiple               human target. When no human target is present (Figure 6 (a)), the
drones can be utilized to alleviate this power-hungry issue.                 PSD of the received signal remains stable with time and close to
                                                                             0 Hz, while when a moving target presents (Figure 6 (b)), the PSD
3.3    Target Detection and Localization System                              fluctuates at low frequencies (0 − 10 Hz). Our work exploits this
We develop a set of algorithms to process the collected LoRa signal          signal characteristic to detect the presence of a human target – if the
data to detect and localize human targets. The process of detection          measured PSD frequency and its variance are both below a threshold
and localization works as follows. We first pre-process the received         (empirically set to 0.1 Hz in our case), we consider there is no human
signal to remove the noises caused by the drone’s vibration artifacts.       target; otherwise, we conclude that someone (with movements) is in
We then exploit the power spectrum density (PSD) of the processed            the sensing area.
signal to detect the presence of human targets. The PSD is calculated            In this work, we focus on detecting human targets with large
as the Fast Fourier transform of signal amplitudes’ self-correlation.        movements: ambulating or waving in-place. We are also able to de-
Note that our detection mechanism can detect the presence of target          tect a stationary breathing target when there is no obstacle between
no matter one or multiple targets are present in the sensing area.           the transceiver pair and the target, or the obstacle is thin (see Sec-
After detecting the presence of a moving target, we apply the lo-            tion 4.2.3). Figure 7 illustrates the normalized PSD of the reflected
calization algorithm to estimate the location of the target whose            signals of these three states (ambulating, waving and stationary) from
reflection is strongest at that time (note that during localization stage,   a human target in a controlled environment. The diagram shows that
we let the device hover in place). With the device mobility, we can          different states exhibit different characteristics in the frequency do-
detect and locate multiple targets successively. As we have previ-           main, which can be used to identify and differentiate these states.
ously discussed, W IDE S EE needs to effectively handle the multipath        In particular, human breath and waving present strong, dense PSD
effects and location ambiguities brought in by using only one LoRa           with a frequency range of 0.1-0.6 Hz and 1-4 Hz, respectively. By
transceiver pair.                                                            contrast, the PSD distribution of an ambulating human target is more
                                                                             spread apart, mainly due to the human target’s randomized ambula-
3.3.1 Vibration noise elimination. Vibrations of a flying drone              tory trajectory pattern and uncorrelated movements of multiple body
inevitably introduce noise to the received LoRa signals. To remove           parts.
the introduced noise, we exploit the observation that the motion
artifacts brought by a drone are within a frequency range between            3.3.3 Ambulating Target Localization. Once an ambulating hu-
60 Hz and 150 Hz, which is different from the lower frequency range          man target is detected, we focus on identifying the location of the
SenSys ’19, November 10–13, 2019, New York, NY, USA Chen et al.
2π v t
Ambulating
t can be expressed as x t,k = at,k e j(µ k + λ cosθ k ) [21], where at,k
target Ambulating Wall is the amplitude of the signal and µ k is the signal phase at the initial
target
time point (i.e., t = 0). Then, the signal received at the receiver at
T time t is a superposition of K signals, which can be written as:
R
0 K
2π v t
at,k e j(µ k + cosθ k )
Õ
v y(t) = λ . (1)
d k =1
Static paths Let us denote R(τ ) as the self-correlation of the received signal
L
LoRa
Tx Rx
LoRa
Tx Rx amplitudes at delay τ . Then, R(τ ) can be expressed as [21, 31]:
(a) (b) K
Õ −1 K
Õ vτ
R(τ ) = C A + Ck, j · cos 2π (cosθ k − cosθ j ) , (2)
Figure 8: (a) shows the setup of moving target localization. Sim- λ
k =1 j=k +1
ilar to the linear virtual array constructed by moving receiver.
The moving target also can emulate a linear array. (b) presents where C A is a constant term depending on the total signal power and
the superposition signal of multiple paths. π a t,
2 a2
k t, j
Ck, j = ÍK , where at,k
2 is the signal power of k th signal. It
16 k =1 a t,k
2
K (K −1)
is noteworthy that R(τ ) is consisted of a total of 2 harmonics.
target. One of the technical challenges in LoRa-based target local- Each harmonic’s frequency is related to the cosine of two sources’
ization is that the multipath in LoRa is more severe than that in AoA (i.e., θ k , θ j , and k = 1, 2, ..., K, j = 1, 2, ..., K), which is given
other signals (e.g., WiFi). Even though we utilize the narrower beam by:
antenna at the receiver, the multipath within the sensing area can v
fg
k, j = |cosθ k − cosθ j |. (3)
be still substantially strong, which negatively impacts target local- λ
ization. To address the multipath issue for localization, previous Note that cosθ k and cosθ j are unknowns we are trying to obtain the
work has investigated various techniques, such as analyzing the values. These frequencies fek, j can be obtained by the frequency
AoA information [52], frequency hopping based on accurate chan- estimation technique, such as the fast Fourier transformation of
nel phase measurement [35, 40], and comparing ToF that requires amplitudes’ self-correlation followed by a peak magnitude detection.
large bandwidth and tight transceiver synchronization [33]. Unfortu- For the target moving and transceiver fixed scenario shown in
nately, these techniques are not applicable to our system because the Figure 8 (a), the resultant signal is composed of reflection (Tx →
maximum bandwidth of LoRa is only 500 KHz, and the asynchro- target → Rx) from an ambulating human target and direct path (Tx
nism between LoRa node (Tx) and gateway (Rx) makes it difficult → Rx). The resultant signal at time t can thus be written as:
to extract stable phase readings from the received signal. Also, it 2π v t
y(t) = as e j µ s + ad e j µd + λ (cosθT +cosθ R ) ,
is particularly difficult to achieve synchronization between LoRa (4)
node and gateway due to the cheap oscillator adopted. Because of where as and µ s are the amplitude and phase of the direct path signal,
the chirp modulation, LoRa can tolerate high frequency offset for ad is the amplitude of the signal reflected from the moving target,
commutation so high-accuracy oscillator is not needed. µd is the initial phase (t = 0) of the reflected signal, v is the moving
In this work, we propose an amplitude-based anti-multipath method speed of the target, θT and θ R are two angles marked in Figure 8 (a).
to localize a moving target. The foundation of our method is to ex- Equation (4) is a special case of Equation (1) with 2 sources (K =
tract direction-related information from signal amplitudes, inspired 2), cosθ 1 = 0 and cosθ 2 = cosθT + cosθ R . The moving target can syn-
by a recent work by Karanam et al. [31]. By using the direction- thesize a transmitter array. We put cosθ 1 and cosθ 2 into Equation (3)
related information for localization, we have the opportunity to to obtain the following:
remove the multipath effect that however is not addressed in [31].
In the following subsections, we first describe the basic concepts v
fg
1,2 = |0 − (cosθT + cosθ R )|, (5)
behind extracting the direction-related information when a target is λ
moving. Then, we answer how to obtain target location information since v, θT and θ R are unknowns in practice, we jointly estimate the
from the extracted direction-related information. Finally, we propose direction-related parameter |v(cosθT + cosθ R )| as fg
1,2 λ according to
the solution to handle multipath. Equation (5).
Direction-related parameter estimation. Here we first describe Localization ambiguity avoidance. By utilizing the |v(cosθT +
the framework for estimating direction-related parameter in device cosθ R )| estimate from only one transceiver pair to localize the target,
moving scenario (target does not move), which can be used to deduce there exist severe localization ambiguities that stem from three as-
the direction-related parameter in target moving case (device does pects: (1) the absolute value symbol | | applied to v(cosθT + cosθ R );
not move). (2) unknown distance d between the target and the Tx-Rx LoS link
Considering a scenario in which we have one receiver that receives as shown in Figure 8 (a); and (3) unknown speed v and direction
signals from K different sources. When the receiver moves along θ 0 of target movement. We show the localization result of a special
a straight line at a speed v, it can emulate a linear array. We can case (θ 0 = 0) in Figure 11 (a). We can see that even with θ 0 = 0 to
define the incoming angle of each signal source in far-field as θ k , simplify the problem, there still exist ambiguities (the areas with red
k = 1, 2, ..., K. Then, the signal received from the k th source at time color). So it is difficult to obtain the target’s true initial location.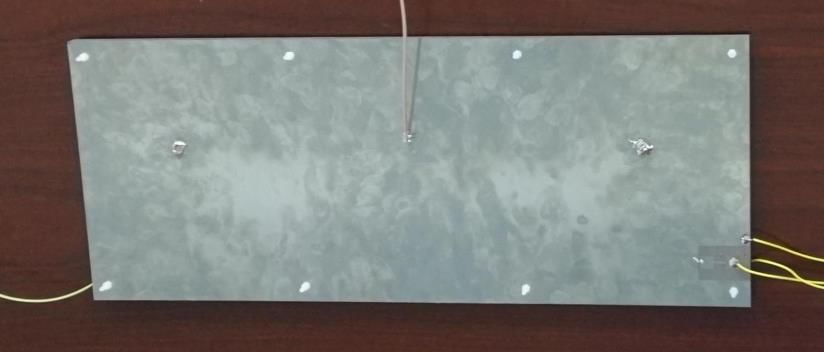
W IDE S EE: Towards Wide-Area Contactless Wireless Sensing SenSys ’19, November 10–13, 2019, New York, NY, USA
1
|v(cos +cos )| t=[0, )
T R
t=[w, w+ )
estimates
t=[2*w, 2*w+ )
PSD
0.5 [1.38, 1.36, 1.32, 1.26] t=[3*w, 3*w+ )
0
0 0.5 1 1.5 2 2.5 3
(a) Target moves towards LoS. (b) Target moves away from LoS. f
Figure 9: The changing trend of v(cosθT + cosθ R ) estimates at Figure 10: Four adjacent estimates of direction-related parame-
various target moving directions θ 0 . It can be seen that the ter |v(cosθT +cosθ R )|. The estimates are the normalized frequen-
changing trend of v(cosθT + cosθ R ) estimates from the 1st to cies corresponding to the peaks of PSD plots.
m th is always decreasing no matter the target moves towards
LoS (0◦ < θ 0 < 90◦ ) or moves away from LoS (90◦ < θ 0 < 180◦ ). 10 1 10 1
0.8 0.8
Ground truth Ground truth
Y (m)
0.6
Y (m)
0.6
In this paper, we solve this problem based on the facts that the 5
0.4
5
0.4
target’s moving trajectory is smooth and the velocity is a constant
0.2 0.2
during a short period of time (e.g., < 1 s). Specifically, we utilize
0 0 0 0
multiple consecutive estimates of v(cosθT + cosθ R ) with a sliding 0 5 10 0 5 10
window of size w, and each estimation process requires samples X (m) X (m)
collected in a time window of size τ . w and τ are empirically set (a) Before ambiguity avoidance. (b) After ambiguity avoidance.
as 0.25 s and 1 s in our system. To reduce the computational time,
Figure 11: Localization ambiguity avoidance. The heatmap ex-
we reduce the sample rate from 250 KHz to 1 KHz for PSD calcula-
hibiting the likelihood that how a partitioned grid is likely to be
tion. We aim to solve five unknown parameters: [θT 1 , θ R1 , θ 0 , d 1 , v],
the initial location of the target. The coordinates of Tx and Rx
where θT 1 , θ R1 and d 1 are the initial values of θT , θ R and d respec-
are (0, 0) and (10, 0), the ground truth is highlighted with black
tively. Note that within a short period of time, v and θ 0 can both be
square. From (a), we can see all grids of the reddest color result
considered as constants while θT , θ R and d are changing. During the
in the same value of |v(cosθT + cosθ R )|, resulting severe localiza-
process of target movement within a short period of time, we keep
tion ambiguities.
estimating the 3 changing variables. For the m th estimates, we can
have the following two equations bellow:
v(cosθT m + cosθ Rm ) = ±( fg 1,2 λ)m
Particle Swarm and Global Search from Matlab Global Optimization
. (6)
dm (tan(θ 0 + θ Rm ) + tan(θT m − θ 0 )) = L Toolbox to achieve global optimum search for the set of non-linear
equations. The principle is to obtain an initial search value close to
Note that ± can be removed due to our observation as shown
the solution using particle swarm, then limit the objective function
in Figure 9. We find that the changing trend of v(cosθT + cosθ R )
with fmincon’s non-linear constraints, and finally use Global Search
estimates from the 1st to mth are always decreasing. When the target
to obtain the solution. The computational complexity of the search
moves towards transceiver pair, the values of cos θT and cos θ R (0◦ <
algorithm is O(N × M), where N is the dimension of the particle
θT < 90◦ , 0◦ < θ R < 90◦ ) are positive and the values decrease with
swarm and M is the number of iterations. Figure 11 (b) shows that
angles θT and θ R increasing. When the target moves away from the
the initial localization result with our ambiguity avoidance scheme
transceiver pair, the values of cos θT and cos θ R (90◦ < θT < 180◦ ,
is close to the ground-truth.
90◦ < θ R < 180◦ ) are negative and the values again decrease with
angles increasing. So we delete another set of estimates that do not Multipath interference elimination. Consider a typical multipath
satisfy the condition of decreasing from the 1st to m th estimates. scenario shown in Figure 8 (b), we can see that the received signal
Consider the fact of trajectory smoothness and speed constancy at the receiver is a superposition of multiple signals, which can be
over a short period of time, we can add the following constraints: written as:
2π v t
θT m ≈ θT 1 + (m − 1)α
y(t) = as e j µ s + ad e j(µd + λ (cosθT +cosθ R )
θ Rm ≈ θ R1 + (m − 1)β , (8)
(7) 2π v t
+ ad′ e j(µd + (cosθT′ +cosθ R′ )
′
dm ≈ d 1 − vτ (m − 1)cosθ 0
λ ,
where α and β are constant but unknown. By incorporating Formula 7 where ad , µd , θT and θ R are the amplitude, initial phase (t = 0),
into Formula 6, we find that when m reaches to 4, the number of angle parameters of the direct target reflection (Tx→target→Rx),
equations (2m = 8) is larger than the number of unknowns (a total respectively. To simplify representation, here we approximate the
of 7 with 5 original unknowns and 2 newly introduced unknowns). indirect target reflection (Tx→target→wall→Rx) as a new direct
Thus we are able to solve the unknowns with only 4 estimates of reflection from a virtual target (Tx→virtual target→Rx), with am-
|v(cosθT + cosθ R )| as shown in Figure 10. plitude ad′ , initial phase (t = 0) µd′ , direction parameters θT′ and θ R′ .
Since the equations are non-linear that can not be solved directly, In such scenario, the feλ value set has |v(cosθT + cosθ R )| as well as
an intuitive choice is to use Approximate Search algorithm. To |v(cosθT′ + cosθ R′ )| and |v(cosθT + cosθ R ) − v(cosθT′ + cosθ R′ )| com-
avoid the local optimum issue and reduce time overhead, we adopt ponents. Since the resultant static component (contains direct path)
SenSys ’19, November 10–13, 2019, New York, NY, USA Chen et al.
|v(cos T +cos R)| values
1 1
6
t=[0, ) t=[0, ) 1.5
Target t=[w, w+ ) t=[w, w+ )
t=[2*w, 2*w+ ) t=[2*w, 2*w+ )
A
4 t=[3*w, 3*w+ ) t=[3*w, 3*w+ )
Y (m)
PSD
PSD
B 1
0.5 0.5
2
Target
Target + A (Dynamic-Music)
0 0.5 Target + B (Dynamic-Music)
Tx Rx Target + B (Our method)
-2 0 0
0 5 10 0 1 2 3 0 1 2 3 1 2 3 4
X (m) f f Index
(a) Setup. (b) PSD plots with interfering object at lo- (c) PSD plots with interfering object at lo- (d) |(v(cosθT + cosθ R ))| estimates.
cation A. cation B.
Figure 12: Multipath interference presentation. The figure shows that past AoA based multipath removal solution fails when the
interfering object is close to the connecting line between target and receiver/transmitter (like at location B). Our approach has the
ability to mitigate the problem.
10 1 10 1
0.8 0.8
Ground truth Ground truth
(a) (c)
Y (m)
Y (m)
0.6 0.6
5 5
0.4 0.4
0.2 0.2
0 0 0 0
6 8 10 6 8 10
X (m) X (m)
(b)
(a) Using Dynamic-Music. (b) Using our approach.
Figure 13: Localization errors of using past (5.1 m) and Figure 14: Evaluation scenarios. We evaluate W IDE S EE in an
our (1 m) multipath elimination approaches, when an interfer- open square (a), an underground parking garage (b), and a mid-
ing object locates at point B as shown in Figure 12 (a). dle floor of a 17-floor building (c). The testing area is on one side
of the transmitter-receiver line in all of the experiments.
is much stronger than the reflections, we can lock the two dominant
feλ estimates as |v(cosθT + cosθ R )| and |v(cosθT′ + cosθ R′ )|. cosθ R )|, the 4 estimates now decrease monotonously and match
To distinguish the target corresponding |v(cosθT + cosθ R )| value the no-interfere estimates much better than those obtained with the
from the |v(cosθT′ + cosθ R′ )| estimate shown in Figure 12 (b-c), ex- Dynamic-Music method. The localization error of our method (1 m)
isting solutions (e.g., Dynamic-Music) exploit the fact that the direct is much lower than that of Dynamic-Music method (5.1 m).
target reflected path is stronger than the indirect target reflected
path [34, 46, 52] due to the shorter path of former, so they con- 4 EVALUATION
sider the feλ value of larger magnitude as the direct target reflection 4.1 Experimental Setup and Roadmap
resulted |v(cosθT + cosθ R )|.
This approach can be effective when the interfering object (at We performed two sets of field experiments to evaluate W IDE S EE in
location A in Figure 12 (a)) is far away from the connecting line detecting and localizing human targets: field experiments without a
between target and receiver/transmitter. We can see that the four drone and field experiments with a drone.
estimates of |v(cosθT + cosθ R )| decrease monotonically as shown 4.1.1 Field experiments without a drone. We would like to
in Figure 12 (d) when there is one interfering object at location A. provide a quantitative evaluation first to justify our design choices,
Figure 12 (b) shows the PSD plots and the position ( feλ) of the peak and to identify the research opportunities and limitations of LoRa
is the estimate. We can see that for 4 consecutive time window, the sensing. To this end, we evaluate how the distance between transmit-
( feλ) is decreasing. These results are similar to the case when there ter and receiver affects the sensing range of LoRa in Section 4.2.1.
is no interfering object. However, when the interfering object (at In Section 4.2.2, we report the performance of our antenna design
location B in Figure 12 (a)) is close to the connecting line between for detecting moving human targets and compare it with two alter-
target and receiver/transmitter, the |v(cosθT +cosθ R )| estimates show native designs using omni- and horn-directional antennas. We then
remarkable shifts as shown in Figure 12 (c) and (d) and thus fail to evaluate LoRa’s penetration capability in detecting three different
localize the target. To mitigate this problem, instead of taking the human activities in Section 4.2.3, before reporting the localization
peak value position feλ shown in Figure 12 (c) as |v(cosθT + cosθ R )|, accuracy of our system in Section 4.2.4. Finally, in Section 4.2.5, we
we take the average of two positions corresponding to largest and evaluate the impact of the human target’s walking speed on detection
second largest peak values as |v(cosθT + cosθ R )| if we find the four and localization accuracy. Controlled experiments were performed
estimates are not decreasing monotonously and the second largest on the ground for detecting a single moving human target with the
peak value is larger than 50% of the largest peak value. Figure 12 (d) LoRa transceiver pair placed 1 m above the ground. Later in the field
shows that by using our methods to obtain the new |v(cosθT + study, we use the drone to carry the transceiver pair.
W IDE S EE: Towards Wide-Area Contactless Wireless Sensing SenSys ’19, November 10–13, 2019, New York, NY, USA
60
Detectable distance (m) 100
Detection accuracy (%)
Omnidirectional antenna Omnidirectional antenna
Detectable blocks (%)
Horn directional antenna Horn directional antenna
Our antenna 80 Our antenna
40 100
80 60
60
20 40
40
20
20
0 0
1 5 9 13 17 21 25 29 33 37 41 45 49 53 59 0
18 24 30 36 42 48 18 24 30 36 42 48
Transmitter-receiver distance (m)
Transmitter-receiver distance (m) Transmitter-receiver distance (m)
Figure 15: Impact of the transmitter-receiver distance on the de- (a) Detection accuracy. (b) Detectable area.
tectable distance (sensing range). W IDE S EE can detect a mov-
ing object with a distance to the transceiver pair of up to 53 m Figure 16: Comparing the detection accuracy (a) and region
in an open square. (b) between our approach and alternative directional antennas
with a similar size. Our antenna design gives the best trade-off
between the detection accuracy and range.
4.1.2 File study with a drone. In the field study, we use a drone
to carry the LoRa transceiver pair to detect and locate a human target
4.2.2 Evaluation of our antenna system. This experiment is
in the building shown in Figure 14 (c). We report the performance
designed to evaluate the performance of our antenna system in hu-
for detecting the presence of human targets and the accuracy for
man target detection. We compare our design against two alternative
localizing a human target with different drone speeds. The results
designs which use an omnidirectional [1] and a horn directional
are given in Section 4.3.
(RFMAX [5]) antenna with a similar size. Our testing area is an
4.1.3 Evaluation metric. We calculate the accuracy for detecting open square with a size of 42 × 48 m2 depicted in Figure 14 (a).
the presence of a human target as: We divided the testing area into a grid of 224 blocks, 3 × 3 m 2 for
C each block. Like the previous experiment, we asked a human target
1Õ Hm,c − Ht,c
Accuracy = (1 − | |), Hm,c , Ht,c = {0, 1} to choose any block and then move within the block naturally. We
C c=1 Ht,c ensure that each block was tested at least once.
where C is the number of tests, Hm,c and Ht,c are the outputs of Figure 16 shows that our design presents the best trade-off be-
W IDE S EE and the ground-truth in the cth test respectively. tween the detection accuracy and area coverage. In this experiment,
we report the number of detectable blocks. Note that this is different
4.2 Field experiments without a drone from the evaluation in Section 4.2.1, where we are interested in
the longest-possible distance for detecting a target that is always
4.2.1 Sensing range under different transmitter-receiver dis-
on the perpendicular bisector of the transceiver pair. In this exper-
tances. In this experiment, we varied the transmitter-receiver dis-
iment, most of the blocks are not on the perpendicular bisector of
tance, i.e., the distance between the transmitter and the receiver,
the transceiver pair. As we increase the transmitter-receiver distance
from 1 m to 59 m at a step size of 2 m. The tests were conducted
beyond 36 m, we see a decrease in the number of detectable blocks.
in the open square shown in Figure 14 (a). In each transceiver pair
This is mainly due to the directionality of the receiver antenna.
setting, we asked a target to walk along the vertical bisector of the
While RFMAX, the horn directional antenna achieves the second-
transceiver pair 100 times with a walking distance of 3 m each time,
best detection accuracy, it can detect the least number of blocks.
starting from a randomly chosen position. Note that we moved the
The omnidirectional antenna, on the other hand, can cover more
starting point further from the transceiver pair each time, until we
blocks, but it achieves the poorest detection accuracy due to its
fail to detect the user at that point. We consider a position to be
high sensitivity to the surrounding interference. The sensing range
detectable if we can correctly detect the user at that position for over
achieved by our antenna is relatively large due to the signal focusing
90% of the time. We calculated the distance between each detectable
and radiation direction switching, and it delivers a much higher
position and the middle point of the transceiver pair link to find the
detection accuracy for all settings. The better detection accuracy of
largest-possible sensing distance (i.e., sensing range) for a given
our approach is largely attributed to its narrower beam, which in turn
setting.
leads to a stronger signal and at the same time less interference from
Figure 15 shows how the transmitter-receiver distance affects the
non-target objects.
sensing range of W IDE S EE. We see that the sensing range in general
grows as the transmitter-receiver distance increases. However, it 4.2.3 Penetration test. We also evaluate W IDE S EE’s ability to
reaches a plateau with a detectable distance of 53 m. This suggests penetrate the walls. Experiments were conducted in the underground
that W IDE S EE can achieve a sensing range of 53 m for a moving garage as shown in Figure 14 (b) and the second floor of our test
target in a relatively ideal environment (an open square). Such a building shown in Figure 14 (c). Our evaluation includes four set-
sensing range is a significant improvement over WiFi, RFID and tings – no wall and wall made of reinforced concrete with three
mmWave-based systems, which have a sensing range below 6 m [47, different thicknesses (26 cm, 52 cm and 94 cm) between the target
51, 55]. However, we believe there is a potential to further increase and the transceiver pair. In the through-wall experiment, we placed
this sensing range with careful signal processing considering the the transceiver pair 1.5 m away from the wall.
kilometer-level communication range and we leave it as important Figure 17 shows the results. As expected, the thinner the obstacle
future work. between the target and the transceiver pair, the deeper W IDE S EE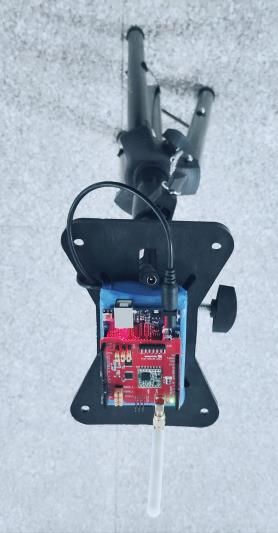
SenSys ’19, November 10–13, 2019, New York, NY, USA Chen et al.
No wall Wall thickness = 26cm Wall thickness = 52cm Wall thickness = 94cm
Detectable distance (m)
25 25 20 10
20 20
15 7.5
15 15
10 5
10 10
5 2.5
5 5
0 0 0 0
1 1.5 2 2.5 3 3.5 1 1.5 2 2.5 3 3.5 1 1.5 2 2.5 3 3.5 1 1.5 2 2.5 3 3.5
Transmitter-receiver distance (m) Ambulating Waving Stationary
Figure 17: Penetration test. W IDE S EE can detect a stationary human target who is behind a wall with a thickness of 52cm, and
W IDE S EE can detect a moving/walking target deeper inside a wall.
1 100 2.5
Detection accuracy (%)
Localization error (m)
error is within 2.1 m and 2.7 m in the open square and the basement,
0.8
respectively. Such accuracy would be good enough for locating a
0.6 human target in many application scenarios, demonstrating the great
CDF
Open space 95 2
0.4 Basement potential of sensing using a single LoRa transceiver pair.
We conduct another experiment to show the tracking accuracy
0.2
2.1 2.7
of our system in a smaller area. This experiment was performed
0 90 1.5
0 2 4 6 0.5 0.2 1 0.2 2 0.2 in a smaller room located in the building shown in Figure 14. The
Localization error (m) Target moving speed (m/s) room has a size of 8 × 10 m2 . In this experiment, the transmitter-
receiver distance is set as 6 m. The target was asked to walk along the
Figure 18: CDF plots of Figure 19: Impact of target trajectory of five letters “BCIMO”. The recovered trajectories (dots)
the localization error in two moving speed. The target’s and the ground-truth trajectories (solid lines) are shown together in
large scenarios (10 × 25 m 2 ) moving speed has little im- Figure 20. W IDE S EE achieves a median localization error of 52 cm,
with different densities of pact on detection, but it af- which is comparable to the 32 cm error achieved in IndoTrack - a
multipath. fects localization. state-of-art WiFi tracking system with dense deployment [51]. This
experiment shows that W IDE S EE is able to track the target at higher
accuracy in a smaller-size area.
can successfully detect the target. We observe the target’s activity
also has a significant impact on the detectable distance. If the tar- 4.2.5 Impact of the target’s moving speed. This experiment
get is ambulating or waving, W IDE S EE can successfully detect the studies the effect of the target’s walking speed on detection and
target up to 15 m and 13 m, respectively. W IDE S EE can also detect localization. We consider three walking speeds: slow (0.5 ± 0.2 m/s),
a stationary target with just respiration. However, the detection dis- average (1 ± 0.2 m/s) and fast (2 ± 0.2 m/s). We conducted the
tance is limited and depends on the thickness of the wall. This is experiments in the open square shown in Figure 14 (a).
not surprising, as the smaller the activity and the thicker the wall is, Figure 19 shows that the target’s moving speed has little impact
the weaker the received signal strength will be. For our experiments, on target detection, but it does affect the localization accuracy. We
a 20 cm increase in the wall’s thickness would reduce the received observe a localization error of 1.7 m, 2 m, and 2.5 m when the target
signal strength by around 29 dB. Nonetheless, the results show that was moving at slow, average, and fast speeds respectively. This is
W IDE S EE can accurately detect a human target moving or waving largely attributed to the body motions (e.g., arm swing) – the faster
deep inside the building. the walking speed is, the more drastic the body movement will
be – a more drastic body movement makes it harder to satisfy the
4.2.4 Localization accuracy in different multipath environ- conditions that we use for localization (see Equation 7).
ments. We report how multipath impacts localization accuracy in
this section. Our evaluation environments are the open square (Fig-
ure 14 (a)) and basement parking garage (Figure 14 (b)). As can be 4.3 Building-scale Field Study
seen from Figure 14 (b), the basement is supported by many pillars In this field study, we employ W IDE S EE with a drone (see also
and hence has rich multipath. The test areas in both environments Figure 2) to perform building-scale sensing. The task is to detect and
are of the same size (10 × 25 m 2 ), and we set the transmitter-receiver track a human target located on the 9th floor of a 17-floor building
distance as 10 m. We divided the testing area into 125 blocks, where structure with a size of 20 × 42 × 85 m 3 (Figure 14 (c)). Note that this
each block has a size of 2 × 1 m2 . For each block, a target was asked new building had no occupant at the time of our experiment. The
to walk following predefined straight lines that have 0◦ , 30◦ , 45◦ , thicknesses of the concrete walls and glass windows are 40 cm and
60◦ or 90◦ degrees with respect to the transmitter-receive line. For 5 cm, respectively. The transceiver pair was carried by a drone in this
each line, the user walked for around 2 s, starting from the center of experiment. The distance between the transmitter and the receiver
a block. Figure 18 plots the cumulative distribution function (CDF) is 2 m. Ten student volunteers participated in this study, serving as
of the localization error across our 125 experimental trials. This the target. Figure 21 shows the experimental setup. The students
diagram shows that for over 50% of our test cases, the localization were arranged into three groups to perform stationary (breathing) (2You can also read