Electric car boom at risk - Why the current EU car CO rules will do little to accelerate the switch to zero-emissions mobility - Motor1.com
←
→
Page content transcription
If your browser does not render page correctly, please read the page content below

Electric car boom at risk
Why the current EU car CO₂ rules will do little to
accelerate the switch to zero-emissions mobility
November 2021

                     A study by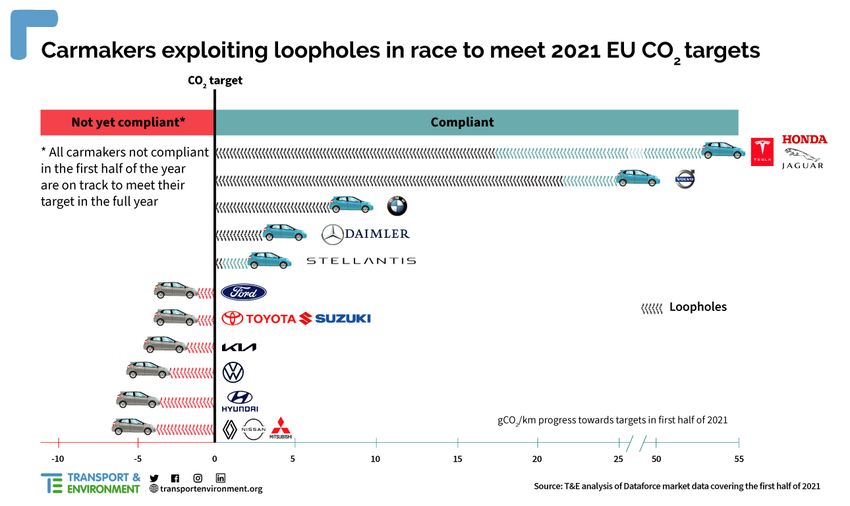
Transport & Environment
Published: November 2021

Author: Yoann Gimbert
Expert group: Lucien Mathieu, Julia Poliscanova, Alex Keynes, Max Mollière

Editeur responsable: William Todts, Executive Director
© 2021 European Federation for Transport and Environment AISBL

To cite this report
Transport & Environment (2021), Electric car boom at risk

Further information
Yoann Gimbert
Emobility Analyst
Transport & Environment
yoann.gimbert@transportenvironment.org
Mobile: +32(0) 4 88 27 19 97
www.transportenvironment.org | @transenv | fb: Transport & Environment

Acknowledgements
The authors kindly acknowledge the external peer review by Matthias Schmidt from Schmidt
Automotive Research. The findings and views put forward in this publication are the sole
responsibility of the authors listed above. The same applies to any potential factual errors or
methodological flaws.

                                               A study by                                    2
Executive Summary
 The EU clean car rules - or car CO₂ standards - have driven the boom in electric car sales across
 Europe. The standards are phased in over 2020-2021 and require carmakers to reduce CO₂ emissions
 from the new cars they sell. In 2020, the sales share of plug-in vehicles more than tripled resulting in
 a significant drop in CO₂ emissions. In this report T&E looks at the situation in 2021, analysing CO₂
 emissions from new cars sold in the first half of the year and looking at the performance of
 individual carmakers. Beyond 2021, the transition to zero emissions must accelerate as the
 European Commission recently announced proposals to go to 100% zero emission (electric) cars
 sales across Europe from 2035. As regulators in the European parliament and across governments
 consider the newly proposed rules from the Commission proposal, this report looks at the new car
 CO₂ and zero emission vehicle trends and compares them against the proposals. Will the new rules
 scale up electric car models quick enough so that all Europeans can access them?

 CO₂ emissions from new cars dropped by almost one fifth from 2019
 The sales of plug-ins models - battery electric cars, BEV and plug-in hybrid cars, PHEV - have surged
 with the entry into force of the 2020/21 CO₂ target requiring carmakers’ average CO₂ emissions to
 stay below 95 gCO₂ per km. This report shows that the sales of plug-ins have multiplied by four
 across Europe, and by five in the EU, in two years: from 3% in the first half of 2019 to 16% in the first
 half of 2021 (7.5% BEV). This has led to the second largest annual drop in CO₂ emissions from new
 cars (after last year): an 8% reduction compared to 2020. This results in a total reduction of CO₂
 emissions of 18% since the entry into force of the 2020/21 car CO₂ regulation, or the equivalent of all
 car emissions of Slovenia in 2019.

 Majority of carmakers already compliant, but 840,000 electric sales missing due to loopholes

        Some carmakers already compliant in the first half of the year thanks to loopholes

                                                A study by                                            3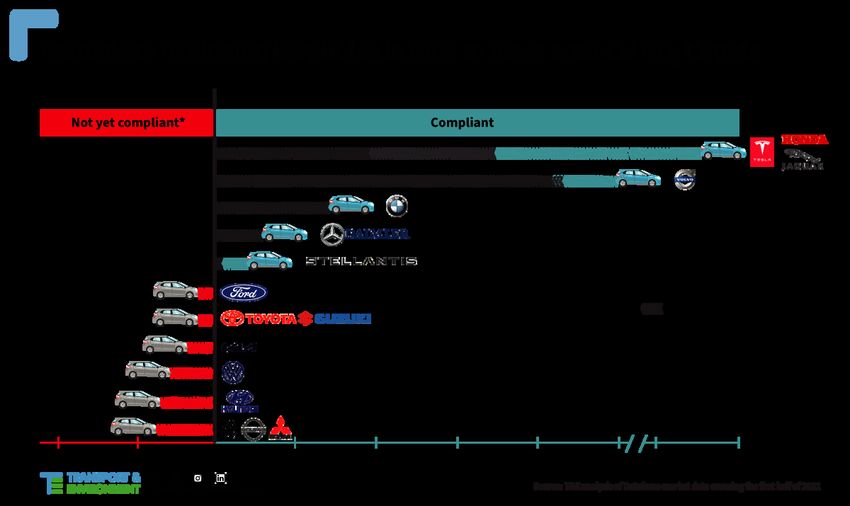
Five groupings of carmakers (or “pools” as referred to in the law): Tesla-JLR-Honda, Volvo, BMW,
    Daimler and Stellantis are already compliant with the 2021 target as of July, six months before the
    deadline. Ford, Toyota-Mazda-Suzuki-Subaru and Kia are close with a gap of less than 2 g/km while
    Volkswagen, Hyundai and Renault-Nissan-Mitsubishi have gaps around 3 g/km. This shows
    carmakers are once again on track to meet their CO₂ targets and will all comply at the end of the
    year.

                                                                         Carmakers       have   different
                                                                         compliance strategies to reach
                                                                         CO₂ targets: Kia, Renault and
                                                                         Volkswagen rely on growing
                                                                         battery electric sales while
                                                                         Daimler, Volvo or BMW mainly
                                                                         focus on PHEVs. Others such as
                                                                         the Toyota OEM grouping, Ford
                                                                         and Stellantis have a stronger
                                                                         focus on engine efficiency and
                                                                         hybridisation. BMW and Daimler
                                                                         are         among    carmakers
                                                                         benefitting the most from
                                                                         flexibilities and would not
                                                                         comply without them. For more
                                                                         information      on  carmakers
                                                                         performance, see T&E OEM
    Carmakers CO₂ targets weakened by regulatory loopholes               dashboard.

    On average, over half of the gap to 2021 target is closed by sales of full electric and plug-in hybrid
    cars. Improving efficiency of conventional models comes second. On top, four regulatory flexibilities
    - adjusting CO₂ targets for heavier cars, eco-innovation credits, super-credits multiplying sales of
    plug-ins, and pooling sales with other carmakers - allow carmakers to close 16% of the gap. T&E
    calculates that these regulatory flexibilities, as well as the unrealistic CO₂ rating of PHEVs, will
    prevent the sale of 840,000 battery electric cars across Europe in 2021. This is the climate cost of the
    flawed design of the regulation.

    18% plug-in share expected in 2021, but polluting conventional models and hybrids pose
    problems
    The T&E modelling1 forecasts 18% plug-in share across Europe (EEA) at the end of the year, including
    9% fully electric cars. T&E expects that the number of plug-ins sold in Europe would exceed 1.9
    million in 2021.

1
 The expected share of plug-in vehicles for the full year 2021 was calculated by assuming all carmakers are
compliant by the end of the year and included the impact from flexibilities.

                                                  A study by                                             4
However, PHEV share of the plug-in market (55%) is now higher than in 2019 or 2020 and starts to eat
into the share of zero emissions electric sales. Despite being classified as low emissions vehicles
with test measurements mostly below 50 g/km, PHEV road emissions are estimated to be two to four
times higher than lab results. This means that a large part of the official emissions drop is not
occurring on the road.

In addition, CO₂ emissions of conventional (petrol and diesel) models have been stagnating with a
mere 2% reduction from their 2016 level. Three carmakers - JLR, Volvo and Daimler - have engine
emissions above their 2016 levels. Every 8th car sold in the first half of this year was a high emitting
model with CO₂ above 157 g/km, predominantly an SUV.

Regulation lags behind carmakers’ emobility potential & is full of loopholes
Looking beyond 2021, the analysis shows that because of the weak CO₂ standards for the period
2022-2029 the ongoing EV boom will taper off from 2022 onwards.

                                              A study by                                            5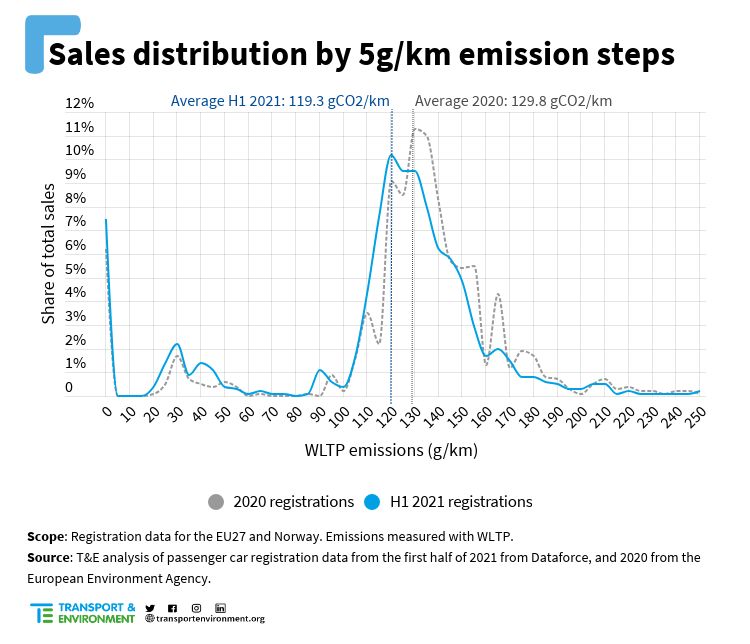
The current CO₂ targets for 2025
                                                                    and 2030 lag behind carmakers’
                                                                    own plans for electrification. T&E
                                                                    estimates that if carmakers deliver
                                                                    on their voluntary plans, the CO₂
                                                                    from new cars would be reduced
                                                                    by as much as 30-35% by 2025. In
                                                                    comparison, the regulation asks
                                                                    for a mere 15% reduction that
                                                                    would be reached as soon as 2023.
                                                                    The CO₂ emissions would be
                                                                    further reduced by 45-50% in 2027,
                                                                    and 65-70% by 2030. This is double
                                                                    the 2030 target currently in force
                                                                    and is significantly above even the
                                                                    newly proposed 55% reduction.

          T&E projection of emissions in the 2020s

From 2025-2029, a new flexibility will also enter into force: the zero and low emissions vehicles
(ZLEV) benchmark that gives credits to sales of full electric and hydrogen cars (1 credit each) as well
as plug-in hybrids (less than 1). This will reduce carmakers' CO₂ target by up to 5% if they sell more
than 15% ZLEV share in the period 2025-2029. Analysis of the planned electric car production shows
that many carmakers would reach this level of sales already in 2023, or two years prior to the
flexibility entering force (so all are projected to benefit from at least the partial CO₂ bonus in 2025).
Despite this fact, the Commission has left the benchmark untouched until 2030 in its July proposals.

All the regulatory flexibilities will result in new cars emitting 6% more CO₂ than they would
otherwise be allowed to over the coming decade, just as we should be accelerating our climate
action. This will also make it very hard for member states to reach their national effort-sharing (ESR)
targets by 2030. T&E estimates that in the absence of these regulatory loopholes, 11.5 million more
battery electric cars would be sold across Europe between 2021-2030.

Carmakers delivering on their EV promises could increase conventional car CO₂ by 60%
Historically, EV sales have closely matched regulatory requirements, jumping from 3% in 2019 to
18% in 2021. We expect this will remain the case, and in 2025 battery electric car sales will be around
half of what could be expected based on industry announcements. The weak targets between
2025-2029 could jeopardize the sales of 18 million battery electric vehicles. It will result in 55 Mt of
CO₂ pollution – more than the annual emissions of all the cars in Spain.

There is a theoretical possibility carmakers deliver on their EV promises without a tighter regulation.
But this would not necessarily be good news for the climate. Indeed, the car CO₂ regulation imposes
a cap on the average emissions of new cars sold. Selling high shares of EVs - which are counted as
zero emission cars - creates space to sell higher emitting vehicles such as SUVs. In 2020 several

                                               A study by                                            6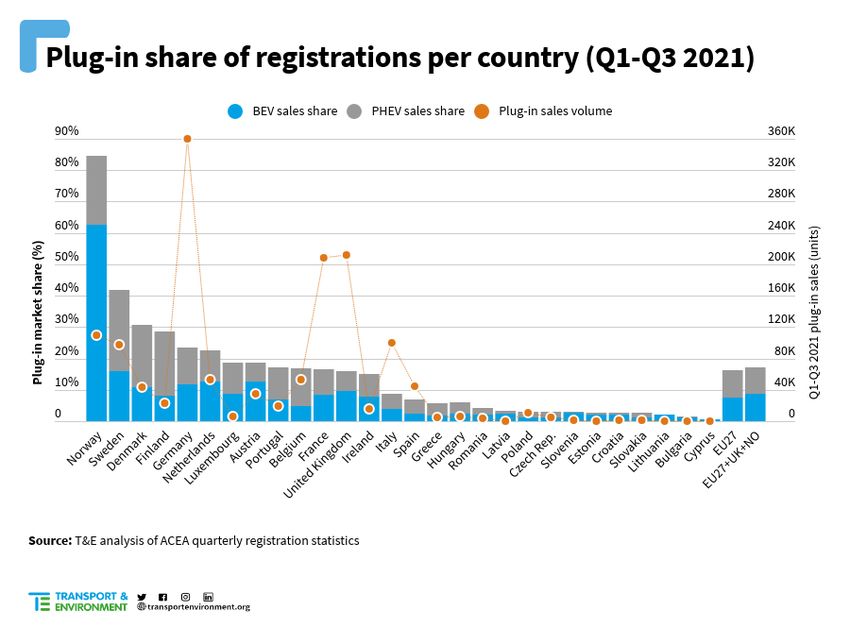
carmakers constrained or altogether ended the sales of very polluting cars. For example,
Volkswagen ended the sales of the Amarok pick-up truck. T&E modelling shows that if carmakers
meet their own EV sales targets, they could increase the emissions of their conventional models by
60% in the second part of the decade compared to 2021 and still comply with the regulation.

Policy recommendations
T&E analysis highlights that the ambition and design of the current and proposed revision of the car
CO₂ regulation are not fit for the zero emissions acceleration and industrial preparation required in
the next decade. With competitive zero and low emission models now on the market, the next task
of the regulation is to scale up their production. This is needed to make them affordable and
accessible to all Europeans as well as to build the EV supply chains be it charging or battery
materials on time. But the regulation's lack of ambition in the 2020s will not bring the planning
certainty for the ZEV sales to ramp up and the new EV industries to scale up on time. This is bad
news for Europe for three reasons:
  - Bad news for the climate as less CO₂ will be reduced from cars in the coming decade and
       fewer clean models replacing polluting ones, undermining our chance of avoiding a climate
       catastrophe.
  - Bad news for consumers as slower scaling up of electric car production in the 2020s will
       delay the point when the price of zero emission cars reaches that of conventional models.
       This means electric cars will be less affordable and accessible when the world has to
       accelerate and transition fully to zero emissions vehicles.
  - Bad news for European industry, as the EU automotive industry risks not moving quickly
       enough in the 2020s and conceding the lead in future-proof technology to other regions of the
       world. Catching up by 2030 is too late as Asian, American and other companies are already
       taking a growing share of the European market and wooing consumers today.

A combination of excessive flexibilities and inadequate emission reduction targets underscores the
need to strengthen the car CO₂ standards in the 2020s when the ramp of electric vehicles is needed
to put Europe on a credible path to zero emissions. This is how T&E recommends the regulation is
amended by the European Parliament and the European governments:

Increase the current level of the targets:
  ● To ensure an effective CO₂ reduction and optimal supply of BEVs, Europe needs at least a
      30% CO₂ reduction from new cars from 2025 and 45% from 2027.
  ● For the entire car fleet to be zero emission in 2050, the last new car with any CO₂ emitting
      engine must be sold no later than 2035. To be on the feasible path to 100% zero emission
      sales in 2035, sales of ZEVs will need to hit at least 67% in 2030, which corresponds to a CO₂
      reduction target of -80%.

                                             A study by                                          7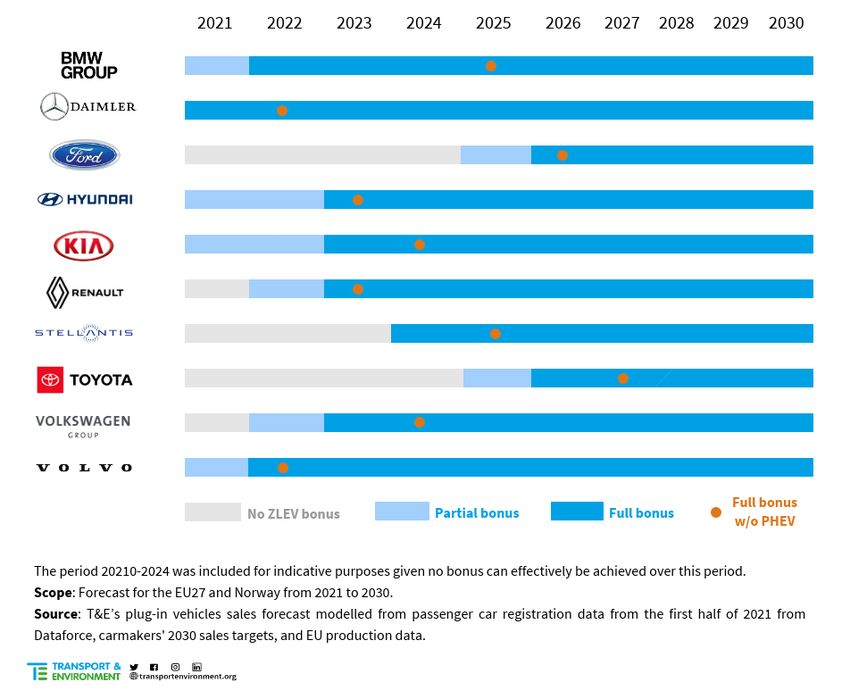
Flexibilities are weakening the CO₂ standards by allowing carmakers to cut planned BEV production
and/or increase ICE vehicle emissions and remain compliant with the targets. T&E therefore
recommends to improve the design of the regulation by:
   ● Removing the ZLEV benchmark and corresponding CO₂ bonus from 2025.
   ● Stopping the free CO₂ pass for heavier cars by removing the mass adjustment factor as well as
       limiting the CO₂ savings that can be claimed from eco innovations.
   ● Reforming the tests to provide realistic CO₂ rating of PHEVs, with the help of real-world data
       from fuel consumption meters.

                                            A study by                                         8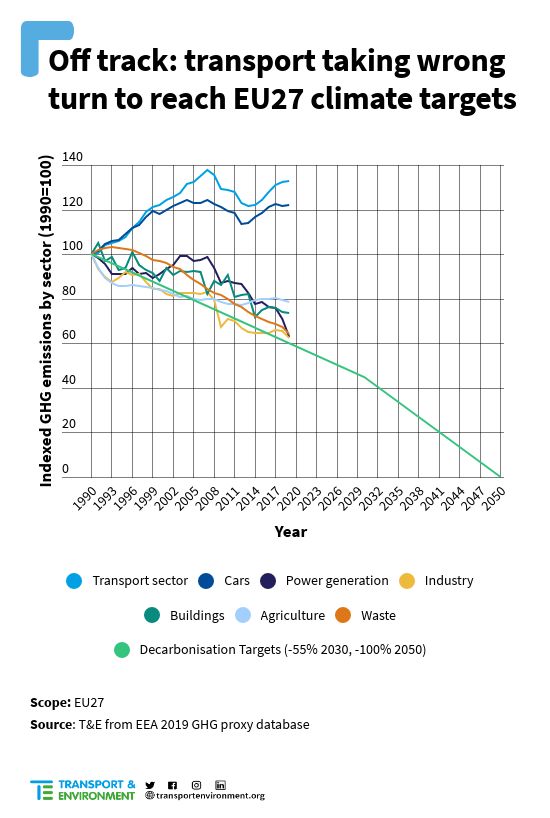
Table of contents

1. Introduction                                                                            11
     1.1. Transport emissions: Europe’s biggest climate problem                            11
     1.2. Current 2020/2021 car CO₂ emissions regulation                                   13

2. A steady decrease in car CO₂ emissions                                                  14
    2.1. Emissions trends analysis (H1 2021)                                               15
    2.2. Carmakers’ CO₂ emissions: where are we today?                                     18
    2.3. But ICEs still emit as much as 5 years ago                                        20
    2.4. CO₂ emissions per country                                                         23

3. Electric car sales continue to rise                                                     24
    3.1. Plug-in sales trend analysis                                                      25
         3.1.1. 2021: The PHEV problem                                                     26
         3.1.2. A growing market share for Chinese OEMs                                    28
    3.2. Electric car sales by OEM                                                         29
         3.2.1. Most popular plug-in models                                                31
    3.3. Plug-in sales by country                                                          32

4. Carmakers to easily meet CO₂ targets in 2021                                            33
    4.1. Overview of the current compliance gap per OEM                                    33
    4.2. 2021 plug-in sales per OEM                                                        35
         4.2.1. How has the full 95 g/km target been reached?                              38
         4.2.2. Overview of OEMs 2021 compliance strategies                                39
    4.3. CO₂ regulation flexibilities                                                      41

5. Post 2021 outlook - carmakers on course for an easy ride                                46
    5.1. Flexibilities continue to weaken the regulation                                   46
    5.2. Emission reduction targets lag behind market dynamics                             55

6. Recommendations                                                                         59
    6.1 The EU must set out a Green Deal compatible trajectory to 100% zero emissions      59
    6.2 End the free lunch for carmakers and stop flexibilities weakening the regulation   61

7. Annexes                                                                                 63
    7.1. Manufacturer pools                                                                63
    7.2. Methodology                                                                       63
         7.2.1. Filling the data gaps                                                      63
         7.2.2. Emissions comparison under different scopes                                64

                                                A study by                                 9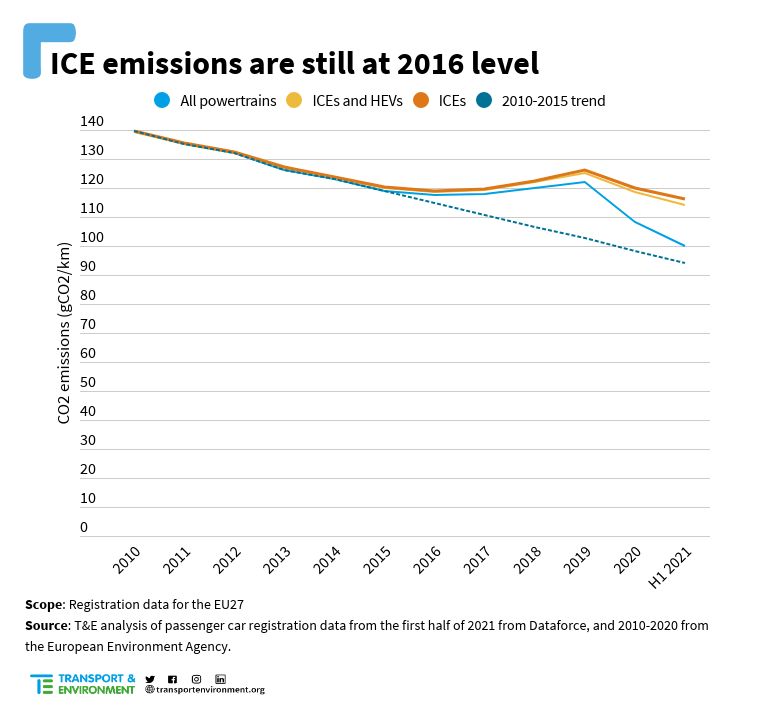
7.2.3. Compliance model                            64
        7.2.4. Powertrain emission forecast                65
   7.3. Overview of individual OEM compliance strategies   66
   7.4. BEV-PHEV distribution across Europe                70

Endnotes                                                   71

                                             A study by    10
1. Introduction
The car CO₂ emission standards are the main regulatory driver for emission reductions from new cars in
the EU. The latest regulatory changes that entered into force in 2020 aim to limit average emissions from
the new car fleet to 95 g/km2. The entry into force of this standard has sparked the transition to
electromobility by forcing carmakers to sell cleaner cars.
Published on an annual basis, T&E’s car CO₂ report tracks the compliance of carmakers (OEMs) with this
regulation and analyses their various strategies to do so. While some carmakers are primarily looking to
reduce their emissions by switching to electric vehicles, all carmakers are benefitting to a certain extent
from the considerable flexibilities in the regulation. However, there are some in particular who are
exploiting these flexibilities to limit their efforts to roll out zero emission vehicles.
This introduction section provides an overview of CO₂ emission trends in the transport sector in the EU
and looks at the 2020/21 car CO₂ regulation as well as the flexibilities it allows to carmakers. The main
analysis is based on car registration data from the first half of 2021 and includes projections made for the
whole year. The CO₂ emissions of new cars are analysed in section 2, and section 3 focuses on plug-in
vehicle sales during the first half of 2021. Section 4 presents T&E’s forecast of the remaining plug-ins sales
required for OEMs to meet their targets for the whole year 2021. Section 5 analyses in more depth the
impact of flexibilities on the stringency of the target beyond 2021. Finally, section 6 presents T&E’s
recommendations to enhance the car CO₂ regulation and make it fit for purpose for the emobility era. In
addition to this report, T&E has published a more comprehensive Technical Annex focused on trends in
the past decades as well as carmakers compliance in 2020.
1.1. Transport emissions: Europe’s biggest climate problem
Emissions from the transport sector have kept increasing since 1990 thus making transport the biggest
source of carbon emissions: in 2018, the transport sector contributed to 28% of the EU’s total CO₂
emissions (with aviation and shipping included).
With CO₂ emissions 22% higher than in 1990, cars are the second biggest contributor to the increase of
transport emissions after aviation. In total, passenger cars are responsible for around 12.5% of Europe’s
annual emissions and account for 43% of total transport sector emissions.
2
In this report, the unit g/km refers to CO₂ emissions per kilometer (gCO₂/km)
A study by 11Figure 1 - Evolution of EU GHG emissions per sector 1990-2019
Figure 2 - EU27 transport greenhouse gas (GHG) emissions per sector in 2019
A study by 12In order to meet the European Green Deal’s ambition of net zero CO₂ emissions by 2050, CO₂ emissions
from passenger cars have to drop quickly, requiring that all new cars need to be zero emission by 2035 at
the latest. Indeed, the average car in Europe drives for 15 years, thus necessitating the last ICE to be sold
in 2035 for the total on road fleet to be zero-emission in 2050. The EU car CO₂ standards regulation -
Europe’s only law regulating the climate impact of new cars - therefore has a crucial importance to
incentivise the uptake of zero emissions vehicles during this decade.
1.2. Current 2020/2021 car CO₂ emissions regulation
The current European 2020/21 CO₂ emissions regulation for passenger car manufacturers was adopted in
2014 and implemented starting in 2020. The current CO₂ standard targets limit carmakers average fleet
emissions to 95 g/km measured using the New European Drive Cycle (NEDC) test cycle3 in 2020. From
2021, equivalent targets are set as emissions are measured using the Worldwide Harmonised Light
Vehicle Test Procedure (WLTP)4. Compared to 2019, the average CO₂ emissions from new passenger cars in
Europe in 2020 dropped by 12% while the share of plug-ins (EVs) tripled.
Nevertheless, the regulation also includes several flexibilities [1] to help carmakers reach compliance
with the targets:
1. 95% phase-in (2020 only): 2020 was a phase-in year, meaning the 95 g/km target only applied to
the 95% least emitting new cars in a carmaker’s fleet. This favored OEMs producing high-emitting
models.
2. Mass-based target: Each carmaker’s target5 is adjusted in function of the average mass of their
fleet: a carmaker selling heavier cars has a less stringent target compared to one selling lighter
cars. Therefore, it discourages the use of lightweighting to reduce emissions and weakens the
stringency of the target because of the growing mass of vehicles (see section 4.3). In 2020 and
2021, the reference value used to adjust carmakers’ targets is the average mass between 2014 and
2016 (1379.88 kg). But, in 2020, the average mass of the European new fleet had increased to 1462
kg [2], meaning that the average 2020 target is 97.7 g/km instead of 95 g/km.
3. Pooling: OEMs are allowed to form pools to jointly comply with CO₂ targets. In a pool, emissions
across manufacturer groups included in it are averaged out. Manufacturers who don’t sell enough
plug-ins can benefit through such collaborations (such as JLR and Honda in the Tesla pool). The
list of pools currently declared6 can be found in Annex 7.1.
3
The NEDC is a driving cycle designed to assess the emission levels of car engines and fuel economy in
passenger cars under lab conditions.
4
The WLTP is the new vehicle homologation procedure replacing the NEDC in 2021. In order to convert
previous OEM NEDC specific emissions targets into new WLTP targets for 2021, the regulation is using an uplift
factor calculated according to the ratio of an OEM’s average WLTP emissions in 2020 over its average NEDC
emissions.
5
This adjustment does not apply for carmakers benefiting from a derogation on their CO₂ target.
6
OEMs have to notify the commission of the pool creation before the 31st December 2021 and submit a
declaration of interest before 31 October in the case of a pool formed by OEM from different groups of
connected undertakings (‘open pool’).
A study by 134. Eco-innovations: OEMs can also claim credits, called eco-innovation credits, for fitting
technology to the car that delivers emissions reductions on the road but not during the test (such
as LED headlamps that are not switched on during the test or during coasting). Eco-innovation
credits are given based on theoretical calculations and lab measurements, but their actual use
and contribution on the road is unknown. The eco-innovation savings are capped at 7 g/km but
no OEM reached this cap yet as the highest contribution was BMW with 1.9 g/km in 2020. The use
of eco-innovations and the distribution among technologies are detailed in the Technical Annex.
5. Super-credits: These are credits given for sales of cars with emissions below 50 g/km. Each
carmaker can use up to 7.5 g/km cumulatively between 2020 and 2022. Most carmakers used all
their credits in 2020 (see the Technical Annex) and the only major OEMs having remaining credits
in 2021 are Stellantis and the Toyota-Mazda-Suzuki-Subaru pool (1.8 and 5.8 g/km in NEDC
respectively). Each car below 50 g/km was double counted in 2020 and 1.67 times in 20217.
6. Derogations for certain carmakers: Carmakers selling between 10,000 and 300,000 cars can
apply for ‘niche volume’ derogations, which sets a target based on a 45% reduction of 2007
average fleet levels. Carmakers selling less than 10,000 cars effectively set their own targets
(‘small volume’ derogation), while carmakers that sell fewer than 1,000 cars are fully exempt.
2. A steady decrease in car CO₂ emissions
T&E acquired car registration data for the first half of 2021 from Dataforce8 in August 2021. The dataset
contains the registration country, registration numbers, emissions values (NEDC and/or WLTP),
powertrain types, and segment information for all car models registered in the European Union (EU27),
Norway (NO) and the United Kingdom (UK). As the UK left the European Economic Area (EEA) in 2021, it is
not part of the CO₂ regulation from 2021, and cars registered in the UK in 2021 will thus not count towards
the carmaker compliance calculations [3]. This report will therefore focus on EU27+NO9.
The WLTP is the new test procedure that will be used in 2021 for compliance calculations. Unless specified
otherwise, emissions values used in this report are obtained from the WLTP data. Registration data from
2020 is based on provisional data from the European Environment Agency [2]. For more details on the
data, methodology and comparison of scopes and homologation cycle emissions please see the Annex
7.2.
7
In 2021, NEDC measurements are still required in order to identify which car is below 50 g/km.
8
Includes content supplied by Dataforce, based on IRIS® (International Registration Information System),
August 2021. The permission to use Dataforce reports, data and information does not constitute an
endorsement by Dataforce of the manner, format, context, content, conclusion, opinion or viewpoint in which
Datafoce reports, data and information or its derivations are used or referenced herein.
9
The UK is only included when a comparison with past data is needed.
A study by 142.1. Emissions trends analysis (H1 2021)
Continuing the trend of emission reductions initiated in 2020 by the entry into force of the 2020/2021 CO₂
standard, emissions from the first half of 2021 further decreased by 8.1% compared to 2020: from 129.8
g/km to 119.3 g/km (EU27+NO scope, WLTP). This decrease is smaller than the 9.2% obtained in the first
half of 2020 compared to 2019, but this is nonetheless the second largest drop in emissions since records
began in 2010. The CO₂ regulation is stricter in 2021 compared to 2020 because some of the flexibilities
are no longer applicable (e.g. the 95% phase-in has ended and super-credits were mostly exhausted in
2020). Therefore, the regulation continues to drive emission reductions as OEMs need to comply with the
higher stringency in 2021. When 2021 is compared with 2019 (EU27+NO), emissions decreased by 18.4%.
Figure 3 - NEDC and WLTP emissions in the EEA
INFO BOX: The largest emissions decrease occurred in 2020
Provisional 2020 data from the European Environment Agency shows that NEDC emissions dropped
from 122.3 g CO₂/km in 2019 to 107.8 g CO₂/km in 2020 [4]. This -12% decrease is the largest decrease in
emissions since the monitoring of CO₂ emissions from new registrations started in 2010.
A study by 15This major reduction in CO₂ emissions is mainly due to the large increase in plug-in sales from 3.5% in
2019 to 11.2% in 2020. In this way, the new standard effectively drove zero and low emissions vehicles
to the market with 6.2% battery electric vehicles (BEVs) and 5.0% plug-in hybrid electric vehicles
(PHEVs) shares of new sales in 2020.
In comparison, T&E analysis carried out using data for the first half of 2020 [5] and assuming that all
carmakers would meet their target, led to a forecast of 5.6% BEV and 4.9% PHEV for the whole year
2020. This highlights that plug-in sales are driven almost exclusively by the stringency of the CO₂
regulation, but it also shows that the success of BEVs slightly exceeded T&E’s projections (by 0.6
percentage points).
A comprehensive analysis of the full 2020 car registration data is available in the Technical Annex
attached to this report.
Figure 4 below shows the distribution of car sales depending on their CO₂ emissions for both 2020 and H1
2021 and maps the shift between these two dates. Fewer high-emitting cars were registered as the right
part of the curve is below the one from 2020. The figure also depicts a shift of the emissions with the
largest sales: the biggest proportion of sales is now at around 120 g/km instead of 130 g/km. The number
of registrations of zero and low emission vehicles below 50 g/km also increased as the left part of the
curve is above the 2020 level.
Figure 4 - Distribution of WLTP emissions in 2020 and H1 2021
A study by 16Figure 5 highlights the emission range of different powertrains. Most PHEVs range from 20 g/km to 80
g/km with an average at 39 g/km. Hybrid electric vehicles (HEV10) emission range starts from 85 g/km with
an average at 132 g/km and pure ICE vehicles have emissions starting from 100g/km with a 140 g/km
average.
Figure 5 - Emission distribution by powertrain in H1 2021
Compared to 2020, the average CO₂ emissions for each powertrain type has reduced, with PHEVs
undergoing the biggest improvement:
- PHEV emissions decreased from 42.7 g/km in 2020 to 38.6 g/km in the first half of 2021 (9.7%
decrease).
- HEV emissions decreased from 135.9 g/km in 2020 to 132.4 g/km (2.6% decrease)
- Pure internal combustion engine vehicles (ICEs) emissions decreased from 144.9 g/km in 2020 to
140.1 g/km in 2021 (3.4% decrease)
Electric vehicles are responsible for almost 60% of emissions reductions
The overall reduction in emissions is driven by both the improvement of each specific powertrain type
(see above) and the increase of the market share of BEVs, PHEVs, and HEVs (see section 3). The
contribution of each of these factors is shown in Figure 6 below. Together, the decrease of ICE and HEV
10
In this report, HEV is used to qualify the group of full and mild hybrids.
A study by 17emissions and the growing share of HEVs amounts to 40% of the emission reduction since 2020. However,
ICE and HEV still have relatively large emissions: 138.3 g/km average.
Regarding PHEVs, their theoretical contribution totaled 40% of the emission reductions witnessed in the
first half of the year. But this contribution on paper does not reflect emission savings on the road where
they actually matter. As outlined in section 3.1.1, the real world emissions of PHEVs is two to four times
larger than the emission results delivered in the lab [6]. It means that more than a third of the emission
reductions in the first half of the year may not have actually been delivered on the road.
Finally, the increase in BEV sales has contributed to a reduction in CO₂ emissions of 18% compared to
2020. This shows there is still a very large potential to reduce emissions further on the road and that the
sales of BEVs must continue to grow in order to achieve our climate goals.
Figure 6 - Factors contributing to official emission reductions between 2020 and H1 2021
2.2. Carmakers’ CO₂ emissions: where are we today?
This section focuses on carmakers’ emissions by pool during the first half of 2021 using the database
provided by Dataforce. The results include 11 OEM pools without a derogation, which together cover
99.6% of registrations over the first half of 2021. Compared to 2020, pooling strategies have changed: FCA
left the Tesla-Honda open pool and merged with PSA to form Stellantis, which declared it would no longer
need Tesla to comply with the regulation in 2021 [7]. The Ford-Volvo pool from 2020 has not been
continued. The Toyota-Mazda pool was joined by Suzuki and Subaru. Volkswagen’s pool will be continued
in 2021 including all brands from the VW Group with the addition of small-scale carmakers such as MG
and SAIC.
Average CO₂ emissions (without regulatory flexibilities) are shown in the Figure 7 below:
A study by 18Figure 7 - Average WLTP emissions by carmaker in H1 2021
With a very high fully-electric car share in its registrations (half), the Tesla-JLR-Honda pool is logically the
leading pool in terms of emissions with 82.9 g/km. It is followed by Volvo that made a significant
improvement from its 125.7 g/km in 2020, to 109.0 g/km in the first half of 2021 mainly thanks to a major
ramp-up of PHEVs that now make up 36.8% of its overall sales. With a still limited share of plug-ins in its
mix, Ford is now among the highest emitters with 125.1 g/km. Daimler, VW and BMW are still among the
highest polluters with 124.0 g/km for VW, and 122.2 g/km for Daimler. Stellantis has emissions close to
the market average (119.0 g/km) in the first half of 2021, despite PSA having emitted the least in 2020, and
FCA being formerly well ranked due to its pool with Tesla and Honda.
A study by 19Figure 8 - Emission reduction between 2020 and H1 2021 by pool
Driven by CO₂ targets, carmakers have achieved significant emission reductions
The difference in emissions between H1 2021 and 2020 displayed in Figure 8 shows that some OEMs
achieved very large reductions in the first half of the year. The Tesla-JLR-Honda pool has the largest cut in
emissions because of the still growing number of BEV sold by Tesla that increase its share in the pool.
BMW and Volvo have the second and third largest reductions with 10.9% and 9.8% cut in emissions
respectively. Among the OEMs with the smallest changes compared to 2020, Toyota-Mazda and Hyundai
have achieved the smallest emission reductions with around -5%. As Toyota's strategy has been
historically focused on the development of HEVs, the Japanese OEM is now late to roll out a more
ambitious electrification strategy needed to drastically cut its emissions. Hyundai suffered from a small
decrease of its BEV sales share from 14% in 2020 to 11% in the first half of the year, leading to slowdown
of its emission reduction despite a still large BEV share.
2.3. But ICEs still emit as much as 5 years ago
Despite a major fall in average market emissions, ICE and hybrid emissions have not markedly improved.
As depicted in Figure 9, ICEs and HEVs have been much slower to cut their emissions as a proportion of
overall emission reductions. While the overall market emissions measured in NEDC decreased by 8.2%
from 2020 (EU27), the emissions from ICEs and hybrids decreased by 3.9% (non-hybrid ICEs decreased by
only 3.1%). In 2020, average ICE emissions were actually higher than five years ago. In the first half of
A study by 202021, emissions of ICEs are only 2% lower than their 2016 level. Had emission reductions continued along
the 2010-2015 trend, ICE emissions would be 19% lower than today at around 94 g/km.
Figure 9 - Comparison of NEDC emissions between ICE and the average
As the emissions of many carmakers went up during the 2016-2019 period, the 2020/21 ICE emissions
reduction is sometimes not sufficient for carmakers to improve on or even match their previous historical
low. To put carmakers’ performance on ICE emissions in perspective, Table 1 compares carmakers’ pure
ICE emissions in H1 2021 with their previous historical low. If H1 2021 emissions were still above the
historical low, the last year with recorded emissions closest to today's level are identified. Among the
laggards, Volvo even had ICE emissions above their 2013 levels and 16 g/km higher than their previous
minimum from 2016, while Daimler and JLR are still above their 2014 level (Daimler emissions were
10g/km higher than in 2016). Other carmakers have barely decreased their ICE emissions since 2016, for
instance, BMW and Volkswagen Group’s emissions were only 1 g/km and 2 g/km lower.
A study by 21Table 1 - Carmakers’ pure ICE emissions in H1 2021 compared with their past minimum (EU27 scope)
Previous
Previous Year closest to
Emissions in H1 minimum ICE
Carmaker minimum ICE the current
2021 (g/km) emission reached
emission (g/km) emissions
in
BMW 124 125 2016
DAIMLER 137 127 2015 2014
FORD 116 119 2015
HYUNDAI 113 124 2017
JLR 178 149 2016 2014
KIA 117 122 2017
RENAULT 112 110 2016
STELLANTIS 107 112 2016
TOYOTA 112 103 2018
VOLKSWAGEN 118 120 2016
VOLVO 140 124 2016 2013
High emitting vehicles
In this section, a high emitting vehicle is defined as a vehicle with emissions above the 2015 emission
target that was defined at 130 g/km and would translate into a 157 g/km in WLTP. In the past decade, the
share of high emitting vehicles decreased from 58% in 2010 to 24% in 2016 before rising again to 33% in
2019. In H1 2021, 12% of cars sold are above this limit showing that the regulation drove a cut in polluting
vehicle sales. Among these vehicles, more than half are SUVs (63%), 16% are utility vehicles registered as
passenger vehicles, and most of the others are high-end vehicles from segment D and E+ as well as sports
cars.
The VW Group has the highest number of these polluting vehicles as the OEM registrations account for the
third of these high-emitting vehicles. For instance, the Volkswagen Tiguan, the Skoda Kodiaq or the Audi
Q5 are included in this category, as well as high end Porsche and Audi models. The second largest
contributor is Daimler with 14% of the high emitting vehicles with a large number of SUVs such as the
GLC, GLE or G-class. Among the other brands, JLR has lower registration numbers but three out of four
A study by 22cars sold by the British OEM emit more than 157 g/km. Moreover, even if Volvo has made good progress
toward electrification, 43% of its registrations are still heavy and polluting combustion engine SUVs.
Figure 10 below compares the emissions and sales volumes of the 15 most popular high emitting cars.
Among this top 15, only two models are not SUVs, and the Mercedes GLE and the BMW X5 have the largest
emissions, reaching above 200 g/km. In addition to these high emitting cars, another category of vehicles
is problematic: as detailed in Technical Annex, pick-up trucks emit 73% more than cars and some models
have extremely high emissions such as the Ram pick-up (323 g/km in NEDC).
Figure 10 - Top 15 of high-emitting vehicles
Carmakers’ communication about electric cars often hides the fact that a lot of carmakers still have a
significant proportion of high emitting models in their lineup - permitted and even incentivised under the
current design of the regulation. Electrification technologies are now largely mature across all vehicle
segments and carmakers should be actively replacing high polluting vehicles with zero emission models
to achieve high climate benefit in a short time.
2.4. CO₂ emissions per country
As the CO₂ regulation is applied to the whole EEA, emissions are averaged across all countries, but data
shows that countries have performed differently. Figure 11 displays the average emissions per country
A study by 23and highlights that most countries have emissions in the range 110-140 g/km (WLTP) with six countries
already compliant with the EU fleet-wide target (Norway, Sweden, Denmark, Finland, the Netherlands
and France). Norway is still the country with the lowest emissions with only 34 g/km, thanks to the
highest plug-in share in Europe (83%). The lowest emitting EU country is Sweden with 98 g/km, it is
followed by Denmark with 103 g/km. With regard to the highest emitting countries, four exceeded 140
g/km: the Czech Republic with 141 g/km, Latvia with 142 g/km, Estonia with 145 g/km, and Slovakia with
155 g/km.
Figure 11 - Average emissions by countries in H1 2021
3. Electric car sales continue to rise
3.1. Plug-in sales trend analysis
This section analyses historic plug-in sales based on ACEA’s quarterly registration data [8] and presented
for the EU27. Figure 12 shows the strong growth of plug-in sales that occurred as a result of the entry into
A study by 24force of the EU CO₂ targets in 2020. In the third quarter of 2021, plug-ins reached 18.9% of the market with
9.8% BEV and 9.1% PHEV. For the first time, plug-in sales exceeded diesel cars sales. This means that
plug-in share doubled compared to the third quarter of 2020 and grew more than sixfold compared to
2019. Looking at sales for the three quarters of the year, plug-ins reached a 16% share of the EU27 market
and plug-in sales were multiplied by five compared to Q1-Q3 2019 (the EV share was multiplied by six).
When Norway is included, plug-ins sales were multiplied by four and they amounted to 17.2% of the
market in the three quarters of 2021 (compared to 3% in Q1-Q3 2019). This shows an increase compared
to the first half of the year alone when plug-ins amounted to 15% of sales in the EU27 market with 6.7%
BEV (16% of sales in the EU27+NO with 7.5% BEV).
Figure 12 - Plug-in share of sales in the EU27
Sales in the third quarter of 2021 exceeded the historical high that happened in the last quarter of 2020
when carmakers focused their efforts to reach compliance at the last minute by boosting their plug-in
sales. Evidence suggests that some carmakers were able to pre-register many plug-ins with their
dealerships, to register some for their internal fleets, or to deliver company cars to their
Business-to-business customers at the end of the year. For instance, Greenpeace [9] calculated that
almost every fourth registration of the ID.3 model (24%) in Europe was attributable to VW and its dealers.
The share of each powertrain as a proportion of total new vehicle sales in the three quarters of 2021 is
displayed in Figure 13. Over Q1-Q3 2021, BEVs accounted for 7.6% of the EU27 registrations and PHEVs
A study by 258.6%. Hybrid vehicles, including full and mild hybrids, reached 19.4% of the market. Other alternative
powertrains account for a negligible share of the market (2.7%) with only 0.5% of compressed natural gas
vehicles (CNG) and 2.3% of liquefied petroleum gas vehicles (LPG). Regarding pure ICE cars, the share of
diesel continues to decrease and reached 20.5% (an 8.5 percentage points drop of the market share
compared to Q1-Q3 2020).
Figure 13 - Powertrain sales share in the three quarters of 2021 in the EU27
3.1.1. 2021: The PHEV problem
The share of PHEVs amongst all plug-in (BEV+PHEV) sales was 36% in 2019 but rose to 53% in the three
quarters of 2021 (55% in the first half of the year), thus overtaking BEVs which have performed better than
PHEVs in 2019 and 2020.
Regarding the distribution of PHEV sales in the different European countries, the majority now sells more
PHEV than BEV (12 countries are selling more BEV). In France, the second largest plug-in market, BEV were
preferred to PHEV in the past (70% of new plug-ins were BEVs in 2017-2019, 60% in 2020) but the trend
reversed with almost an equal share of BEV and PHEV in the three quarter of 2021 (51% BEV). Finland and
Belgium have the lowest share of BEV as only 29% of plug-in registered are fully electric. Greece has 31%
BEV, Spain 33%, and Denmark 35%. Regarding carmakers, the largest contributors to the PHEV growth are
VW, Stellantis, BMW, Daimler and Ford (more details in section 3.2).
Despite being classified as low emissions vehicles with a theoretical emissions average of 38.6 g/km,
PHEVs’ real emissions on the road are much higher than the lab results.
A study by 26Figure 14 - Split between of BEV and PHEV among electric vehicles sales
PHEVs emit two to four times more on the road than in the lab
As shown by the ICCT [10], PHEV real world utility factors (UF) - i.e. the share of the distance that is driven
in the electric mode - are about half of those assumed for calculating official PHEV CO₂ figures. The
private car official average UF is 69% compared to 37% for real-world driving. The gap for company cars,
which accounted for 74%11 of PHEV sales in the EU in 2020, is even wider with 63% officially but just 20%
for real-world driving. This means that the current methodology used to calculate PHEV emissions does
not take into account the real life use of these cars and significantly overestimates the distance that is
driven in electric mode. As a result, WLTP CO₂ emissions are largely underestimated for PHEVs. The ICCT
calculated that the average real world PHEV emissions are in reality two to four times higher (for private
and company cars respectively) than official figures suggest. According to WLTP measurements, PHEVs
emit 72% less than ICE vehicles, but it would be only 37% less12 on the road. In other words, PHEV
emission savings would be halved in the real world compared to lab measurements.
Analysis of the registrations from the first half of 2021 shows that most PHEVs are SUVs (64.3%). This is an
additional issue because, once the battery is exhausted, the combustion engine alone is relied upon to
power the vehicle. In the case of large SUVs, which are heavier and have poorer aerodynamics, this results
in higher CO₂ emissions and fuel consumption than a smaller car. Tests on three popular models
conducted by Emissions Analytics for T&E [11] in 2020 showed that, when not charged, PHEVs’ CO₂
emissions are up to eight times higher than the official figures. Moreover, PHEVs are responsible for a 1.7
11
Author’s calculations based on Dataforce. (2021). New passenger car registrations.
12
On average in H1 2021, ICEs emit 140 g/km (WLTP) and PHEV emits 39 g/km (WLTP). With an estimated
real-world uplift (real-world over WLTP ratio 1.14 and 2.6 for ICE and PHEV respectively), ICEs would emit 160
g/km and PHEVs 100 g/km.
A study by 27g/km weakening of the CO₂ target (WLTP) due to the CO₂ target mass adjustment (PHEVs are 30% heavier
than an average car).
These findings highlight that carmakers are mainly building PHEVs to benefit from regulatory incentives
for low emission vehicles, while failing to deliver the expected CO₂ reductions on the road. This trend
towards PHEVs is consequently concerning and is delaying the uptake of zero emission solutions such as
BEVs. By allowing large mass adjustments to carmakers’ CO₂ targets and by rewarding PHEVs with much
lower emissions than what is achieved on the road, the regulation currently promotes suboptimal
emission reduction strategies from carmakers.
3.1.2. A growing market share for Chinese OEMs
In 2018, Chinese carmakers were absent from the European plug-in market with less than 10 BEV models
registered and a 0.01% market share. Since then, several carmakers succeeded in introducing their
models in the EU market and their volume reached 16,800 units in 2020 (2.8% of the BEV market) and at
least 11,800 in the first half of 2021 (2.9%). 17 models (from 12 Chinese OEMs) were available in the first
half of 2021 in Europe but most of the sales came from two models: the Polestar 2 and the MG ZS both
exceeded 5,000 sales. Geely’s Polestar brand accounts for 48% of Chinese OEM sales and SAIC’s MG brand
is 44%. In addition, three other brands exceeded 200 registrations: Aiways, Xpeng and Maxus.
Figure 15 - Rising Chinese carmaker BEV sales
A study by 28As shown in Figure 15, Chinese BEVs are mainly sold in Norway (37% of Chinese BEV registrations in
Europe) and Sweden (26% of registrations). As a result, Chinese BEVs amount to 9% of the local BEV
market in Norway and 13.5% in Sweden. It shows that Chinese carmakers focus as a priority on the most
mature BEV markets and thus have potential to expand to other countries as the BEV market share
increases across the EU. Many other carmakers have plans to enter the European market: Nio [12] started
its delivery in Norway in September, BYD [13] plans to deliver 1,500 electric SUVs in Norway by the end of
2021 and Great Wall [14] launched its Ora brand in Europe with deliveries starting in 2022.
To ensure they do not continue to lose ground in their domestic market, European carmakers should
commit to a faster transition toward BEVs, by ramping up their investments and line-up.
3.2. Electric car sales by OEM
Most carmakers increased their share of fully electric cars sales in the first half of 2021. The pool
Tesla-JLR-Honda leads with 49% BEV share and Hyundai has the second largest BEV sales share but this
share is down to 10.8% from 14.4% in 2020, amidst the growing competition. Daimler closely follows it
with 10.1% BEV sales thanks mainly to its new EQ model series or the Smart brand models.
Among the laggards, Stellantis BEV models (such as the Peugeot 208 or the Fiat 500) amount to only 5.5%
of its registrations although the carmaker has seen one of the largest growth in BEV sales (72% increase
compared to a low 2020 BEV share). Ford launched its first major BEV model, the Mach-E, which reached
2% of its sales in H1 2021. The Toyota pool comes last as Toyota brand first BEV model will only be sold in
2022 (the current 0.8% BEV share includes Lexus and Mazda models) and FCEV sales are still at a very low
level (only 300 Mirai were registered in the first half of 2021, or 0.08% of the brand sales).
A study by 29Figure 16 - Plug-in sales share and volume by carmaker in H1 2021
When PHEV are included, Volvo, Daimler and BMW rank second, third and fourth respectively in terms of
plug-in share (still behind the Tesla pool). Although most carmakers have a strong focus on direct
electrification, some also sell a lot of hybrid vehicles. For instance, the Toyota pool relies mainly on HEVs
for its compliance, which amount to 72% of its sales, and Hyundai reached 38% with a large increase of
mild hybrids models.
In terms of total plug-in sales volume, the VW pool consolidated its leader position with 235,000 plug-ins
sold (29% of the total BEV sales and 26% of PHEV sales) thanks to its ID models and multiple models in
PHEV versions. Stellantis comes second with 128,000 plug-ins sold and Daimler is third with 97,000 units.
BMW is demoted to the fourth position with 91,000 plug-ins whereas it was close to the second position in
2020. When looking at BEVs only, VW is first, Stellantis comes second and the Renault pool is third.
A study by 30Figure 17 - BEV and PHEV volumes in H1 2021
3.2.1. Most popular plug-in models
Using sales data for the first half of 2021, the most successful BEV and PHEV models are ranked according
to their share of the total plug-in sales in Figure 18. Four BEV models top the plug-in ranking (with sales
accounting for more than one plug-in out of 40) while the best selling PHEV comes in fifth position. The
successful Tesla Model 3 accounts for 5.8% of the plug-in market, the Renault Zoe loses steam and is
downgraded to the second position (the Zoe was by far the most sold plug-in in 2020), the VW ID.3 and
ID.4 are ranked at the third and fourth position (2.9% and 2.6% of all plug-ins). On the PHEV side, the Ford
Kuga, the Volvo XC40 and the Peugeot 3008 are on the podium with 2.3%-2.4% of all plug-in sales (and are
fifth, sixth and seventh respectively when ordered with all plug-ins). A striking difference between BEV
and PHEV top models is that PHEVs are predominantly SUVs: two thirds of the top 15 PHEV models are
SUVs when they are only a third of the top 15 BEV models. As shown in part 3.1.1, this predominance of
large SUVs among PHEVs is a problem with regards to their real world emissions that are often much
larger than what is advertised by OEMs. The comparison of the sales share between BEV and PHEV
highlights that popular BEV models have a larger share of the whole plug-in market (both BEVs and
PHEVs).
A study by 31Figure 18 - Top 15 of BEV and PHEV best-selling models
3.3. Plug-in sales by country
The CO₂ targets are applied to carmakers' sales across Europe, which means that the ability of an
individual member state to attract sales of plug-ins depends mostly on the national incentives that are in
place, as well as the charging infrastructure network. But the overall supply of zero and low emission
vehicles is limited by the ambition set in the car CO₂ regulation, meaning that, as long as supply is limited,
selling significantly more plug-ins in one country will result in selling fewer in another country. Any
individual country therefore has little impact on carmakers’ overall production plans or volumes.
The country with the largest plug-in share of sales is still Norway with 84.7% plug-ins (with 62.5% BEV).
With an efficient charging infrastructure deployment, favorable taxation and an ICE phase-out planned in
2025, Norway is one of the world leaders for emobility. Two other Nordic countries complete the podium:
Sweden reaches a 41.7% plug-in share (including 16.1% BEV) and Denmark has a 30.7% plug-in share.
When looking at fully electric cars only, Norway and Sweden keep the lead but the Netherlands takes the
third position with 12.7% BEV, closely followed by Austria (12.7% BEV) and Germany (11.7% BEV).
A study by 32Figure 19 - Plug-in sales by country in H1 2021
Focusing on plug-in sales volume, Germany accounts for 39.4% of the EU27 plug-in market with 480,000
units in the three quarters of 2021. France registered 210,000 units (17.2% of EU27 plug-ins) and with 8.5%
BEV and 8.1% PHEV. In third and fourth position, Italy and Sweden account for 8.3% and 8.0% of the
plug-in market each but Italy settles for a relatively low plug-in share of its domestic sales (4% BEV and
4.6% PHEV). Among the other large markets, Spain also has a limited share of plug-ins with only 2.3% BEV
and 4.6% PHEV.
4. Carmakers to easily meet CO₂ targets in 2021
This section analyses carmakers’ compliance with the 2021 CO₂ target. First, we present an analysis that is
based on registrations and emissions for the first half of 2021 - i.e. assessing carmakers’ compliance gap
as of July 1st 2021. A deeper analysis then follows looking at compliance for the full year by forecasting
the plug-in sales needed over the full year 2021 with details of each carmaker's compliance strategy.
4.1. Overview of the current compliance gap per OEM
The registration data for the first half of the year 2021 acquired from Dataforce is used to calculate the
average emissions of each carmaker pool in the scope of the regulation (EU27+NO).
A study by 33Methodology
The analysis of 2020 EEA registration data detailed in the Technical Annex is used in order to define the
remaining super-credits of each carmaker13. The expected mass of the 2021 fleets is also defined using
known mass data by nameplate (from provisional 2020 data). The expected average mass of each OEM is
used to calculate the 2021 targets after adding the mass adjustments. The potential savings from
eco-innovations are calculated assuming that the eco-innovations used in 2020 in the Lights and
Alternator category (previously approved with the NEDC) are replaced by the equivalent eco-innovations
approved with the WLTP. More detail about the methodology can be found in Annex 7.2 and carmakers’
detailed status is presented in Annex 7.3.
Five carmaker pools already compliant as of July 1
With sales from the first half of the year, five pools are already compliant with their targets thanks to a
combination of strategies including increased plug-in sales, more efficient ICEs and/or a reliance on
regulatory flexibilities.
Figure 20 - OEM’s compliance gap in the first half of 2021
Tesla-JLR-Honda is largely over-compliant (53 g/km) as most of its sales are already fully electric cars
(49%). As Volvo increased both its plug-in sales (to reach 45% EV) and its overall fleet mass (expected at
around 1930kg, which leads to a 21.4 g/km weakening of its target), the Swedish carmaker now has the
second largest overcompliance compared to its target (25 g/km). BMW has a 7 g/km overcompliance,
mainly thanks to an increase of PHEVs that amount to 18.5% of its registrations. Daimler relied on a large
13
According to the analysis, only the Toyota pool and Stellantis have super-credits remaining to be used in
2021.
A study by 34increase of both BEV and PHEV sales to exceed its target by 3 g/km (32% plug-ins). But Daimler’s very
heavy PHEVs also contributed to a major increase of its fleet mass and thus to a weakening of its target by
15.6 g/km). Without these large benefits from regulatory flexibilities, Daimler and BMW would not comply
with their targets. Stellantis complies with the smaller margin of 2.1 g/km. As most of these carmakers are
still expected to keep increasing their plug-in sales in the second part of the year, and given they already
have a relatively large advance on their target, they are expected to easily meet their targets at the end of
the year.
Six pools are not yet compliant as of July 1
Ford, the Toyota pool and Kia are very close to their targets with a gap lower than 2 g/km. After a good
launch in the first part of the year, the Mach-E BEV model would be the main compliance tool that could
help Ford to close the remaining 0.9 g/km gap and meet its target by the end of the year. Despite a
comparatively good performance from the Toyota brand alone, the Toyota pool is penalised from high
emission from other pool members (mainly Suzuki and Subaru) and has a 1 g/km gap with its target. With
a current 1.6g/km gap to its target, Kia would need to increase its plug-in and hybrid sales in the second
part of the year in order to comply.
With a compliance gap larger than 2 g/km, three carmakers will need to undertake a bigger push than
others to comply by the end of the year. Volkswagen, which did not comply in 2020 (more details about
carmaker compliance in 2020 can be found in the Technical Annex), is still at risk of falling short in 2021
with a 2.7 g/km gap to make up, and Hyundai will need to increase its BEV share to close its 3.3 g/km gap.
Close behind, the Renault pool has a 3.4 g/km gap to its target that will be easily closed as the pool is
expected to sell a much larger amount of BEVs (Dacia Spring, Nissan Leaf, ...) to recover in the second half
of the year.
All carmakers are either already over-compliant in the first half of the year or have many levers to close
the relatively small remaining gap to their targets in the full year (as explained in the next two sections).
Therefore, all carmakers are on track to comply with the CO₂ regulation in 2021.
4.2. 2021 plug-in sales per OEM
T&E projected the share of plug-in that OEMs would need to sell in the full year 2021 to comply with their
targets (methodology detailed in section 4.2.1 below and carmakers strategies detailed in Annex 7.3).
According to this model, average plug-in sales across Europe are projected to reach 17.7% in 2021 with
around 8.9% BEVs and 8.8% PHEVs.
T&E’s 2021 compliance projection modelling finds the following OEM plug-in sales share: the Tesla pool
would achieve 51% BEV sales, Volvo is expected to sell up to 49% plug-ins (with 12% BEVs), followed by
Daimler with 34% plug-ins (15% BEVs) and BMW is projected at 27% plug-ins (but its BEV share would stay
at a low 8%). Kia would increase its BEV share up to 10% and reach 21% plug-ins. The VW pool is
projected to reach a 18% plug-in share with its BEV share increased to around 10%. Hyundai BEV share is
A study by 35projected to recover from H1 and reach 13% for the whole year with a 17% plug-in share. The
Renault-Nissan-Mitsubishi pool is expected to reach 11% BEV (15% plug-ins). Ford is projected to comply
with at least a 2.4% BEV share but a higher PHEV share leading to 12% plug-ins. Stellantis is projected to
finish the year with 11% including 6% BEV. Finally, the Toyota pool would settle for only 4% plug-ins.
Figure 21 - Projected plug-in share in the full 2021
Close to 2 million plug-ins will be sold in 2021
In 2021, 1.9 million plug-ins are projected to be sold made up of 960,000 BEVs and 955,000 PHEVs14. While
the market share of plug-ins is expected to be multiplied by 5 from 3.5% in 2019 to 18% in 2021, the
number of plug-in sold is multiplied by 4.1 (from 460,000 units in 2019 to 1.9 million in 2021) due to lower
overall car sales.
BEV volume is projected to be multiplied by 3 compared to 2019 and PHEV volume by 6. The fact that
PHEV sales have grown twice as much as BEVs emphasises the worrying trend toward a less efficient and
14
Volumes are calculated assuming that sales volumes in H2 stay at the same level as H1, the total sales
number would reach 10.8 million at the end of the year in the EU27+NO market. Some uncertainties remain
because, despite a growing demand due to the post-covid recovery, the global car production is expected to
slow down in the second part of the year due to the current chip crisis [15].
A study by 36more polluting technological solution (PHEVs). Assuming BEV share would have grown as much as PHEVs,
the share of BEV would reach 17% today and the market average emissions would be 10% lower.
Figure 22 - Projected plug-in volumes in 2021 compared to 2019 and 2020
The VW pool is expected to keep its leading position with regards to plug-in sales volumes with around
520,000 plug-ins, followed by Stellantis with 270,000 units and Daimler with 195,000 units. When looking
at fully electric cars, the podium is expected to be: VW first with 275,000 BEVs, Stellantis second with
150,000 units and the Renault pool third with 140,000 units.
Methodology
For OEMs that are already compliant with the regulatory targets, a likely scenario was defined based on
production forecasts15 and new models coming to the market. This is a conservative scenario that does
not reach the maximum sales potential of each OEM. For OEMs that are not compliant after the first half of
the year, BEV, PHEV and HEV shares are increased in order to reduce the emission average down to the
level needed for compliance. A two-step approach (detailed in Annex 7.2) ensures that any increase in the
relative share of a powertrain can be justified by carmakers’ sales and production strategies. First, T&E
assumes a carmaker cannot reach sales that are significantly above its production forecast. In cases
where a compliance gap remains, powertrain shares are increased accordingly and depending on new
models available, assuming these models perform better than projected.
15
Carmakers production forecast were analysed in T&E’s 2021 EV report [16]
A study by 37You can also read