An Analysis of Sweden's Carbon Footprint - WWF SWEDEN 2008
←
→
Page content transcription
If your browser does not render page correctly, please read the page content below
W WF SWEDEN 2008:

An Analysis of Sweden’s
Carbon Footprint

Report for WWF prepared by

Jan Minx, Kate Scott, Glen Peters* and John Barrett
 Stockholm Environment Institute, University of York, Heslington, YO10 5DD, UK
  *Industrial Ecology Programme, Norwegian University of Science and Technology (NTNU),
                               NO-7491 Trondheim, Norway

                                                                                          2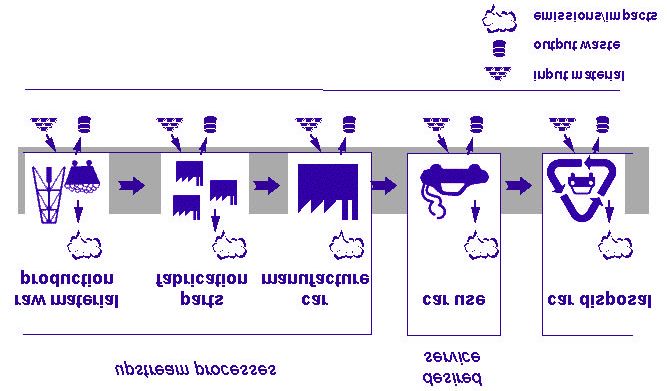
Contents
Executive summary                                                            4–7

1. Introduction                                                                8
    Living beyond limits                                                       8
    Living in a changing climate                                              10
    A low carbon Sweden – governments, business and people acting together    12
    Accounting for climate change – the carbon footprint                      13
    Structure of the report                                                   16

2. The Swedish situation                                                      17
   Trends in Sweden’s territorial CO2 emissions                               17
   Drivers of industrial CO2 emissions                                        19
   Sweden’s carbon footprint                                                  21
   The carbon footprint of Sweden’s imports                                   24

3. The carbon footprint of households                                         28

4. The carbon footprint of government                                         32

5. Businesses: sectoral contributions to the carbon footprint                 34

6. Towards a low carbon Sweden                                                40

7. References                                                                 43

Methodology                                                                   45
Methodology references                                                        48

                                                                                   3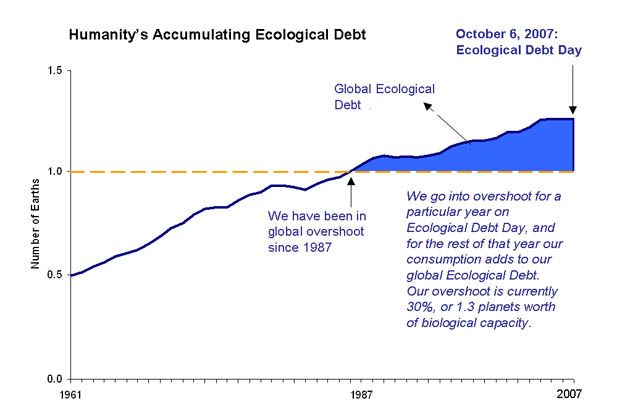
Towards a low carbon Sweden:
executive summary
Ecological debt day arrives earlier each year – our insatiable consumer wants are driving us to use up the
Earth’s resources at a rate which the planet cannot regenerate them, known as overshoot. Yet these
consumption patterns are not met equally around the world, instead the poverty gap is widening. Growing
populations in the poorest parts of the world is putting even more pressure on them to meet their basic needs
for food, water and shelter.

Figure I shows the trend in global CO2 emissions in the last century, highlighting that in 1956 we started
releasing more carbon dioxide into the atmosphere than the recommended volume necessary to keep our
climate stable (70% below current levels, Stern, 2007).

Figure I: Global carbon dioxide emissions overshoot (adapted from Marland et al., 2007)

We are releasing more carbon dioxide into the atmosphere than can be absorbed by ecosystems, oceans and
geological systems. There are signs already today that global pollution is too much for the planet to cope
with: our climate is warming causing ice sheets to melt and sea levels to rise, droughts and flooding are
increasingly common, crops are failing and species are becoming extinct. These are strong signals that we
need to deal much more carefully with our planet’s resources, if we want to avoid ecological disaster.

It is the world’s poorest countries that are most vulnerable to the effects of global warming and ecological
disaster as they do not have the resources to cope. Industrialised countries have developed their economies,
                                                                                                                4
and as a result are responsible for the majority of carbon dioxide in the atmosphere today. Poorer countries
will need to increase their emissions to allow more people to meet their basic needs, and so industrialised
countries must therefore lead the way out of crisis by drastically reducing global emissions. This is
recognised as economically the most efficient solution to deal with climate change.
Leading Sweden to a low carbon economy is not an easy route to take, but it will secure the future for
Sweden, providing a better quality of life for all. No one is exempt from the effects of climate change. We
must make immediate changes to the way we produce and consume goods and services in order to contribute
to the necessary global reductions of CO2 emissions
This report assesses Sweden’s contribution to climate change from two perspectives: Sweden’s territorial CO2
emission account and Sweden’s carbon footprint. Whilst CO2 is just one of several greenhouse gases and
climate change is just one of the implications of resource overshoot, they represent the greater part of the
problems we face today. We have highlighted the issues associated with purely taking territorial emissions
into account, which does not reflect the full climate change impacts of life in Sweden.
The global climate change impacts of Swedish citizens are 17% higher than suggested by the territorial
emission account, and so unless the territorial emission account is adjusted to include emissions embodied in
traded products consumed within Sweden, Sweden’s contribution to climate change, like most other
industrialised countries, will be under-estimated. To achieve a low carbon economy, Sweden must reduce
greenhouse gas emissions from its territory, whilst also reducing global emissions from consumption,
addressing the production of products in other countries.
The analysis of the Swedish context results in the following conclusions and raises some key areas for policy
consideration:
• Sweden has not succeeded in reducing its territorial emissions
since the start of climate change negotiations in 1992
Sweden has shown its commitment to climate change and has been acknowledged as a leader in climate
performance and will succeed in achieving its Kyoto targets, allowing Sweden an overall increase in
emissions of 4% 1990 levels, within the EU combined reduction target of 8%. However, maybe due,
therefore, to a lack of motivated policy goals, Sweden has not succeeded in reducing its territorial emissions
since the start of climate change negotiations in 1992, over 15 years ago. Current levels of CO2 emissions are
not enough to prevent dangerous climate change and Sweden must push for more ambitious reductions. In
order to reduce domestic emissions in line with necessary longer term climate targets, policy needs to focus on
energy, transport and food.
Technological carbon-efficiency improvements have been achieved in all sectors, with the exception of
‘agriculture, forestry and fishing’ and much more notably the transport sector. The majority of the transport
industry is reliant on fossil fuels, mainly oil. The government needs to see though its target of ending its
dependence on oil by 2020. This should not be at the expense of increasing its reliance on nuclear power.
5There are more than enough renewable energy sources in Sweden to provide a diverse, secure low carbon
electricity supply, alongside appropriate options for improvements in energy efficiency.
Nuclear power comes with considerable uncertainty and risk, and the option of increasing biofuel use is also
not without controversy. It is important to note that the carbon tax and energy certificates promote investment
in the least cost renewable resources, which is creating a firm demand for biofuels. However, biofuels have
been criticised for causing a loss in biodiversity, placing increased pressure on water resources, adding to
deforestation and taking away land that could feed a growing world population. This demand for biofuels,
partly due to its cost effectiveness compared with other alternatives, does not encourage wind power, which
needs strong, targeted support.
• Sweden’s carbon footprint is higher than its territorial emissions,
with the majority of CO2 attached to imports coming from the EU
Territorial emissions do not reflect the full climate change impacts of Swedish citizens. When taking global
consumption emissions into account, Sweden’s emissions are 17% higher. Therefore, the government’s
framework must take account the CO2 attached to traded products. It’s too easy to say that Swedish
consumers should be held fully responsible or that Sweden should take care of all these emissions as they have
paid for the products. Yet it is more an issue of costing not taking into account the full externalities of the
product, such as the environmental impacts of that product.
Another important issue relating to this is the current design of the Kyoto Protocol that means Non-Annex
parties, such as China and India, have no targets to meet (as oppose to Annex I parties such as Sweden) as of
yet. Industrialised countries need to be aware of this and make efforts to help reduce these emissions through
mechanisms outlined in the Kyoto agreement.
As the majority of emissions attached to Swedish imports are from the EU (40%), Sweden should continue to
be a leader in sustainability policies within the EU and push for stronger climate change agreements between
Member States. The EU Emission Trading Scheme is having little success as caps (the overall limit of
emissions per country) have been set too high, meaning that countries do not need to trade for carbon
allowances. Most importantly, Sweden should ensure trading takes place by pushing for considerable
reductions of caps. This will add to greener supply chains for products consumed by its inhabitants through
reduced CO2 embedded in imports.
• Over three quarters of Sweden’s greenhouse gas emissions
come from households – mainly energy, transport and food
In the past policies have focused on industry and cleaner production. Over time industry has improved its
carbon-efficiency; however, technology alone can’t fix the problem. These gains have been largely offset by
rapidly increasing consumption levels; therefore there is an obvious need for government policy to target
household consumption, mainly in energy, transport and food, making up 80% of household emissions. The
bottom line of changing lifestyles is that everyone is aware of the problem and that they think it matters to
them. The government and regulatory authorities need to ‘help people help climate’ by making sustainable
6solutions easier to take up. This starts from helping people understand the problem, supporting them in their
choices through the provision of information, and adjusting the incentive system to reward sustainable
lifestyles (Barrett et al., 2007).
• Territorial emissions are driven by the growth effect
The growth effect has been evident in Sweden. The carbon-efficiency of industries has improved and as a
result has lead to cheaper products, which has caused a rise in their consumption. Policy needs to target
improving energy efficiency, whilst reducing emissions from consumption caused through increased demand.
One efficient way to counteract the growth effect is through fiscal levers or ecological taxation (Barrett et al.,
2007). Incentives, subsidies and grants will provide a pricing framework that rewards sustainable behaviours.
This would involve placing higher taxes on unsustainable activities, and lifting taxes or subsidising
sustainable ones to encourage people to a more sustainable lifestyle.
This report leads us to the conclusion that it’s not just about consuming differently, but it might be that we
could consume less. Whilst we are exercising greener choices, our efforts are being offset by our increasing
levels of consumption. We can address this issue through looking at our life-work balance. It is often
acknowledged that people would be happy to work less and have more leisure time, for example to spend with
their family. Through working less and earning less, we would consume less, yet we have the incentive to
improve our quality of life in doing so.
• The government has immediate influence over more than 50% of its domestic emissions
The government should lead by example and adopt strong regulations in accordance with the environmental
impacts of all its activities. The government need to strengthen public procurement and adopt more stringent
standards where they purchase the most ecologically sound products.
Most importantly, the Swedish government must provide leadership through a collective framework for
change. People and businesses cannot be expected to swim against the tide. The government need to put the
infrastructure in place to enable businesses and individuals to make the change towards more sustainable
behaviours, through communicating change, adopting strong climate regulations and providing incentives to
reward sustainable businesses, behaviours and lifestyles.
71. Introduction
1.1. Living beyond limits
Our planet possesses only a limited amount of land and natural resources to provide for all humanity’s needs
and wants and only a limited capacity to absorb pollution and wastes. However, there are signs already today
that global resource use and pollution are too much for the planet to cope with: our climate is warming
causing ice sheets to melt and sea levels to rise, droughts and flooding are increasingly common, forests are
disappearing, fisheries are collapsing, crops are failing and species are becoming extinct. These are strong
signals that we need to deal much more carefully with our planet’s resources, if we want to avoid ecological
disaster.
The Ecological Footprint, a calculation of the productive area we need to live the way we do today, provides
evidence that humankind would need the biocapacity of more than one planet to sustain today’s lifestyle over
time (see Figure 1). 1987 saw our first Ecological Debt Day, where we started using our planet’s resources
more rapidly than the planet could regenerate them. Each year, our demands on the environment are rising,
and we use up the available resources earlier. In 1987, Ecological Debt Day fell on 19th December. It jumped
to 21st November by 1995, and 2007 fell on October 6th.
Figure 1: Ecological overshoot (GFN, 2007)
8The main driver of our increased demands on the planet over the last decades is an explosion in global
consumption driven by seemingly insatiable consumer wants.
However, countries have not equally benefited from this consumption growth. While there is a global
consumer class – mainly based in industrialised countries – growing in extent and affluence, more and more
are slipping deeper and deeper into poverty and are not able to meet their basic needs for food, water and
shelter. Today the overall consumption of the richest fifth of the world’s population is nine times that of the
poorest fifth (UNEP, 2002).
In line with these disparities in the global geography of consumption, the lifestyle of people in different
countries poses very different demands on the planet and countries have contributed very differently to global
environmental problems. While the Ecological Footprint of the average American, for example, is 9.4
gha/cap, a person in India only has a footprint of 0.9 gha/cap. The Ecological Footprint of Sweden is 5.1
gha/cap. In comparison to the recommended 2,1 gha/cap that the planet is able to cope with (WWF, 2008), we
would need another 2 planets to sustain our lifestyle if everyone in the world would live like we do in Sweden.
Therefore, the world is faced with a twofold challenge. We need to reduce the overall demands on the planet
while meeting our present needs more widely and to allow future generations to meet their needs. This is the
idea behind the concept of sustainable development, which we hope will lead to “the fulfilment of basic needs,
improved living standards for all, better protected and managed ecosystems and a safer more prosperous
future” (UN, 1992).
In 1992 countries met at the UN Conference on Environment and Development, also known as the Earth
Summit, to discuss how sustainable development can be addressed globally. Climate change was of specific
concern, because it is currently seen as one of the major challenges to mankind. Figure 2 shows the trend in
global CO2 emissions in the last century, highlighting that in 1956 we started releasing more carbon dioxide
into the atmosphere than the recommended volume necessary to keep our climate stable (70% below current
levels, Stern, 2007).
9Figure 2: Global carbon dioxide emissions overshoot (adapted from Marland et al., 2007)
This report focuses on climate change – and particularly Sweden’s contribution to it. We analyse carbon
dioxide (CO2) emissions from Swedish production and consumption. Carbon dioxide is the greenhouse gas
with the largest anthropogenic contribution to climate change causing around three quarters of the total
warming effect (Stern, 2007). Like others, we discuss the CO2 emissions from Swedish territory. However,
this does not reflect the full climate change impacts of life in Sweden. To deal with this issue, we introduce
the carbon footprint, which assesses the global CO2 emissions from final consumption activities in Sweden –
in whichever country they might occur.
1.2. Living in a changing climate
We are releasing more greenhouse gases into the atmosphere than can be absorbed by ecosystems, oceans and
geological systems. The IPCC (2007) present strong evidence showing that the accumulation of these in the
atmosphere is causing global temperatures to rise, and having irreversible consequences on our planet.
“The scientific evidence is now overwhelming: climate change is a serious global threat, and it demands an
urgent global response” (Stern, 2007)
Global mean temperatures will continue to rise unless stocks of GHG in the atmosphere are stabilised at a
level that the Earth system can naturally absorb from the atmosphere annually. Concentrations of greenhouse
gases are currently 430 ppm, adding 2–3 ppm a year. If we continue to release GHG in the volumes we are
producing just now, these will reach detrimental levels of over 700 ppm by the end of the century (Stern,
2007).
Serious and immediate action is required to cut GHG emissions globally. For example, to stabilise at 550 ppm
CO2 equivalent, we would need to be 25% below current levels (2000 levels) in 2050 and see a reduction of at
least 1 – 3% per year. To stabilise at 450 ppm CO2 equivalent we would need to be 70% below current levels
in 2050, with a 5% reduction per year (see figure 3). The lower the concentration of stabilisation, the less the
10risk of severe climatic events. According to the Scientific Council on Climate Issues1, the EU's two‐degree
target is more likely to be achieved if GHG concentration in the atmosphere is stabilised in the long term
at 400 ppm carbon dioxide equivalents.
Figure 3: Emissions paths to stabilisation and the associated temperature change (Stern, 2007)
The next question is who should cut emissions and how much? This question is at the heart of the climate
change negotiations. Even though this must not necessarily be the case in the future, GHG emissions have so
far been closely related to countries’ economic success and grown together with GDP. Therefore,
industrialised nations are the source of most past and current emissions. At the same time the poorest countries
have contributed least, but are often most vulnerable to the consequences of climate change. Of the 262
million people affected by climate disasters annually from 2000 to 2004, over 98 percent of them were from
less developed countries. Tuvalu, a disappearing country under the rising sea, highlights the immediacy of
climate change, presenting what are likely to be the first permanent climate change refugees (see Box 1).
Hence, there is a divide: The main causers of climate change have most resources to protect themselves
against the consequences of climate change and are not the ones who feel the impacts most severely. Climate
1
Commissioned by the Swedish Government to provide a scientific assessment as a basis for the work of the Swedish Climate
Committee, the all-party committee for the review of climate policy
11Change has therefore become a wider issue of meeting basic human needs more widely across the planet. This
is reflected in the title of the most recent Human Development Report published by the United Nations:
“Fighting Climate Change: Human Solidarity in a Divided World” (UNDP, 2007)
“In today’s world, it is the poor who are bearing the brunt of climate change. Tomorrow, it will be humanity
as a whole that faces the risks that come with global warming.” (UNDP, 2007)
Box 1: Tuvalu – a disappearing country
Probably one the most striking examples for the impacts of climate change and proof of a world being in a
state of emergency is Tuvalu. Located in the Pacific Ocean, it is one of the smallest and most remote
countries on earth. Made up of 9 small low-lying islands, with no point reaching 3 meters above sea level, the
country is in danger of disappearing.
The sea is inextricably linked to Tuvalu’s natural and social systems. With rising sea-levels, warming
temperatures and frequent stormy weather, the islands are at massive risk. The population’s livelihoods are
dependent on agriculture, their food supply is dependent on fish stocks and island vegetation vulnerable to the
climate and their land is being lost to the sea.
Plans for evacuation are being made and Tuvalu seems to be destined to become one of earth’s first nations to
be washed away due to the effect of global warming. This would make Tuvaluans the first complete nation of
climate refugees, banned from their islands with their culture and identity taken away.
In April 2007 the Permanent Representative of Tuvalu made his statement to the United Nations at a Special
Session of the Security Council on Energy, Climate and Security. Without having contributed to climate
change but yet facing the full consequences, he appeals to the United Nations to find a global strategy and he
longs for solutions and decisions to be taken at the highest level of government (Pita, 2007).
It is clear that many of the poorer countries will need to increase their GHG emissions to allow more people
meeting their basic needs. Industrialised countries must therefore lead the way out of the crisis by drastically
reducing emissions in a global process of contraction and conversion. The Kyoto agreement was a first step
into this direction even though much stronger commitments will be required in the future.
The incentives are there. Looking to the future, no country – however wealthy or powerful – will be immune
to the impact of global warming. The Stern report has further highlighted that immediate, strong action lead
by developed countries is also the economically most efficient solution to deal with climate change.
1.3. A low carbon Sweden – Governments, business and people acting together
If we act now, we can avoid the most serious impacts of climate change. We need ambitious action from
around the world to achieve the 80% reduction in GHG emissions required to stabilise atmospheric
concentrations at a level which is likely to avoid dangerous climate change. Sweden is amongst the 56
countries that together are responsible for over 90% of global energy-related CO2 emissions. While Sweden
12will have no problems in meeting its climate changes target as established in the Kyoto Protocol, there is still
much to be done to achieve what might be considered as a low carbon/one planet economy:
• GHG emissions from Swedish territory will need to be further reduced;
• Global GHG emissions from Swedish consumption occurring in the production of products in other
countries will need to be addressed.
In order to progress towards a low carbon/one planet economy, government, business and people need to act
together in a 'triangle of change' (figure 4). Different corners lead at different times by doing what they can do
best. It is difficult to expect any stakeholder group to act alone; instead it is good to think of the notion ‘I will
if you will’ where a coordinated approach will create the opportunities and responsibilities to accelerate
change (SDC and NCC, 2006).
Government
The products and
services people use,
and the infrastructure
available, link
government with
business and people
Business People
Figure 4: The ‘triangle of change’
1.4. Accounting for climate change – the carbon footprint
A precondition for effective action is to develop an understanding of Sweden’s full climate change impacts
based on sound scientific evidence. There are different ways in which we can account for greenhouse gases.
Emission inventories, as used in international climate negotiations, usually focus on emission sources: CO2
emissions from cars on Swedish roads, machines in Swedish factories or methane emissions from cattle raised
in Sweden. We will refer to emissions directly emitted by an activity as direct emissions. The sum of all
emissions from Swedish soil is referred to as territorial emissions.
13However, our livelihood depends on consumption and it is equally important to evaluate how and what we
consume (see Peters, 2008). Opposed to public perception, the majority of climate impacts of individuals are
not associated with the direct emissions from heating our houses and driving our cars, but with the products
we buy. For example, the climate change impacts of a car are not only related to the emissions of driving it,
but also to emissions associated with raw material extraction, manufacturing, distribution and disposal of the
car (see Box 2). Many of these occur outside the Swedish boundaries in other countries. Hence, consumption
of final products instigates a whole chain of production activities throughout the global economy. We will
refer to these upstream and downstream emissions triggered by a final consumption activity as indirect
emissions.
Box 2: Emissions associated with the purchase of a car
In the production process there is a hierarchy of production layers, and each one of them needs inputs like
materials and energy. The (raw) materials and parts to manufacture the car will be purchased from a range of
specialised industries upstream. It is likely that they themselves obtained materials from other industries and
so on. The parts of the car are transported downstream to factories in order to put the car together and deliver
it to retailers. All these steps use up resources and emit pollution in the process, pollution and resource use
that should be accounted for when calculating the emissions associated with purchasing a car.
Once the car is sold to consumers, additional resources are required and pollution is generated when people
drive it. The literature suggests that the most direct environmental impact comes from the fuel used to power
it. Whilst many people think only of these emissions when they consider a car, this example demonstrates that
there are a lot of indirect environmental impacts hidden in the complex combination of production layers,
sectors and even countries involved in its fabrication.
Therefore, the total climate change impact of economic activities in Sweden is not captured by a territorial
emissions account. Trade and all the emissions arising globally to produce the products consumed in Sweden
14need to be taken into account. We will refer to the direct and indirect emissions from final consumption
within Sweden as its carbon footprint. Box 3 defines the carbon footprint and summarises the relationship
between territorial emissions and the carbon footprint.
Box 3: Territorial emissions and the carbon footprint – which to chose?
Sweden’s carbon footprint = the global CO2 emissions from consumption within Sweden
The carbon footprint is the global emissions produced from final demand in Sweden, with the emissions from
imports consumed within Sweden included and the emissions attached to exported products excluded, whilst
territorial emissions are the emissions produced in Sweden, including those which are attached to products
consumed abroad (figure 5).
Swedish consumption
1
2
Final consumption in Exports from Sweden
Production in Sweden Sweden
3a
3b
5a, 5b 4a
4b
3 4
Production abroad Consumption abroad
Arrows should be read as “Emissions occurring in [beginning of arrow] due to [end of arrow]”
Figure 5: Emissions occurring through Swedish economic activity, including trade and different principles of
emissions accounting (adapted from Wiedmann et al., 2007).
• 1) Domestic Swedish emissions due to Swedish final consumption
• 2) Domestic Swedish emissions due to export
• 3a) Imported emissions to domestic industry due to Swedish final consumption
• 3b) Imported emissions to domestic industry due to Swedish exports
• 4a) Imported emissions direct to final demand due to Swedish final consumption
• 4b) Imported emissions direct to final demand due to Swedish exports
• 5a) Swedish residential emissions due to travel
• 5b) Swedish residential emissions not due to travel (e.g. housing)
• Territorial emissions: 1 + 2 + 5a + 5b
• Carbon footprint: 1 + 3a + 4a + 5a + 5b
When setting targets, both national and international, they are set according to territorial emissions. It is the
principle presumed in the Kyoto agreement of the UNFCCC.
15Having a closer look at accounting in this way, it reveals its inherent problems: as developed countries shift to
a more highly skilled and service economy they tend to import carbon-intensive products from less developed
countries. Thus, the production of CO2- intensive goods takes place in other countries and the emissions are
charged to their national emission-account. This is one of the reasons why highly developed countries like
Sweden have low carbon emissions – less developed countries take responsibility for demands by the
industrialised world.
Therefore, international trade has an increasing influence on the ability to fulfil national CO2 targets as a
significant amount of CO2 is embodied in goods traded internationally (Munksgaard and Pederson, 2001).
There are a variety of other reasons why it is important to take into account the global emissions from
consumption. First, only by taking a consumption perspective the full climate change impacts of life in
Sweden can be quantified. Particularly, in carbon efficient economies like Sweden, consumption activities
tend to have larger climate change impacts than production activities. Second, the Kyoto agreement only sets
emission targets for industrialised countries like Sweden. Territorial emission targets could be achieved by
these countries through shifting carbon intensive production activities to countries without binding targets.
This is commonly known as the problem of carbon leakage. Third, with global trade currently growing twice
as fast as global GDP, the increased number of imported products from less carbon efficient economies might
remain the ultimate challenge for Sweden to reduce its global climate change impacts.
1.5. Structure of the report
This report establishes and analyses territorial and carbon footprint accounts of Sweden. To fully account for
the climate change impacts of trade it uses an 87 country model to reflect carbon intensity of production
processes in different parts of the world adequately. To our knowledge such a comprehensive analysis has not
been undertaken before. The structure of the report is as follows:
In the first Section we deal with trade related issues and associated differences between territorial emissions
and carbon footprint. The remainder Sections of the report each discusses one of the corners of the triangle of
change representing one actor. In particular, we identify what activities in Swedish households contribute to
high emissions, where government have the ability to reduce their emissions; we also identify the most
carbon-intensive industries and supply chains, and consider the hidden emissions of services. Based on this in-
depth understanding we outline implications for Swedish efforts in reducing their climate change impacts – at
home and abroad.
162. The Swedish situation
2.1. Trends in Sweden’s territorial CO2 emissions
*United Nations Framework Convention on Climate Change (international transports are not included)
Figure 6: Development of direct territorial CO2 emissions by producer
Sweden has recently been highlighted as one of the most successful countries in combating climate change in
a study which measures territorial emissions (Germanwatch, 2007). The climate change performance index
assesses a countries’ progress in reducing CO2 emissions by taking into account the current levels in energy-
related territorial CO2 emissions, current trends as well as the climate change policies implemented so far.
Sweden’s good performance has mainly been driven by its low levels of CO2 emissions. Our results confirm
that with 60 million tons or 6.6t tons of CO2 per capita Sweden emits much less CO2 emissions from its own
territory than other industrialised countries. This is particularly driven by the low carbon nature of Sweden’s
electricity producing sector.
The results in this report are based on CO2 emissions from Swedish national environmental accounts, which
are slightly higher than the estimates from the UNFCCC (as presented in figure 5); however, the trend remains
the same. The UNFCCC territorial accounts do not allocate international transportation to a country due to
problems assigning responsibility and poor data (Peters, 2008).
Sweden’s success in reversing trends in territorial CO2 emissions has been rather limited (see Figure 6). Since
the beginning of the international climate change negotiations at the Earth Summit in Rio de Janeiro in 1992,
Sweden has not managed to stabilise the carbon output from its domestic territory. Between 1993 and 2003
17direct carbon emissions have risen by 4.3% or 2.6 Mt.2 The main cause of this rise have been increasing levels
of CO2 emissions from industries: in 2003 the industrial sectors emitted 6.8Mt3 or 16% more CO2 than in
1993. Direct emissions from households and government have been reduced significantly by 17% and 49%
respectively over the same period of time.
However, it is important to highlight that these are purely direct emissions, and that we shouldn’t
underestimate the influence of indirect emissions from government and households as drivers of CO2
emissions. While these developments might still be sufficient to reach Sweden’s modest short terms targets
and Kyoto commitment of reducing overall greenhouse gas emissions by at least 4% by 2008-2010, these
developments indicate the lack of ambitious climate change policies so far.
Overall the Germanwatch (2007) study therefore paints a bleak picture: if climate change was an Olympic
discipline, no country would deserve to climb the winner’s victory podium. If the world wants to stabilise
atmospheric carbon concentrations at levels which are likely to prevent dangerous climate change (see IPCC,
2007), none of the assessed countries is even close to being a sustainable low carbon economy. The Swedish
Climate Committee, the all‐party committee for the review of climate policy has agreed that at least a 75-
90% reduction is needed from Sweden by 2050 and close to zero by 2100. WWF support a 90% reduction by
2050. This report tries to contribute to scoping Sweden’s climate change challenge through the analysis of
existing trends and a rigorous assessment of Sweden’s global contribution to climate change. Due to data
availability we will concentrate our analysis on the time series 1993 to 20034.
Message 1: Sweden has not succeeded in reducing CO2 emission from its own territory since the
start of the international climate change negotiations at the Earth Summit in Rio de Janeiro.
Message 2: While households and government have managed to reduce their direct emissions,
CO2 emissions from industrial sources keep rising.
2
This has been reduced to 0.8Mt by 2005 as shown in the most recent environmental account data. In this report we focus on 2003,
because of the better data situation of this year. This will allow us to establish a solid consumer emission account, which would be more
difficult for 2005.
3
This includes an adjustment for the higher climate change impacts of aviation fuels emitted in higher altitudes as recommended by the
IPCC. Without this adjustment the increase would be 6.3 Mt as shown in the Environmental accounts.
4
This report uses input-output tables to analyse the full consumer emission account for Sweden. The most recent year available is 2003;
therefore, our analysis is based on 2003 data.
182.2. Drivers of industrial CO2 emissions
Figure 7: Drivers behind increases in CO2 emissions 1993-2003
Sweden’s rise in CO2 emissions have been caused by a 6.8Mt increase in carbon output of domestic industries.
There are various technological, socio-economic and demographic driving forces which have influenced this
trend. For example, the total CO2 emissions of a company that produces in an environmentally friendly (eco-
efficient) and socially responsible way, might increase because of the increased demand for greener products.
At the same time, additional demand could just be caused over time through a rapidly increasing population. It
would, therefore, be far too simple just to blame industry for their lack of progress in combating climate
change. In order to get a more comprehensive picture, we distinguish 6 drivers behind emissions trends of
industries between 1993 and 2003:
• Carbon-efficiency: The contribution of changes in sectoral carbon intensity (tCO2/SEK sectoral output);
• Procurement: The contribution of changes in sectoral supply chains;
• Consumer choices: The contribution of changes in the average consumption basket;
• Exports: The contribution of changes in the contribution of exports to final consumption;
• Consumption levels: The contribution of changes in the levels of final consumption per capita;
• Population: The contribution of changes in Sweden’s total population.
Figure 7 shows that industrial sectors themselves have not done badly in combating climate change. Through
improvements in carbon efficiency (-4.3Mt) and decarbonising their domestic supply chains (-3.5Mt) a total of
7.8 Mt of carbon has been saved between 1993 and 2003. Also Swedish consumers saved 2Mt of carbon
through their choice of greener products. However, all these carbon savings were off-set through rising per
capita levels of consumption, which triggered an additional 15Mt of CO2 between 1993 and 2003. Sweden’s
consumer culture is, like many industrialised countries, growing in extent and affluence.
Therefore, we find evidence that Sweden’s progress in the climate change challenge is counter-acted by the
existence of an economy-wide growth effect: carbon savings through technological and organizational carbon
efficiency improvements, essentially reducing the relative price of a product, have been fully-offset by CO2
19emissions arising from increased consumption. The conclusion is clear: efficiency gains are not keeping in
pace with the rising demand for goods and services.
Moreover, Figure 7 also highlights that it would be too simple just to blame industries for Sweden’s slow
progress in reducing its territorial carbon emissions. Production and consumption are directly interlinked and
influenced by a variety of economic, social and demographic factors. The demand for products can influence
the volume and method of production.
Substantial progress on climate change will only be made if both are jointly considered. Climate change is a
challenge we all face together and we will only be successful in facing it if all stakeholders work together in
reducing emissions on the production and consumption side of the economy. Recent evidence in the UK has
highlighted that such mutual societal consensus is fundamental as encapsulated in the notion of “I will if you
will”, where all stakeholders must act together (as illustrated in figure 4). From a policy perspective Figure 7
could indicate that sustainable consumption might not only about consuming differently, but also about
consuming less. Therefore, there might be the need to revive the discussion about the relationship between
consumption and well-being. Enabling people to re-balance their work and private life, might well serve as an
adequate way of framing this discussion to mutual societal benefit.
Message 3: There is evidence for a growth effect in the Swedish economy. The reductions in CO2
emissions through advances in eco-efficiency have been off-set through additional consumption of
Swedish citizens.
Message 4: Swedish consumers have limited the increase in Sweden’s territorial emissions
through greener choices.
Message 5: It would be too simple just to blame industries for Sweden’s slow progress in reducing
its territorial carbon emissions. Climate change is a challenge we all face together and we will only
be successful in facing it, if all stakeholders work together on the production and consumption side
of the economy.
202.3. Sweden’s carbon footprint
Figure 8: Territorial emissions vs. carbon footprint
Sweden’s territorial carbon emissions are low compared to other countries. This is mainly driven by the low
carbon structure of its electricity production. Over 90% of Sweden’s domestic electricity is produced by
hydropower and nuclear power (however, approximately a third of Sweden’s energy supply depends on
imports, mainly imported oil (EC, 2007)). While we firmly believe that nuclear power should not be part of
the energy mix of a sustainable low carbon economy (see Box 4) and emphasise the importance of continuing
the phase out of existing nuclear plants, the 7.2 tons of CO2 per capita do still not represent the full climate
change impacts of Swedish citizens.
Box 4: On the use of nuclear power in a one planet economy
With the majority of its electricity generated from hydropower and nuclear power, Sweden’s energy sector has
a much lower carbon output than most other countries of the world. Even though there is no doubt that nuclear
power is a low carbon technology, it is questionable to what extend the other risks attached are reconcilable
with the principle of a one planet economy, which produces its goods and services along a sustainable path. In
this spotlight section we will discuss some of the important arguments with particular considerations of
climate change and discuss the importance for Sweden to continue its nuclear phase-out.
There is no doubt that nuclear energy has its merits in the context of climate change even though it is
sometimes falsely depictured as a carbon free technology. To produce 1 GWh of electricity 16.2 tons of CO2
are produced throughout the life cycle of nuclear power.5 This compares to 356 tons of CO2 for gas and 892
5
However, this figure still excludes the carbon emissions from the decommissioning of the plants as well as the wastes themselves,
which are not well known. Moreover, commentators have suggested that any move to low grade uranium ore could substantially increase
the carbon intensity of nuclear power even though it is currently difficult to predict when such a shift might be required. However, there are
some quasi carbon-free ways to produce electricity. The fossil fuel used over the life cycle of a wind turbine, for example, can be “repaid”
in less than 10 month, as turbines themselves generate zero carbon energy.
21tons for coal. An increasing reliance on nuclear can therefore have the potential to drastically reduce the
carbon output of the Swedish economy even though some renewables can do even better from this
perspective. However, there are other considerations, which need to be taken into account within the context
of climate change as well as within wider sustainability considerations.
Having nuclear as a central part of the energy mix causes difficulties in providing a level playing field for all
other technologies – particularly renewables. Electricity generation with heavy reliance on nuclear power
tends to lock economies into a central grid system. However, the in-efficiencies of such central solutions are
well-described in the literature. Secondly, experience from all over the world shows that nuclear energy tends
to receive very large subsidies for R&D, the building of the plants and the expensive decommissioning of the
wastes. These are not reflected in the price for electricity from nuclear sources, which commonly only reflects
the low operating costs of plants. This biases price formation and leads to an economically inefficient
outcome. Many renewables have difficulties to compete with these artificially low electricity prices. At the
same time economic incentives to increase energy efficiencies are weakened.
Within a larger sustainability context there are all unresolved issues associated with the decommissioning of
the plants and wastes as well as the possibility of nuclear accidents. With regard to the latter, there is no doubt
that the probability of a major nuclear accident is extremely low. However, the consequences would be
disastrous. The fact that there is no insurer in the world, which can insure a nuclear power plant strikingly
highlights the fact that reliance on nuclear power cannot be seen as responsible decision making.
Finally, there is another caveat of nuclear power associated with international climate change with regard to
concerns about proliferation of uranium. Even reactor grade nuclear fuel can be used by terrorist groups for
the production of ‘dirty bombs’, which can cause large losses in human life. Moreover, enrichment of reactor-
fuels can lead to the development of nuclear weapons. If Sweden argued that it could only sufficiently reduce
its carbon emissions with nuclear in the energy mix, every other country participating in the international
climate change process should have the same right. The UNFCCC explicitly encourages “the development,
application and diffusion, including transfer of technologies, practices and processes that control, reduce or
prevent anthropogenic emission of greenhouse gases”.
A number of difficulties in the relationship between civil and military applications continue to cause concern
among many commentators, including:
• the difficulties of enforcing international treaty obligations;
• proliferation risks associated with the widespread use of nuclear technologies in countries with very
diverse systems of governance;
• the capacity and resources available to enforce international obligations in a potentially growing number
of states with a nuclear capacity;
• how to deal with states that withdraw from treaties or develop nuclear capability outside of them.
Nuclear power is a choice rather than a necessity for a low carbon future of Sweden. There are more than
enough renewable energy resources in Sweden to provide a diverse, secure low carbon electricity supply, if
sufficient energy efficiency options are considered at the same time. To be a sustainable, low carbon society it
therefore seems crucial that Sweden continues on its path to phase-out nuclear power from the energy mix.
22In order to meet the demands of Swedish citizens, a lot of goods are imported into the country. The production
of these goods in other countries causes CO2 emissions outside Sweden, which should be added to Swedish
CO2 account. Territorial emission accounting, therefore, provides a potential mechanism to high consuming
countries to shift environmental pollution to distant land. If Sweden imports carbon-intensive products, these
are currently not included in its national emissions account. For local pollutants this may be viewed as a
rational option for consumers, but for global pollutants consumers will bear the costs regardless of where
production occurs. Consequently one would expect the optimal policy for global pollutants is to consider the
implications of international trade.
The carbon footprint is an alternative consumption based CO2 accounting measure, which fully accounts for
trade and is able to reflect the full climate change impacts associated with the way people in Sweden live. It
subtracts all CO2 emissions from exports from the territorial emissions account and adds import related CO2.
The carbon footprint of exports would be added to the emissions account of the country that consumes the
exported products. Figure 8 highlights that the global climate change impacts of Swedish citizens are 1.2t/cap
or 17% higher than suggested by the territorial emission account. Unless the territorial emission account is
adjusted for trade activities, Sweden’s contribution to climate change will be under-estimated.
Developing Sweden towards a low carbon society will require taking full responsibility for all CO2 related to
Sweden’s consumption. The government should therefore take measures to reduce Sweden’s entire carbon
footprint rather than its territorial emissions. This will need to involve increased efforts in reducing Sweden’s
climate change impacts abroad through exporting sustainable energy solutions, technology transfer (joint
implementation and clean development mechanism) as well as joint policies with other countries on a
supranational level such as the EU tradable permit scheme.
Equally the 2050 reduction target should be reviewed in light of the higher carbon footprint estimate. Then it
might well be that a 75-90 percent reduction of domestic carbon dioxide emissions is insufficient for a fair
contribution to global efforts of stabilising global carbon concentration in the atmosphere at levels which
avoid dangerous climate change.
Message 6: Unless Sweden’s carbon account is adjusted for trade activities, it will under-estimate
Sweden’s contribution to climate change. Sweden’s carbon footprint is 8.4 tons of CO2 per capita.
This is 17% higher than its territorial emissions.
Message 7: For global pollutants like CO2 or other greenhouse gases, consumers will bear the
costs of polluting regardless where it occurs. Consequently, one would expect for optimal policy
formation that climate change impacts from trade are fully taken into account.
232.4. The carbon footprint of Sweden’s imports
Figure 9: Sectoral monetary and CO2 trade balances for Sweden
Sweden’s carbon footprint is higher than its territorial CO2 emissions. This means that it has a negative CO2
or physical trade balance (PTB). Sweden is a net importer of CO2; importing almost 11 million tons of CO2
more than it exports. Interestingly, its monetary trade balance is positive; Sweden is a net exporter of goods
and services in terms of their value (see Figure 9). Such a pattern might be seen as a typical one for industrial
countries with high material consumption and high input levels of skilled labour in their own production
processes.
These balances of trade vary considerably on a sectoral level. “Transport, storage and communications”,
“Wholesale and retail trade”, “Manufacturing of cars, machinery, electrical equipment and furniture” and
“Manufacture of pulp and paper products” are the only sectors with a positive monetary and physical trade
balance. Hence, they export more of these products than they import, and are important to the economy in
terms of the profit they generate.
The “Electricity, gas and water supply” sector shows by far the highest CO2 trade deficit. In addition to this,
more than a third of Sweden’s energy supply depends on imports, mainly oil from Denmark, Norway and
Russia (EC, 2007). The government intends to have ended its dependence on oil by 2020. The Swedish
domestic energy sector provides low carbon electricity and so Sweden could reduce its carbon footprint if all
imports were produced with domestic technology (however, see box 4 for discussion on Sweden’s nuclear
power). If Sweden succeeds in improving its energy efficiency, saving energy, using renewable resources and
thus reducing its environmental burden, it can at the same time reduce its import of fossil fuels and become
more independent.
24On the other hand, while there is no doubt that the Swedish economy is more carbon efficient than most other
industrialised economies in the world, it is equally clear that the output of some Swedish sectors might be of
quite different type than the output of their counterparts abroad. Swedish sectors might to some extent just
engage in less carbon intensive activities. For example, the Swedish electronic industry might mainly focus on
research, science and technology, whereas more carbon intensive activities upstream, such as the manufacture
of the hardware itself, might not take place in Sweden anymore. Such patterns of specialisation are common in
an increasingly specialised global supply chain. A comparison of sectoral Swedish CO2 intensities might
mainly reflect these specialisation patterns rather than any particular carbon efficient management regime.
While recognising the global patterns of specialisation, which might leave the Swedish economy with less
material and carbon intensive production processes, there is no doubt that Sweden has one of the most carbon
efficient economies. The consumption of domestic products, therefore, is one way how Sweden could reduce
its carbon footprint. At the same time, we need to take into consideration the potential of trade to stimulate the
development of low carbon products in emerging economies.
Message 8: Sweden has a negative physical trade balance and a positive monetary trade balance. Whilst
more CO2 is embodied in Sweden’s imports than in its exports, the value of exported goods is higher than of
imported goods.
Message 9: Directing consumer and industry choices towards goods produced in Sweden could help to
reduce Sweden’s carbon footprint. At the same time, we need to recognise the potential of trade to stimulate
the development of low carbon products in emerging economies.
25Figure 10: Imports of CO2 (Mt) by country of origin
Figure 10 shows in which countries the CO2 emissions from the production of Swedish imports occur based
on a fully integrated multi-regional input-output model, which accounts for multi-lateral trade and represents
the production technologies in 87 different regions (which have been further aggregated above). The model
shows that 40% of the import related share of Sweden’s carbon footprint comes from production of imports in
the EU-15. The remaining EU-27 and Baltic States with 4.95 million tons and the U.S. with 3.24 million
tonnes of CO2 emissions also contribute substantially to the import share of Sweden’s carbon footprint. The
production of goods and services for Swedish consumption generates 3 Mt of CO2 in China and another 3.95
Mt in the rest of Asia. Given the increasing trade particularly with China and India there are reasons to believe
that the Swedish carbon footprint in these countries is on the rise, similar to what has been shown in a recent
Norwegian study (cf Reinvang & Peters 2008).
26Taking into consideration the emissions intensities attached to imported products (the CO2 emitted per unit
output); generally European products are less carbon intensive than those produced in China and similar
countries. So while the aggregated emissions are higher from Europe (as one would expect since Sweden is in
Europe), it is probably beneficial in terms of carbon footprint to trade more with Europe than China. However,
as the current increase in trade with China continues, it is important to improve technology in China compared
to European technology.
These results seem to suggest that international efforts to combat climate change including joint efforts to
develop carbon efficiency in China and India could also have a major influence in reducing Sweden’s carbon
footprint. Particularly, it seems to be in Sweden’s full interest to drive forward ambitious climate change
agreements on the European level and to take a leading role in driving forward the EU’s emission trading
scheme.
Sweden is an active member in the EU, and a leader in sustainable development and climate policies.
Swentec, Swedish Environmental Technology Council was started in 2005 by the Swedish Government to
have a business-policy assignment to strengthen Swedish companies’ business opportunities and
competitiveness within clean-tech, environmentally adapted goods, manufacturing processes and services in
both the national and international market.
Message 10a: Almost half of the import related share of Sweden’s carbon footprint comes from production
activities in the EU15. Ambitious and rigorous joint climate change policies and initiatives on the European
and international level are vital for reducing Sweden’s carbon footprint.
Message 10b: Emissions intensities are generally lower for European products than those produced in
China. In line with current trends of increasing trade with China, Sweden should look to improve Chinese
technology compared to European technology.
273. The carbon footprint of households
Emissions from Swedish consumers is the carbon dioxide emitted based on the domestic consumption of
goods and services, rather than production. By far, the single largest contributor to consumer CO2 emissions
is households, making up 76% of Swedish consumption. This includes the CO2 attached to imports used by
households. We have seen that increasing household spending in recent years has lead to significant increases
in CO2 emissions, and so changing household consumption patterns is central to achieving sustainable
development. Figure 11 shows the CO2 emissions from household consumption, highlighting the household
activities with the highest and lowest carbon impact.
CO2 emissions from residential energy demands include emissions from the direct demand for energy
(heating, electrical appliances and private transport) as well as emissions from the energy needed to
manufacture consumer goods and services - the household indirect energy demand. This means that in the
case of purchasing a car, the environmental impact is not caused in driving the car alone, but also through the
raw material extraction, manufacturing, distribution, use and disposal of the car (see Box 2). In Sweden, these
indirect emissions through consumption currently contribute to 64% of the total household emissions, with
direct consumption contributing to 36% household emissions.
28You can also read