General Commission for Sustainable Development - Key figures on climate France, Europe and Worldwide 2020 ...
←
→
Page content transcription
If your browser does not render page correctly, please read the page content below
D A
    Frequency
                    T               A
       L           A                B
General Commission for Sustainable Development

Key figures on climate
France, Europe and Worldwide
2020 EDITION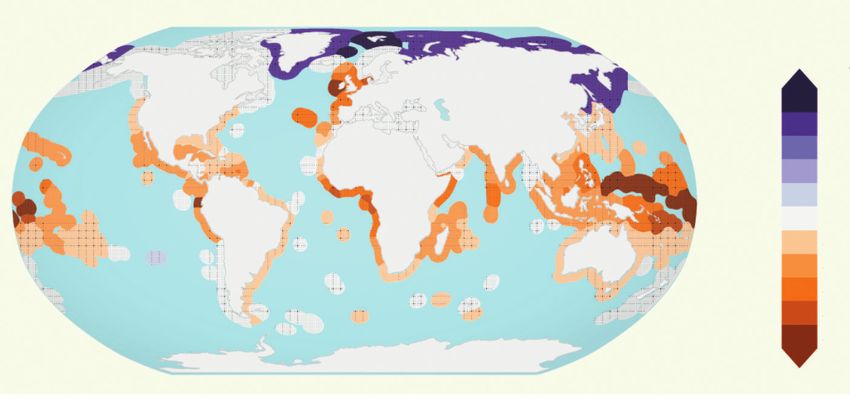
summary
                               Key figures on climate
                               France, Europe and Worldwide

     05 - What is climate change?
           This first section summarises the key scientific evidence on the indicators, causes
           and possible consequences of climate change.

     21 - How much greenhouse gas is emitted in the world?
           The emphasis here is on the most significant data covering global GHG emissions,
           in particular the distribution by country and large regions of the world.

     33 - How much greenhouse gas is emitted in Europe
           and in France?
           This section gives a comprehensive overview of GHG emission statistics in Europe and
           France, complemented by estimations of the carbon footprint of the French population.

     41 - How are GHG emissions distributed by sector
           in Europe and in France?
           This section includes details of the evolution of GHG emissions since 1990 for the
           following large sectors: energy, transport, industry, residential/commercial/
           institutional, agriculture and land use and waste management.

     53 - What climate policies are implemented at the global level,
           in Europe and in France?
           The different policies to combat climate change, implemented internationally,
           in Europe and in France, are outlined.

     76 - Key data

     77 - Annexes

Document edited by:
Data and Statistical
Studies Department (SDES)

                                                    Data may not always sum to the total due to rounding

 2 – Key figures on climate – France, Europe and Worldwide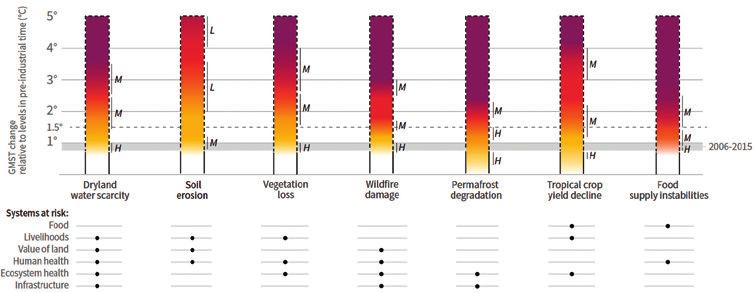
contributors

                            MB                                   AC
               Manuel Baude                       Aurore Colin
               SDES                               I4CE-Institute for
                                                  Climate Economics
               manuel.baude@
               developpement-durable.gouv.fr      aurore.colin@i4ce.org

                                JD                                 AF
               Jérôme Duvernoy                    Alexis Foussard
               Onerc                              SDES
               jerome.duvernoy@                   alexis.foussard@
               developpement-durable.gouv.fr      developpement-durable.gouv.fr

                               CV
               Charlotte Vailles
               I4CE-Institute for
               Climate Economics
               charlotte.vailles@i4ce.org

                   Key figures on climate – France, Europe and Worldwide – 3
foreword
n keeping with previous editions, the 2020 edition
I
of Key figures on climate has been prepared for
the 25th Conference of the Parties on Climate
Change (COP25) to be held in Madrid (Spain) from
the 2 to 13 December 2019, under the Presidency
of Chile.
This publication is unique in offering an exhaustive overview
of today’s climate issues: the reality of climate change and its
impacts, greenhouse gas emissions at global, European and
national levels as well as the sectoral distribution of these
emissions and their evolution, and an examination of the
climate policies enacted.
Several sets of data, presented in graph format in this document,
can also be downloaded from the SDES website.
— Sylvain Moreau
HEAD OF THE DATA AND STATISTICAL STUDIES DEPARTMENT (SDES)
4 – Key figures on climate – France, Europe and Worldwidepart 1
What is
climate
change?
— Many indicators, such as the rising temperatures
of the Earth’s surface and the rising mean sea level,
demonstrate a change in the climate over the last century.
A selection of observations of this change and its
consequences are presented here, firstly on a global
scale and then for France.
The conclusions of the scientific community, synthesised
in particular by the IPCC (see glossary), now concur as
to the role of human activities in this change:
the perturbation in the climate balance is primarily due
to anthropogenic emissions of greenhouse gases
(see glossary).
This section also presents projections of the consequences
of climate change, based on different assumptions
of future GHG emissions trajectories.
Key figures on climate – France, Europe and Worldwide – 5part 1: what is climate change?
Climate change observations
EVOLUTION OF GLOBAL ANNUAL MEAN TEMPERATURE FROM 1850 TO 2018
In °C
Temperature anomalies (reference 1850-1900)
1.40
1.20
1.00
0.80
0.60
0.40
0.20
0.00
- 0.20
- 0.40
1850 1860 1870 1880 1890 1900 1910 1920 1930 1940 1950 1960 1970 1980 1990 2000 2010 2018
GISS-NASA NOAA Hadley Center Running average over 11 years
Note: the shaded area represents the 1850-1900 pre-industrial period.
Sources: NASA; NOAA; Hadley Center
The increase in the global mean temperature of land surface air and sea
surface water is very clear. It remained relatively stable relative to the 1850-
1900 pre-industrial reference period up until 1940, then the increase
followed a slight upward trend until around 1980, when warming
accelerated and decade averages have continued to increase since the
1980s. The decade 2001-2010 was 0.21°C warmer than the decade 1991-
2000, and was 0.79°C above the 1850-1900 mean. The year 2016, with
temperatures that were 1.1°C higher than in the pre-industrial period, ranks
first among the hottest years since 1850. Even though 2018 was slightly
cooler than 2016 and 2017, the last five years (2014 to 2018) were the five
hottest years ever recorded.
6 – Key figures on climate – France, Europe and Worldwidepart 1: what is climate change?
EVOLUTION OF GLOBAL MEAN SEA LEVELS SINCE 1993
In cm
10
8
6
4
2
0
y = 0.355x - 669.25
-2
1993 1998 2003 2008 2013 2018
Note: date of last measurement: 18 March 2019 (+ 3.36 mm/year, reference GMSL, postglacial rebound
correction).
Sources: CNES; LEGOS; CLS
The mean sea level has risen by 1.7 ± 0.3 mm/year over the 1901-2010
period. The rate of sea level rise has accelerated over the last decades to
reach 3.4 ± 0.4 mm/year over the 1993-2018 period (satellite measurements).
MASS BALANCE OF POLAR ICE SHEETS FROM 1992 TO 2016
In Gt
1 000
0
- 1 000
- 2 000
- 3 000
- 4 000
- 5 000
1990 1995 2000 2005 2010 2015 2020
Greenland Antarctica West Antarctica East Antarctica Antarctic Peninsula
Note: Mass balance of polar ice sheets from 1992 to 2016 (from Bamber et al., 2018; The IMBIE Team, 2018).
Source: IPCC, SROCC 2019
The polar regions are losing ice and this loss has intensified since around
2006. Between 2006 and 2015, the mass of the Greenland ice sheet
reduced by 278 ± 11 gigatonnes per year (Gt/year) and the Antarctic ice
sheet by 155 ± 19 Gt/year. These losses contribute to sea level rise by 0.77
± 0.03 and 0.43 ± 0.05 mm/year respectively.
Key figures on climate – France, Europe and Worldwide – 7part 1: what is climate change?
EVOLUTION OF THE MEAN ANNUAL TEMPERATURE IN METROPOLITAN FRANCE
SINCE 1900
In °C
2.5
2.0
1.5
1.0
0.5
0.0
- 0.5
- 1.0
- 1.5
1900 1910 1920 1930 1940 1950 1960 1970 1980 1990 2000 2010 2018
Note: the evolution of the mean annual temperature is represented in the form of the difference between
it and the mean observed over the 1961-1990 period (11.8°C).
Scope: Metropolitan France.
Source: Météo-France
In metropolitan France, as worldwide, the evolution of mean annual
temperatures shows net warming since 1900. This warming has taken
place at a variable rate, with a particularly marked rise since the 1980s. In
2018, the mean annual temperature of 13.9°C was above average
(reference 1961-1990) by 2.1°C, making this year one of the hottest
observed in metropolitan France.
8 – Key figures on climate – France, Europe and Worldwidepart 1: what is climate change?
EVOLUTION OF THE GRAPE HARVEST DATE (TEN-YEAR AVERAGES) FOR A SAMPLE
GROUP OF FRENCH VINEYARDS BETWEEN 1901 AND 2018
22-Oct
1-Oct
10-Sept
20-Aug
1900 1910 1920 1930 1940 1950 1960 1970 1980 1990 2000 2010 2018
Tavel Châteauneuf-du-Pape Saint-Émilion
Champagne Alsace
Sources: Inter-Rhône; ENITA Bordeaux; INRA Colmar; Comité interprofessionnel du vin de Champagne.
Data processing: Onerc
The advancement of grape harvest dates is mainly correlated with the
evolution of the temperature (sum of temperatures above 10°C), in a quasi-
linear manner. A trend resulting in earlier harvest dates is thus an effective
marker of global warming and its impacts on vegetation.
Key figures on climate – France, Europe and Worldwide – 9part 1: what is climate change?
POPULATION EXPOSED TO AT LEAST ONE SUMMER HEATWAVE IN FRANCE
In millions of inhabitants
60
50
40
30
20
10
0
74
76
78
80
82
84
86
88
90
92
94
96
98
00
02
04
06
08
10
12
14
16
18
19
19
19
19
19
19
19
19
19
19
19
19
19
20
20
20
20
20
20
20
20
20
20
Scope: Metropolitan France.
Sources: Météo-France; Insee. Data processing: Santé Publique France
At national level, an increase in the number of heatwaves (see glossary)
has been observed over the past decades, with, in particular, a doubling
between the periods 1974-1983 and 2004-2013. Between the censuses
of 1975 and 2013, the population rose by 14.3 million and the percentage
of those over 75 years old has progressed from 5% (2.7 million people) to
9% (almost 6 million people). The population exposed to heat and its
vulnerability linked to age has thus risen independently of the number of
heatwaves.
Thus, both the number of heatwaves and the population exposed have
doubled between 1974-1983 and 2004-2013 for the whole of France.
10 – Key figures on climate – France, Europe and Worldwidepart 1: what is climate change?
Causes of climate change
THE NATURAL GREENHOUSE EFFECT AND ITS PERTURBATIONS BY HUMAN
ACTIVITIES
Current energy fluxes in W/m2
Incoming
solar
340
100
76
solar reflected
239
thermal outgoing
Solar absorbed
atmosphere
79
Greenhouse
Aerosols Clouds Ozone gas / large
aerosols
185 Thermal down
24 Evaporation surface
84 Emissions of gas
342 and aerosols
398
Snow/ice cover
161 Thermal up
20 surface
Solar absorbed
surface Sensible
heat Vegetation
Change in surface
Ocean colour albedo change
Net absorption 0.6
Note: the Earth constantly receives energy from the sun. The share of this energy that is not reflected by
the atmosphere, notably by clouds, or the earth’s surface (oceans and continents) is absorbed by the earth’s
surface, which heats up in the process. In return, the surfaces and the atmosphere emit infrared radiation,
which is more intense when the surfaces are hot. Part of this radiation is absorbed by some gases and by
the clouds then re-emitted back to the surface, which contributes to heating it. This phenomenon is known
as the greenhouse effect.
Sources: Météo-France; IPCC, Working Group I, 2013
The growth in the atmospheric concentration of GHG due to anthropogenic
emissions (see glossary) increases the radiation of energy towards the ground,
leading to an imbalance in the Earth’s radiative balance and causing a rise in
the Earth’s surface temperature. The change, relative to a reference year, in
radiation due to a climatic factor is known as radiative forcing. A positive
radiative forcing value indicates a contribution to global warming. In 2013, the
total radiative forcing of anthropogenic origin was + 2.55 (± 1.1) W/m² relative
to 1750.
Key figures on climate – France, Europe and Worldwide – 11part 1: what is climate change?
GREENHOUSE GAS (GHG)
Excluding water vapour, GHGs make up less than 0.1% of the atmospheric
volume. Water vapour, which fluctuates between 0.4% and 4%, is the main
greenhouse gas. Human activities have little direct impact on the
fluctuations in its concentration, but they have a strong impact on the
concentrations of other GHGs.
CO2 CH4 N2O HFC PFC SF6 NF3
2017 atmospheric 406 ppm 1 848 ppb 330 ppb > 198 ppt > 88.9 ppt > 9.2 ppt 1.6 ppt
concentration (in
2005 in brackets) (379 ppm) (1 774 ppb) (319 ppb) (> 49 ppt) (> 4.1 ppt) (5.6 ppt) (> 0 ppt)
< 1 to < 1 to
Global warming 12 400 11 100
potential (total 1 28-30 265 depending depending 23 500 16 100
over 100 years) on the on the
gases gases
Fossil fuel Waste,
Agriculture,
combustion, agriculture,
Source of industrial Manufacture
industrial livestock Sprays, refrigeration, industrial
anthropogenic processes, of electronic
emissions processes and processes
fertiliser components
and tropical industrial
use
deforestation processes
Change in
radiative forcing
in 2017 since
1750 through + 2.01 + 0.51 + 0.20 + 0.12
anthropogenic
emissions (+ 1.66) (+ 0.48) (+ 0.16) (+ 0.09)
(W/m 2)
(in 2005
in brackets)
ppm: parts per million; ppb: parts per billion; ppt: parts per trillion.
Sources: IPCC, Working Group I, 2013; NOAA, 2019; Agage, 2019
The global warming potential (GWP - see glossary) is the ratio of the
energy reflected back to earth over 100 years by 1kg of a gas relative to that
of 1kg of CO2. It depends on the radiative properties and lifetime of the gases
in the atmosphere. For example, 1kg of methane (CH4) will warm the
atmosphere as much as 28 to 30 kg of CO2 over the century following their
emission.
Although CO2 is the gas with the smallest global warming potential, it
is the one that has made the greatest contribution to global warming since
1750 because of the large quantities emitted.
12 – Key figures on climate – France, Europe and Worldwidepart 1: what is climate change?
GHG RESERVOIRS AND FLUXES: EXAMPLE OF CO2 DURING YEARS 2008-2017
Flux in Gt CO2e/year
Stocks in Gt CO2e/year
[2 160 + 880]
phere
Atmos e Volcan
ism
Chang use
fuel in landrrestrial < 0.4
Fossil ion and te tration
st
combu stry sequ es
and indu34.4 6.2
2.6 6.2
8.8
Ocean e
Biospher 000 - 110]
0
[142 00 [13 000 -
17
+ 568]
rves
fuel rese of
Fossil 100 - 1 340]
7
[3 700 -
n which: 0 - 4 200]
entatio 40
Gas [1 - 1 000]
Sedim 7
0. Oil [600 0 - 2 000]
60
Coal [1
Note: this graph presents: (i) in square brackets, the size of reservoirs in pre-industrial times
in billions of tonnes of CO2 in black and their variation over the 1750-2011 period in red;
(ii) in the form of arrows, the carbon fluxes between the reservoirs in billions of tonnes
of CO2 equivalent per year (see glossary). The pre-industrial fluxes are in black. Those linked
to anthropogenic activities between 2008 and 2017 are in red.
Sources: from IPCC, Working Group I, 2013 and The Global Carbon Project, Global Carbon Budget, 2018
Four large reservoirs can store carbon in different forms:
• atmosphere: gaseous CO2;
• biosphere: organic matter from living organisms including forests;
• ocean: limestone, dissolved CO2; marine fauna and flora (plankton);
• subsoil: rocks, sediments, fossil fuels.
Carbon fluxes between these reservoirs constitute the natural carbon
cycle, that has been disrupted by anthropogenic emissions of CO2 that
modify the fluxes exchanged or create new ones such as the combustion
of the organic fossil carbon reserves.
Key figures on climate – France, Europe and Worldwide – 13part 1: what is climate change?
IMBALANCE BETWEEN EMISSIONS AND CO2 STORAGE CAPACITY
Net annual fluxes of CO2to the atmosphere by source and reservoir
over the 2008-2017 period
In Gt CO2/year
35
30
Uncertainty
25
20
15
10
5 Land Ocean
uptake uptake
- 11.7 - 8.8
0
Fossil fuels land-use Growth rate in
combustion change atmospheric CO2
-5 and industry 5.5 concentration
34.4 17.2
- 10
- 15
- 20
Note: the uncertainty in the atmospheric CO2 growth rate is very small (± 0.07 GtCO2 /yr)
and is neglected for the figure.
Source: The Global Carbon Project, Global Carbon Budget, 2018
Over the last ten years, of the 39.9 Gt of CO2 released on average per year
by human activities, the atmosphere absorbed 17.2, land uptake (biosphere
and soils) 11.7 and ocean uptake 8.8. The atmosphere is the reservoir that
is most affected by anthropogenic activities: it absorbed almost 45% of
the carbon emitted over the last fifty years.
14 – Key figures on climate – France, Europe and Worldwidepart 1: what is climate change?
GLOBAL ROLE OF FOREST DYNAMICS
On a global scale, forests are net carbon sinks. The gross sink attributed to
the biosphere - meaning mainly forests, which constitute 80% of above ground
biomass and 50% of terrestrial photosynthesis (Dixon et al., 1994; Beer et al.,
2010) - offsets 19% of annual anthropogenic GHG emissions, or approximately
10 Gt CO2e (IPCC 2013, Canadell et al., 2007).
Deforestation results in GHG emissions through the combustion and
decomposition of organic matter. These gross emissions represent
approximately 12% of annual anthropogenic GHG sources in the world (IPCC
2014).
In France, the net sequestration of carbon in the biomass of forests is
estimated at approximately 53 Mt CO2e for the year 2017, or approximately
15% of national CO2 emissions, excluding land use, land-use change and
forestry (LULUCF - see glossary) - (Citepa, 2019).
ATMOSPHERIC CO2 CONCENTRATION
In parts per million (ppm)
460
440
450 ppm = mean level that must not be
420 exceeded by 2100 to limit warming to 2°C
400
380
360
340
320
300
1984 1988 1992 1996 2000 2004 2008 2012 2017
Source: CMDGS under the aegis of WMO, 2018
Since the development of industrial activities, land and ocean uptake has
absorbed half of the anthropogenic emissions. The remaining emissions
persist in the atmosphere, resulting in an increase in GHG concentrations.
Key figures on climate – France, Europe and Worldwide – 15part 1: what is climate change?
Climate scenarios and projections
PROJECTIONS OF FOSSIL FUEL EMISSIONS ACCORDING TO
FOUR GHG EVOLUTION PROFILES (THE IPCC’s RCPs)
In GtC
30
Historical
25
RCP2.6 pathway
RCP4.5 pathway
20 RCP6.0 pathway
RCP8.5 pathway
15
10
5
0
-5
1850 1900 1950 2000 2050 2100
Source: IPCC, Working Group I, 2013
The IPCC published its first report (First Assessment Report) in 1990. Its fifth
report (AR5) was released in its entirety at the end of 2014. In each publication,
the IPCC produces climatic projections based on GHG concentration
assumptions.
For the AR5, four GHG concentration profiles (RCP, for Representative
Concentration Pathways) were defined: RCP2.6; RCP4.5; RCP6.0; RCP8.5,
from the most optimistic to the most pessimistic, named after the radiative
forcing value induced by 2100 (for RCP8.5, the radiative forcing amounts
to 8.5 W/m²).
The scientific community has recently developed a fifth more optimistic
pathway: RCP1.9. It was defined in the context of a special IPCC report
published in 2018 on the consequences of a global warming of 1.5°C, and
as part of the process of developing a sixth assessment report (AR6),
scheduled for 2021 and 2022.
16 – Key figures on climate – France, Europe and Worldwidepart 1: what is climate change?
EVOLUTION OF TEMPERATURES AND SEA LEVELS
IN THE DIFFERENT IPCC SCENARIOS
Projection of the variation in mean global temperature according to different scenarios
In °C
6.0
Mean 2081-2100
Historical
RCP2.6 pathway
4.0
RCP4.5 pathway
RCP6.0 pathway
2.0 RCP8.5 pathway
0
- 2.0
1950 2000 2050 2100
Note: temperature variation relative to the period 1986-2005.
Source: IPCC, Working Group I, 2013
Projection of the global mean sea level rise relative to the 1986-2005 period
In metres
1.2
RCP2.6 RCP4.5 RCP8.5
1.0
0.8
0.6
SROCC
AR5
0.4
SROCC
AR5
0.2
SROCC
AR5
0.0
2000 2025 2050 2075 2100 2000 2025 2050 2075 2100 2000 2025 2050 2075 2100
Source: IPCC, SROCC, 2019
The main factors of sea level rise (see p. 7) are the thermal expansion of the
oceans and the melting of terrestrial ice reservoirs (glaciers, polar caps, etc.).
By 2100, the mean sea and ocean levels relative to 1986-2005 are likely to rise
by an average of 43cm (likely range of 29 - 59 cm) in the RCP2.6 scenario, and
by 84 cm (likely range 61 - 110cm) in the RCP8.5 scenario. The rise in sea levels
will probably result in large population migrations, since more than one billion
people live on low costal areas (less than 10 metres above sea level).
Key figures on climate – France, Europe and Worldwide – 17part 1: what is climate change?
CARBON BUDGETS AND RISING TEMPERATURES
A carbon budget expresses the maximum level of CO2 emissions for which
there is a reasonable probability of avoiding a mean temperature rise above
a certain level. Only the most ambitious RCPs - RCP2.6 and 1.9 - provide a
probability above 50% of limiting the temperature rise to 2°C and 1.5°C
respectively by 2100. The business-as-usual scenario, RCP8.5, has a
probability of over 50% of resulting in a rise exceeding 4°C.
The remaining carbon budgets after 2018 allowing the mean temperature rise to be
limited to 2°C and 1.5°C
Remaining
In % 1.5°C carbon budget
from 2018 onwards
Remaining
2°C carbon
16
budget
from 2018
34
onwards
Cumulative
CO2
66 Cumulative emissions
CO2 emissions between
between 1870 84 1870 and
and 2017 2017
Note: the amounts are expressed as a percentage of the total carbon budget since the pre-industrial era,
obtained by adding the cumulative emissions between 1870 and 2017 to the remaining carbon budgets from
2018 onwards. The carbon budgets are given with a 66% probability of meeting the associated climate target.
The degree of uncertainty concerning the carbon budgets is high, ranging from - 670 to + 920 Gt CO2. This
is mainly due to uncertainties concerning the evolution and impact of greenhouse gases other than CO2,
the responses of the climate system to the increase in cumulative emissions and in radiative forcing and the
responses of the Earth’s system to the rise in temperatures.
Sources: I4CE, from the Global Carbon Project, 2018; IPCC, Special report 1.5°C, 2018
To achieve a probability over 66% of limiting the mean temperature rise
to 2°C relative to the pre-industrial era, the remaining carbon budget from
2018 onwards is 1170 Gt CO2 and only 420 Gt CO2 to limit the rise to 1.5°C.
If CO2 emissions continue at the same rate, the remaining carbon
budget, to achieve a 66% probability of limiting the temperature rise to 2°C,
will be spent before 2050, and within the next ten years to limit the rise to
1.5°C.
18 – Key figures on climate – France, Europe and Worldwidepart 1: what is climate change?
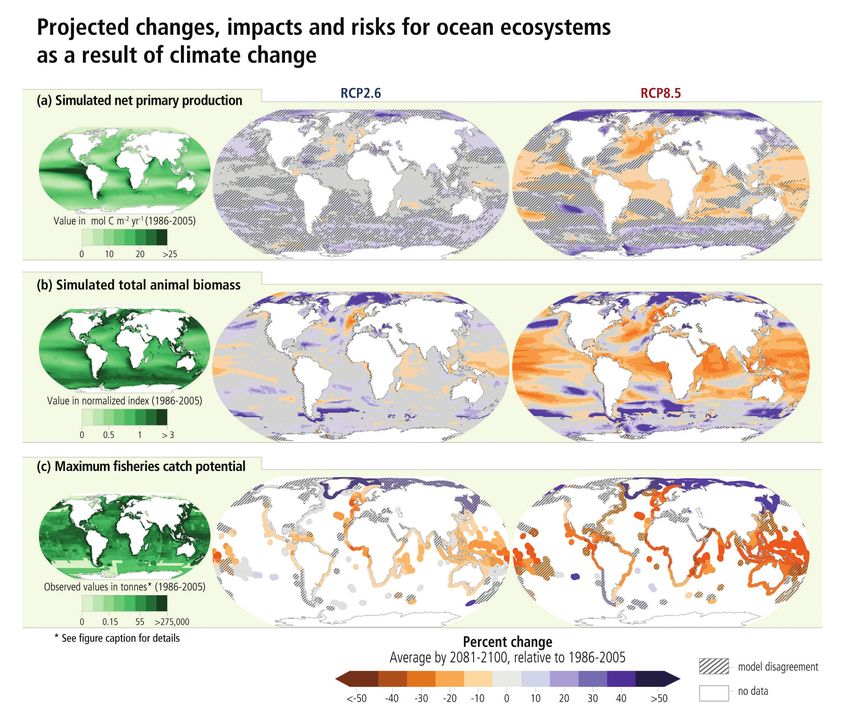
CONSEQUENCES ON A GLOBAL SCALE
Change to the maximum fisheries catch potential (scenario RCP8.5)
by 2081-2100, in comparison to 1986-2015
In %
50
40
30
20
10
0
- 10
- 20
- 30
- 40
- 50
Source: IPCC, SROCC, 2019
Catches and their composition in many regions are already subject to the
effects of warming and the evolution of primary production on the growth,
reproduction and survival of fish stocks.
Impacts of the temperature rise on natural and human terrestrial systems
Increase in global mean temperatures relative to pre-industrial levels
In °C
5 Very high
4
High
3
2
1.5 Moderate
1
Undetectable
Dryland Soil Vegetation Wildfire Permafrost Tropical crop Food supply Legend
water scarcity erosion loss damage degradation yield decline instabilities
Systems affected:
Food systems
Livelihoods
Value of land
Human health
Ecosystem health
Infrastructures
Source: IPCC, SRCCL, 2019
Key figures on climate – France, Europe and Worldwide – 19part 1: what is climate change?
DECREASE
CYCLONES IN SNOW COVER
SUBMERSIONS
HEAT FLOODS
ISLANDS
RISING FOREST
CONSEQUENCES FIRES
FOR FRANCE
WATER LEVELS
°C
Map of impacts observed or to come by 2050 3.0
2.5
1.0 1.5 2.0
Dunkirk
DECREASE
Lille CYCLONES IN SNOW COVER
SUBMERSIONS MARTINIQUE
HEAT FLOODS
FOREST
Le Havre
RISING
ISLANDS
FIRES DECREASE
WATER LEVELS
Reims Metz °C CYCLONES IN SNOW COVER
SUBMERSIONS
Paris HEAT FLOODS 2.5 3.0
ISLANDS 1.0 1.5 2.0
FOREST RISING Nancy
DECREASE
FIRES WATER LEVELS
IN SNOW COVER
Brest Rennes
SUBMERSIONS
CYCLONES
SEINE Strasbourg
SUBMERSIONS
°C CYCLONES
HEAT FLOODS OrléansDunkirk HEAT
VOSGES FLOODS 2.5 3.0
FOREST RISING
ISLANDS
ISLANDS 1.0 1.5 2.0 GUYANA
FIRES WATER LEVELS
FOREST RISING
Nantes FIRES°C WATER LEVELS Mulhouse
Angers Tours 2.5 3.0
Lille Dijon °C
1.5 2.0 Dunkirk Besançon SUBMERSIONS
1.0
HEAT MARTINIQUE
FLOODS 2.0 2.5
3.0
LOIRE
JURA ISLANDS 1.0 1.5
Le Havre FOREST RISING
Dunkirk FIRES WATER LEVELS
DECREASE
IN SNOW COVER Reims Lille
CYCLONES Metz
Dunkirk
SUBMERSIONS Lyon MART
Lille Clermont
UE
FLOODS
HEAT
Paris REUNION
HEAT FLOODS1.5
1.0
RISING
ISLANDS
LeFerrand
Havre MARTINIQUE ISLANDS
MARTINIQ
ALPES
FOREST
Nancy RISING
ATER LEVELS
°C Limoges Lille
ER
GUYANA
Le Havre FIRES WATER LEVELS
Rennes Reims Strasbourg
DECREASE
Brest
IN SNOW COV
SEINE
RE UN IO N
2.5 3.0
Metz
Dunkirk
PE
1.0 1.5 2.0 Reims MetzOrléans Grenoble
LeParis
Havre VOSGES
GUADELOU
DECREASE HEAT
Paris
IN SNOW Bordeaux
COVER GUYANA
CYCLONES
Nancy RISING ISLANDS
SUBMERSIONS
Dunkirk Nantes Nancy RHÔNE Mulhouse
FOREST Lille
FLOODS Rennes Reims
FIRES Strasbourg
Metz
Brest SEINE Dijon
SEINE WATER LEVELS
°C
Rennes
°C Angers Tours Strasbourg
Orléans Besançon
Paris Dunkirk
3.0
CYCLONES
3.0
Lille °C
Orléans
GARONNE VOSGES VOSGES
Le Havre
JURA
LOIRE GUYANA GUY
rg
Nice Nancy
3.0 MulhouseNîmes
MARTINIQUE Mulhouse
2.5
Nantes 2.52.0 2.5
Nantes Toulouse
Mulhouse
Strasbou
e Havre 1.0 1.5
BrestDijon Rennes SEINE GUADELOUPE
Reims Strasbourg
Lille MeI
Angers Tours
Angers Dijon FOREST
PYRENEES Besançon
Tours Toulon
Orléans
RISING
2.0 BesançonFIRES
2.0
Reims JURA MarseilleLyon Paris VOSGES Dunkirk
WATER LEVELS
Besançon
DECREASE Montpellier Clermont
IONS
LOIRE
Metz JURA
Le Havre REUNION
Ferrand LOIRE
Nice
IN SNOW COVER
Metz
CYCLONES
Paris Mulhouse Nanc
1.5
1.5 ALPES
Nancy
Nantes
SUBMERS
Limoges Rennes Dijon
Toulon
ille
Nancy Lyon Brest Angers Tours SEINE Reims L
Clermont
VOSGES
1.0
1.0 Strasbourg REUNION Orléans Besançon
ALPES
SEINE Ferrand
°C MARTINIQUE ALPES Grenoble Lyon
Clermont JURA VOSGES
Orléans Limoges LOIRE Paris REU
Grenoble
VOSGES
JURA
Bordeaux Ferrand
2.0 2.5
3.0 GUYANA
Nantes ALPES Le Havre
Mulhouse Grenoble Limoges
Dijon
Reims RHÔNE Rennes Dijon
Lyon
Metz Dijon Brest Angers Tours SEINE
FLOODS
Bordeaux
Marseille
ours Bes
Besançon Grenoble Lyon Orléans
Reims
JURA RHÔNE Clermont JURA
LOIRE
Nancy GARONNE Ferrand LOIRE Paris
Bordeaux
Lille
ALPES
RH ÔN E
NE Strasbourg Limoges
NîmesNantes Nice
Toulouse
Dunkirk
GARONNE
Le Havre Di
Ferrandnt
RHÔNE
Nîmes
SE INE
Nîmes Nice AngersRennes GUADELOUPE
VOSGES Lyon Brest SE
Clermo
Clermont Toulouse Tours
Toulon Grenoble Lyon
ISLANDS
MARTINIQUE GUYANA
PYRENEES REUNION GUADELOUPE Clermont
Ferrand
HEAT
Mulhouse ALPES Toulon Marseille Orléans
PYRENEES Montpellier
GARONNE Bordeaux FerrandLOIRE
Orléans
Limoges
Paris
Dijon Montpellier Marseille ALPES
Nîmes Limoges Nice
LO IRE
Besançon Toulouse RHÔNE
r
z Grenoble Nantesfor a GUADEL
Montpellie
JURANote: the map background is the product of simulations by “Drias, les futurs du climat” RCP 8.5 scenario.
ELS
ux PYRENEES AngersToulon
Tours Grenoble L
The temperatures correspond to the difference between the simulated temperatures by 2050 and the
Limoges
Brest
Marseille Rennes Clermont
WATER LEV
RISING
Le Havre
y RHÔNE Montpellier
GARONNE Bordeaux
Toulouse
reference period 1976-2005. The data for Mayotte were not available at the date of publication. Ferrand Nice
LOIRE O
Strasbourg
mont
Lyon
Toulouse Nîmes
and
NE
Source: Drias, les futursREUNION
du climat, 2019 LimogesRHÔNE
ALPES Nice
GUYANA
Nîmes PYRENEES Nantes Toulon
Tours
Toulouse
Mulhouse GUADELOUPE
Montpellier Marseille
GARONNE Angers Tours Cler
FOREST
S Grenoble Toulon Bordeaux
FIRES
Ferr
Bordeaux
ançon Montpellier Marseille
Toulouse Nîmes
GA RO NN E
Limoges RHÔNE
PYRENEES
Angers
RHÔNE
20 – Key figures on climate – France, Europe and Worldwide PYRENEES To
Montpellier Marseille
ennes
GARONNE
Nice
REUNION Bordeaux
Nîmes Nîmes
es
GUADELOUPE Toulousepart 2 How much greenhouse gas is emitted in the world? — In 2017, GHG emissions linked to human activities (with LULUCF) totalled the equivalent of 53.5 billions of tonnes of CO2 (GtCO2e). CO2 alone made up three quarters of these emissions, with one quarter for the other GHGs. In 2017, these global CO2 emissions rose by 1.2%. They increased by over 60% between 1990 and 2017, with contrasting trends in different countries. 29% of these emissions came from China, 14% from the United States and 10% from the European Union. As a global mean, emissions expressed in terms of population equal five tonnes of CO2 per year and per capita, which is an additional 15% relative to 1990.
part 2: how much greenhouse gas is emitted in the world?

Overview
of global GHG emissions
DISTRIBUTION OF GLOBAL GHG EMISSIONS (WITH LULUCF)
BY GAS IN 2010
In %
     In terms of global warming potential In terms of global warming potential
                  at 20 years                         at 100 years
                            Fluorinated gas                                     Fluorinated gas
                N2O         PFC + HFC + SF6                         N2O         PFC + HFC + SF6
                  4         2                                         5         2

                                                                  CH4
                                                                  20
            CH4
            42                      CO2
                                    52
                                                                                    CO2
                                                                                    73

                      CO2: carbon dioxide     CH4: methane        N2O: nitrous oxide
       Fluorinated gases (HFC: hydrofluorocarbons; PFC: perfluorocarbons; SF6: sulphur hexafluoride)

Source: IPCC, Working Group III, 2014

The global warming potential (GWP) of a gas depends on the period over
which it is calculated (see p. 12). Thus, the GWP of methane is between 28
and 30 when calculated over 100 years, and 84 when calculated over
20 years. The GHG inventories are usually expressed with a GWP at
100 years. This metric gives more weight to persistent gases than to those
with a short lifetime, whereas the GWP at 20 years demonstrates the
importance of methane emissions on this timescale.
     Global greenhouse gas emissions have doubled since 1970 and have
risen by over 40% since 1990 to reach 53.5 Gt CO2e in 2017 (UN Environment
– Emissions Gap Reports; data includes GHG emissions linked to land-use
change).

  22 – Key figures on climate – France, Europe and Worldwide
part 2: how much greenhouse gas is emitted in the world?
REGIONAL GHG EMISSIONS PER CAPITA IN 2012
In t CO2e/capita
25
North America 13.9%
20
Japan, South Korea, Australia and New Zealand 5.7%
Europe and ex-USSR excluding EU 8.2%
15
Central and South America 10.9%
10 Middle East 4.6%
Others Asia and Oceania 6.9%
5 China 24.3% EU-28
8.9% India 5.7%
Africa 10.8%
0
0 1 2 3 4 5 6
Population aggregate (in billions)
In 2012, mean emissions per capita in North America were more than eight
times higher than in India. However, these values do not reflect the disparities
that may exist within a region (for example, in the Middle East, the emissions
per head were over 50 t CO2e/cap in Qatar and less than 2 t CO2e/cap in
Yemen), or even within the same country.
REGIONAL GHG EMISSIONS PER UNIT OF GDP IN 2012
In kg CO2e/US $ 2005 PPP
1.4
Africa 10.8%
1.2
Europe and ex-USSR excluding EU 8.2% Japan, South Korea,
1.0 Australia and New Zealand
Central and South America 10.9%
0.8 Others Asia and Oceania 6.9% 5.7%
0.6 India 5.7% Middle East 4.6%
0.4 China 24.3%
North Am.
0.2
13.9% EU-28 8.9%
0
0 10 000 20 000 30 000 40 000 50 000 60 000 70 000 80 000 90 000
Aggregate GDP (in billions USD 2005 PPP)
Note: the graphs below include emissions from the LULUCF sector. The percentages indicate the share of
emissions from one region relative to the global total.
Sources for graphs: I4CE from JRC EDGAR and World Bank, 2015
In 2012, GDP carbon intensity was four times higher in Africa than in the
EU, meaning four times as much GHG were emitted there per unit of wealth
produced.
Key figures on climate – France, Europe and Worldwide – 23part 2: how much greenhouse gas is emitted in the world?
Global CO2 emissions
without LULUCF
GLOBAL CO2 EMISSIONS BY FUEL
In Gt CO2
50
45
40
35
30
25
20
15
10
5
0
1970 1975 1980 1985 1990 1995 2000 2005 2010 2017
Coal combustion Oil combustion Natural gas combustion Others
Note: the emissions recorded here are linked to fossil fuel combustion and industrial processes. This
corresponds to total CO2 emissions without LULUCF (see glossary). They account for almost 85% of global
CO2 emissions, which is approximately 65% of total GHG emissions.
Sources: SDES, from EDGAR, 2018; IEA, 2019
In 2017, CO2 emissions without LULUCF reached 37.1 billion tonnes, which
is 2.4 times the level in 1970. Over 39% of these emissions were due to coal
combustion, compared to 31% for oil and 18% for natural gas. The remaining
12% was from industrial processes such as cement manufacture (excluding
energy combustion).
24 – Key figures on climate – France, Europe and Worldwidepart 2: how much greenhouse gas is emitted in the world?
GLOBAL PRIMARY ENERGY MIX
In %
1971 (5 645 Mtoe) 2016 (13 762 Mtoe)
Renewable energies Nuclear 1 Nuclear
and waste Renewable energies
and waste
5
13 Oil Oil
14
45 33
Natural
Gas
16 Natural
Gas
22
Coal Coal
25 27
Source: IEA, 2019
The distribution of emissions should be compared to the global primary
energy mix, which was still dominated by fossil fuels in 2016 (oil, coal and
natural gas: 81% of the total). Oil is still the largest energy source in the world,
despite a decrease of 13 points between 1971 and 2016, mainly offset by
natural gas (+ 6 points), nuclear energy (+ 4 points) and coal (+ 1 point).
Although coal is only the second largest source of energy in the global mix,
it ranks first in terms of CO2 emissions, as its emission factor is significantly
higher than that of natural gas and oil (see p. 78). Coal consumption, which
increased sharply during the early-2000s, has levelled off, or even decreased
in the last few years. Although the share of renewable energies has generally
been stable in the last 45 years, it has grown slightly in the last ten years to
reach 14% of the mix in 2016.
Key figures on climate – France, Europe and Worldwide – 25part 2: how much greenhouse gas is emitted in the world?
GEOGRAPHICAL DISTRIBUTION OF GLOBAL CO2 EMISSIONS
(WITHOUT LULUCF)
In Mt CO2
1990 2016 2017 2017 share Evolution Evolution
(%) 2016-2017 1990-2017
(%) (%)
North America 5 832 6 270 6 232 16.8 - 0.6 + 6.9
of which Canada 456 601 617 1.7 + 2.7 + 35.4
United States 5 086 5 146 5 107 13.8 - 0.8 + 0.4
Central and South America 682 1 354 1 332 3.6 - 1.6 + 95.4
of which Brazil 229 492 493 1.3 + 0.2 + 115.6
Europe and ex-USSR 8 430 6 219 6 273 16.9 + 0.9 - 25.6
of which Russia 2 379 1 746 1 765 4.8 + 1.1 - 25.8
EU - 28 4 411 3 518 3 556 9.6 + 1.1 - 19.4
Germany 1 018 799 797 2.1 - 0.3 - 21.8
Spain 230 264 282 0.8 + 7.0 + 22.8
France 390 340 347 0.9 + 1.9 - 11.0
Italy 431 356 361 1.0 + 1.3 - 16.2
United Kingdom 589 392 379 1.0 - 3.1 - 35.6
Poland 371 315 319 0.9 + 1.2 - 14.0
Sub-Saharan Africa 466 809 817 2.2 + 1.0 + 75.3
Middle East and North Africa 1 047 3 054 3 179 8.6 + 4.1 + 203.6
of which Saudi Arabia 166 629 639 1.7 + 1.5 + 284.4
Asia 5 279 17 288 17 570 47.4 + 1.6 + 232.9
of which China 2 397 10 777 10 877 29.3 + 0.9 + 353.8
South Korea 270 651 673 1.8 + 3.5 + 149.3
India 606 2 371 2 455 6.6 + 3.5 + 305.1
Japan 1 149 1 320 1 321 3.6 + 0.1 + 14.9
Oceania 307 450 452 1.2 + 0.4 + 47.3
Annex I countries 15 010 13 621 13 624 36.7 + 0.0 - 9.2
Non-Annex I countries 7 033 21 825 22 233 60.0 + 1.9 + 216.1
International aviation bunkers 259 538 543 1.5 + 1.1 + 109.8
International marine bunkers 372 668 677 1.8 + 1.3 + 82.2
World 22 674 36 652 37 077 100.0 + 1.2 + 63.5
Note: international bunkers cover emissions from international marine and aviation transport that are not
included in the national totals (see glossary).
Source: EDGAR, 2018
Global CO2 emissions rose by 1.2% in 2017, at a higher rate than the
preceding year (+ 0.3%). These short term trends differ across continents:
the increases in Asia (+ 1.6%) and in Europe and Russia (+ 0.9%) are thus
partially offset by the reduction recorded in North America (- 0.6%).
26 – Key figures on climate – France, Europe and Worldwidepart 2: how much greenhouse gas is emitted in the world?
EVOLUTION OF GLOBAL CO2 EMISSIONS BETWEEN 1970 AND 2017
Index (1990 = 100)
500
450
400
350
300
250
200
150
100
50
0
1970 1975 1980 1985 1990 1995 2000 2005 2010 2017
United States EU-28 France China India World
Source: EDGAR, 2018
In 2017, China was the highest CO2 emitting country in the world (29.3%),
ahead of the United States (13.8%), the European Union (9.6%) and India
(6.6%). Between 1990 and 2017, emissions increased by 63.5%. Over this
period, the largest contributors to this rise were China (+ 350%, or
approximately 8.5 Gt CO2), India (+ 310%, or 1.8 Gt CO2) and the Middle
East and North Africa region (+ 200%, or 2.1 Gt CO2). Over the same period,
the United States’ emissions were near stable (+ 0.4%), those in the
European Union decreased (- 19.4%), as did those in France (- 11.0%).
Key figures on climate – France, Europe and Worldwide – 27part 2: how much greenhouse gas is emitted in the world?
GLOBAL CO2 EMISSIONS PER CAPITA (WITHOUT LULUCF)
In t CO2/capita
1990 2016 2017 Evolution Evolution
2016-2017 (%) 1990-2017 (%)
North America 16.1 12.9 12.7 - 1.5 - 21.1
of which Canada 16.4 16.6 16.8 + 1.4 + 2.5
United States 20.4 15.9 15.7 - 1.5 - 23.0
Central and South America 1.9 2.7 2.6 - 2.6 + 36.5
of which Brazil 1.5 2.4 2.4 - 0.6 + 53.8
Europe and ex-USSR 10.8 7.6 7.6 + 0.6 - 29.6
of which Russia 16.0 12.1 12.2 + 1.0 - 23.9
EU - 28 9.2 6.9 6.9 + 0.8 - 24.8
Germany 12.8 9.7 9.6 - 0.7 - 24.8
Spain 5.9 5.7 6.1 + 6.8 + 2.5
France 6.7 5.1 5.2 + 1.5 - 22.5
Italy 7.6 5.9 6.0 + 1.5 - 21.5
United Kingdom 10.3 6.0 5.7 - 3.8 - 44.2
Poland 9.7 8.3 8.4 + 1.2 - 13.7
Sub-Saharan Africa 0.9 0.8 0.8 - 1.7 - 14.9
Middle East and North Africa 3.4 5.9 6.1 + 2.3 + 79.2
of which Saudi Arabia 10.2 19.5 19.4 - 0.6 + 90.5
Asia 1.8 4.3 4.3 + 0.7 + 139.7
of which China 2.1 7.8 7.8 + 0.4 + 271.6
South Korea 6.3 12.7 13.1 + 3.0 + 107.7
India 0.7 1.8 1.8 + 2.4 + 163.2
Japan 9.3 10.4 10.4 + 0.2 + 12.0
Oceania 11.8 11.6 11.5 - 1.3 - 2.9
Annex I countries 12.5 10.0 10.0 - 0.4 - 20.2
Non-Annex I countries 1.7 3.6 3.6 + 0.5 + 109.6
World 4.3 4.9 4.9 + 0.0 + 14.8
Note: this is the CO2 emissions of a territory divided by its population. The average emissions by one person due to
his/her consumption are calculated using a different approach (footprint, see p. 38).
Sources: SDES, from EDGAR, 2018; World Bank, 2019
Global CO2 emissions in 2017 were, on average, 4.9 t CO2/capita, at a
comparable level to that of 2016 (+ 0.0%). The growth of global
emissions (+1.2% between 2016 and 2017) is thus identical to
demographic growth (+ 1.2%).
The emissions per capita data demonstrates significant geographical
disparities, with distinctly low levels in Latin America (2.6), in India (1.8) and in
sub-Saharan Africa (0.8). In contrast, French emissions (5.2) were slightly
higher than the global average (4.9). The EU’s mean emissions (6.9) were
higher, close to those of China (7.8). The United States (15.7), Russia (12.2),
Japan (10.4) and South Korea (13.1) had some of the highest levels.
28 – Key figures on climate – France, Europe and Worldwidepart 2: how much greenhouse gas is emitted in the world?
EVOLUTION OF GLOBAL CO2 EMISSIONS PER CAPITA BETWEEN 1990 AND 2017
In t CO2/capita
25
20
15
10
5
0
1990 1995 2000 2005 2010 2015 2017
United States EU-28 France China India World
Sources: SDES, from EDGAR, 2018; World Bank, 2019
Since 1990, global emissions per capita have risen by 15%. The situation
differs between the Annex I countries (see glossary), where high levels of
emissions (10.0 t CO2/capita) have been decreasing in the last 27 years
(- 20%), and the non-Annex I countries, where emission levels are almost
three times lower (3.6 t CO2/capita) but have more than doubled in 27 years
(+ 110%).
In detail, emissions per capita in Asia increased by 140% between 1990
and 2017 (270% in China, 160% in India and 110% in South Korea). Over
the same period, emissions per capita in Europe decreased by 30% (of which
- 22% in France and - 44% in the United Kingdom), and by over 21% in
North America (of which - 23% in the United States). In an intermediary
position, in Japan and sub-Saharan Africa, emissions per capita only slightly
changed, remaining high for the former (around 10 t CO2/capita), and low
for the latter (under 1 t CO2/capita).
Key figures on climate – France, Europe and Worldwide – 29part 2: how much greenhouse gas is emitted in the world?
GLOBAL CO2 EMISSIONS IN RELATION TO GDP (WITHOUT LULUCF)
In t CO2/millions $2011 PPP
1990 2016 2017 Evolution 2016- Evolution 1990-
2017 (%) 2017 (%)
North America 518 298 290 - 2.8 - 44.1
of which Canada 524 383 382 - 0.4 - 27.1
United States 550 298 289 - 3.0 - 47.4
Central and South America 213 213 206 - 3.3 - 3.5
of which Brazil 148 168 167 - 0.8 + 12.8
Europe and ex-USSR 521 252 249 - 1.6 - 52.3
of which Russia 777 487 485 - 0.4 - 37.6
EU - 28 383 189 187 - 1.5 - 51.3
Germany 410 218 213 - 2.4 - 48.0
Spain 249 170 177 + 3.8 - 29.0
France 226 134 134 + 0.0 - 40.7
Italy 244 170 169 - 0.2 - 30.6
United Kingdom 384 152 145 - 4.8 - 62.3
Poland 948 318 307 - 3.4 - 67.6
Sub-Saharan Africa 356 228 225 - 1.3 - 36.8
Middle East and North Africa 312 317 321 + 1.2 + 3.0
of which Saudi Arabia 240 387 396 + 2.4 + 65.1
Asia 517 394 379 - 3.9 - 26.7
of which China 1 383 543 512 - 5.6 - 63.0
South Korea 542 363 364 + 0.4 - 32.8
India 397 294 285 - 3.0 - 28.2
Japan 304 271 267 - 1.6 - 12.2
Oceania 529 352 346 - 1.6 - 34.6
Annex I countries 482 271 265 - 2.2 - 45.1
Non-Annex I countries 435 352 341 - 2.9 - 21.6
World 480 326 318 - 2.5 - 33.7
Note: GDP in volume, converted into US dollars using purchasing power parity (PPP), for the year 2011 (see
glossary).
Sources: SDES, from EDGAR, 2018; World Bank 2019
Although less dispersed than emission levels per capita, the ratios of
emissions to GDP are highly variable across the different countries, around
a global mean of 318 t CO2/million $. Some of the highest values occurred
in China (512 t CO2/million $), Russia (485) and Canada (382). Conversely,
the levels are much lower in the European Union (187) and particularly in
France (134).
30 – Key figures on climate – France, Europe and Worldwidepart 2: how much greenhouse gas is emitted in the world?
EVOLUTION OF GLOBAL CO2 EMISSIONS IN RELATION TO GDP
BETWEEN 1990 AND 2017
In t CO2/millions of $ 2011 PPP
1 600
1 400
1 200
1 000
800
600
400
200
0
1990 1995 2000 2005 2010 2015 2017
United States EU-28 France China India World
Sources: SDES, from EDGAR, 2018; World Bank 2019
The amount of global CO2 emitted per unit of GDP decreased by 2.5%
between 2016 and 2017, which is equal to the mean rate of decrease
observed over the last five years. This represents a slower growth in
emissions than that of global GDP (+ 3.7% in 2017).
Since 1990, the amount of global CO2 emitted per unit of GDP has
decreased by a third, whereas GDP has in fact multiplied 2.5 times.
Apart from a few rare exceptions – Saudi Arabia (+ 65%), Brazil (+ 13%) –
the majority of global economies are concerned by this decrease in the CO2
intensity of wealth production. The reduction is particularly strong in China
(- 63%), where historical levels have been particularly high. This intensity
has also been reduced by one half in the European Union (- 51%) and the
United States (- 47%).
Key figures on climate – France, Europe and Worldwide – 31part 2: how much greenhouse gas is emitted in the world?
Sectorial distribution of global
CO2 emissions
SOURCE OF CO2 EMISSIONS FROM FUEL COMBUSTION IN 2016
In %
100
4 4 5 7
6 4 6 12
90
9 12 ther sectors
O
(including
80 16 commercial/
24
institutional)
70 35
31 28 Residential
60
Transport
19 42
50 4 9 Industry
12 and
6 5 construction
40
6
nergy sector
E
30 excluding
47 electricity
13
20 40 39
34 Electricity
6 production
10
11
0
World China United States EU-28 France
Source: IEA, 2018
In 2016, electricity production was the highest CO2 emitting sector in the
world, with 40% of total emissions due to fuel combustion. The two other
large sectors in terms of emission factors are transport (24%) and industry
(19% including construction). In China, industry and the energy sector
(electricity and non-electricity) are responsible for a larger share in CO2
emissions compared to the global average. Transport plays a greater role
in the United States and the European Union. In the EU, emissions from
the residential sector also constitute a greater share than in the rest of the
world.
32 – Key figures on climate – France, Europe and Worldwidepart 3 How much greenhouse gas is emitted in Europe and in France? —In 2017, 4.1 Gt CO2e of GHGs were emitted in the EU, a reduction of 25% relative to 1990 levels. Net emissions (with LULUCF) in France amounted to 433 Mt CO2e, a reduction of 18% since 1990. In the EU, the highest emitting sector is the energy industry, whereas in France, the transport sector is the main contributor to French emissions. The footprint approach, which complements the territorial approach, provides an estimation of GHG emissions arising from consumption by the French population. In 2018, these were three quarters higher than national territorial emissions.
part 3: how much greenhouse gas is emitted in Europe and in France?

Overview of greenhouse gases
in Europe
EU-28 GHG EMISSIONS IN 2017
In Mt CO2e

 Sector                              Years         CO2          CH4           N2O       Fluorinated        Total
                                                                                            gas

                                     1990        4 123.6        195.3         29.8           0.0       4 348.7
 Energy
                                     2017        3 253.7         85.0         29.2           0.0       3 367.8

 Industrial Processes                1990          325.5          1.7        117.9          72.0           517.2
 and Product Use                     2017          248.3          1.6         11.1        116.5            377.5

                                     1990           14.7        304.5        224.0           0.0           543.3
 Agriculture
                                     2017           10.4        241.6        187.0           0.0           439.0

                                     1990             5.2       225.9           9.3          0.0           240.4
 Waste management
                                     2017             3.2       125.2         10.5           0.0           138.9

                                     1990        4 469.1        727.4        381.0          72.0       5 649.5
 Total (without LULUCF)
                                     2017        3 515.5        453.4        237.7        116.5        4 323.2

                                     1990         - 271.6         7.4         19.2           0.0       - 245.0
 LULUCF
                                     2017         - 284.3         8.0         18.3           0.0       - 258.1

                                     1990        4 197.5        734.9        400.2          72.0       5 404.6
 Total (with LULUCF)
                                     2017        3 231.1        461.4        256.0        116.5        4 065.1

Note: the waste management sector excludes incineration with energy recovery (included in “energy use”).
Source: European Environment Agency (EEA), 2019

In 2017, European Union GHG emissions, without LULUCF, totalled
4.3 Gt CO2e, of which 81% were CO2 emissions and 10% methane (CH4).
They increased by 0.5% compared to 2016 and over the longer term
decreased by 23% from 1990-2017.

  34 – Key figures on climate – France, Europe and Worldwide
part 3: how much greenhouse gas is emitted in Europe and in France?
DISTRIBUTION BY SOURCE OF GHG EMISSIONS FROM THE EU-28
BETWEEN 1990 AND 2017
In Mt CO2e
6 000
Energy
industries
5 000 Others Residential/
Commercial/
Institutional
174
4 000
569
1 179
3 000
500
2 000
Transport
1 000 946 Manufacturing
Industries and
Construction
0
1990 1995 2000 2005 2010 2017
Waste management Industrial Processes and Product Use
Agriculture Energy
Source: EEA, 2019
In the European Union, energy use was still the man source of GHG emissions
in 2017 (78.0%), followed by agriculture (10.0%). The energy industry
(notably electricity production) was the highest emitting activity sector
(27.3%), followed by transport (21.9%).
In 2017, total emissions rose by 0.5%. Two thirds of this increase is due
to energy use. The significant decrease in the energy industry (- 1.6%) did
not offset the increases in the manufacturing industry (+ 3.3%) and in
transport (+ 1.4%).
This growth in transport is part of a long term trend (+ 19% since 1990).
Inversely, in all the other sectors, emissions have been reduced (see part 4).
Key figures on climate – France, Europe and Worldwide – 35part 3: how much greenhouse gas is emitted in Europe and in France?
Overview of greenhouse gases
in France
GHG EMISSIONS IN FRANCE IN 2017
In Mt CO2e
Sector Years CO2 CH4 N2O Fluorinated Total
gas
1990 365.3 12.7 3.3 0.0 381.3
Energy
2017 320.6 2.8 3.8 0.0 327.3
Industrial Processes 1990 31.5 0.1 23.8 11.8 67.2
and Product Use 2017 22.3 0.1 1.7 19.9 43.9
1990 1.8 42.3 38.2 0.0 82.3
Agriculture (excluding energy use)
2017 1.9 38.5 35.7 0.0 76.2
1990 2.2 14.2 0.9 0.0 17.3
Waste management
2017 1.6 14.8 0.8 0.0 17.2
1990 400.8 69.3 66.2 11.8 548.1
Total (without LULUCF)
2017 346.5 56.3 42.0 19.9 464.6
1990 - 26.4 1.0 3.2 0.0 - 22.2
LULUCF
2017 - 36.2 1.2 3.1 0.0 - 31.9
1990 374.4 70.3 69.4 11.8 525.9
Total (with LULUCF)
2017 310.2 57.5 45.1 19.9 432.7
Scope: except where stated otherwise, in all of this document, emissions in “France” correspond to the scope
of the Kyoto Protocol: mainland and overseas territories included in the EU (Guadeloupe, Guyana, Réunion,
Martinique, Mayotte and Saint-Martin).
Source: EEA, 2019
In 2017, French GHG emissions, without LULUCF, represented 465 Mt CO2e,
of which 75% were of CO2 and 12% of methane. They rose by 0.9%
compared to 2016 and fell by 15% over the 1990-2017 period.
As across the whole of the European Union, energy use is the greatest
source of GHG emissions in France, accounting for 327 Mt CO2 in 2017, or
70.3% of the national total. It is followed by agriculture (16.7%), a higher
level than the European average.
36 – Key figures on climate – France, Europe and Worldwidepart 3: how much greenhouse gas is emitted in Europe and in France?
DISTRIBUTION BY SOURCE OF GHG EMISSIONS IN FRANCE
BETWEEN 1990 AND 2017
In Mt CO2e
600 Energy
industries
Others Residential/
Commercial/
500
Institutional
15
50
400
77
300
200 51
Transport
135
100 Manufacturing
Industries and
Construction
0
1990 1995 2000 2005 2010 2017
Waste management Industrial Processes and Product Use
Agriculture Energy
Source: EEA, 2019
France differs from the rest of the EU due to the low share of emissions from
the energy industry, because of its large nuclear electricity production
capacity. Transport is thus the largest emitting sector, with 135 Mt CO2e, or
29% of the national total.
In 2017, total emissions (without LULUCF) rose by 0.9%. This increase
was concentrated in the energy industry sector (+ 10%), since thermal power
plants were put to greater use for electricity production than in 2016. Over
the longer term, emissions have been reduced by 15% since 1990, with
decreases in all of the sectors with the exception of transport (+ 10%).
Key figures on climate – France, Europe and Worldwide – 37part 3: how much greenhouse gas is emitted in Europe and in France?
Carbon footprint and imported
emissions
COMPARISON BETWEEN THE CARBON FOOTPRINT AND THE NATIONAL INVENTORY
IN 2014
In Mt CO2e
800 720 Mt CO2e
or 10.9 tonnes/person
700
600
Emissions associated 435 Mt CO2e
500
with imports or 6.6 tonnes/person
400 Emissions associated
with exports
300
Emissions from domestic Emissions from domestic
200 production (excluding exports) production (excluding exports)
100 Direct household emissions Direct household emissions
(cars and heating) (cars and heating)
0
Carbon footprint National inventory (territory)
Note: the footprint and inventory (see glossary) apply to the three main greenhouse gases (CO2, CH4, N2O).
Data not corrected for climatic variations.
Scope: France + Overseas Departments and Regions (Kyoto Protocol perimeter).
Sources: Citepa; IEA; FAO; Customs; Eurostat; Insee. Data processing: SDES, 2019
Two complementary methods demonstrate the influence of a country on the
climate:
• national inventories calculate the amount of GHGs physically emitted inside
the country (territorial approach). These national inventories are drawn up
each year following standards defined by the United Nations Framework
Convention on Climate Change (UNFCCC);
• the carbon footprint calculates the GHGs driven by the country’s domestic
demand. The carbon footprint is made up of direct household emissions
(housing and cars), emissions from domestic production excluding exports
and emissions from the import of goods and services consumed in France
(56% of the total footprint). The national inventory calculates domestic
emissions only, including exported production, which represents 29% of
the inventory total.
38 – Key figures on climate – France, Europe and Worldwidepart 3: how much greenhouse gas is emitted in Europe and in France?
EVOLUTION OF THE CARBON FOOTPRINT
In Mt CO2e In t CO2e/capita
11.5 11.8 11.5
11.0 11.2 12.0
800 10.5
700 10.0
600
284 327 371 8.0
211 408 425
500
6.0
400
300 4.0
200 412 410 412 370 323 324 2.0
100
0 0.0
1995 2000 2005 2010 2015(e) 2018(e)
Emissions associated with imports (excluding re-exported imports) in millions of tonnes of CO2e
Domestic emissions (households and domestic economic activities excluding exports) in millions
of tonnes of CO2e
Mean annual emissions per capita in tonnes of CO2e
(e): estimation.
Note: the carbon footprint covers the three main greenhouse gases (CO2, CH4, N2O). Data not corrected
for climatic variations.
Scope: France + Overseas Departments and Regions (Kyoto Protocol perimeter).
Sources: Citepa; IEA; FAO; Customs; Eurostat; Insee. Data processing: SDES, 2019
In 2018, the carbon footprint of France was estimated to be 749 Mt CO2e.
Between 1995 and 2018, the level of the footprint rose by 20% whereas,
over the same period, the final domestic demand (French consumption in
the broad sense, in euros, including investments) increased by 87%. Since
1995, the level of imported emissions has doubled. On the other hand, over
the same period, emissions from domestic economic activities decreased
by 28% and those from households (private cars and heating) decreased
by 7%. After a sharp rise between 1995 and the mid-2000s, the footprint
appears to have stabilised over the last decade. In 2018, the level of the
carbon footprint was still much higher than that of territorial emissions
(+ 76%). Per capita, the rise in the carbon footprint is less pronounced: + 7%
since 1995. In 2018, a French person emitted on average 11.2 tonnes of
CO2e per year.
Key figures on climate – France, Europe and Worldwide – 39part 3: how much greenhouse gas is emitted in Europe and in France?
INTERNATIONAL COMPARISON OF CO2 EMISSIONS FROM FUEL COMBUSTION
DEPENDING ON THE APPROACH
In Gt CO2
12
China
10
8
North America
6
EU-28
4
2
India
Africa
0
1990 1992 1994 1996 1998 2000 2002 2004 2006 2008 2010 2012 2014 2016
Approach CO2 transfer
Footprint Net imports
Territory Net exports
Note: the footprint here covers CO2 only.
Source: I4CE, 2019, from the Global Carbon Budget 2018 and World Bank, 2018
Between 1990 and 2016, CO2 emissions from fuel combustion in the OECD
increased by 2% according to the territory approach and 7% using the
footprint approach. Over this period, they decreased by 22% in the EU-28
according to the territory approach and by 17% using the footprint approach.
However, they have tripled in China, whatever approach is used.
In 2016, emissions per capita in China were almost equal to those in the
EU-28 according to the territory approach (approx 7 t CO2/capita/year). On
the other hand, the footprint approach gives emissions per capita as 20%
lower in China than in the EU-28, and more than 40% lower than the OECD
average (6 t CO2/cap/yr in China, against 8 tCO2/cap/yr in the EU and
11 tCO2/cap/yr on average in the OECD.)
40 – Key figures on climate – France, Europe and Worldwidepart 4 How are the GHG emissions distributed by sector in Europe and in France? —The French and European inventories provide a breakdown of GHG emissions by sector and sub-sector. In Europe and in France, the greatest emissions reductions since 1990 can be observed in the energy sectors, particularly the manufacturing industry, and to a lesser extent, in the residential and commercial/institutional sectors. The transport sector is an exception with higher emission levels in 2017 than in 1990 in Europe and France alike, although they are now below the peak emission levels obtained in the 2000s. LULUCF (see glossary) produces negative emissions, corresponding to a net CO2 sequestration by biomass and soils.
part 4: how are GHG emissions distributed by sector in Europe and in France?

GHG emissions from
the energy industry
GHG EMISSIONS FROM THE ENERGY INDUSTRY IN EU-28
In Mt CO2e
2 000

1 500

1 000

  500

    0
    1990                1995                2000               2005                2010               2015    2017

        Public Electricity and Heat Production       Manufacture of Solid Fuels and Other Energy Industries
        Fugitive Emissions from Fuels                Petroleum Refining

Note: the production of electricity and heat includes waste incineration with energy recovery, the heat here is
the heat subject to a transaction.
Source: EEA, 2019

GHG EMISSIONS FROM THE ENERGY INDUSTRY IN FRANCE
In Mt CO2e
   80

   60

   40

   20

    0
    1990                1995                2000                2005               2010                2015   2017

        Public Electricity and Heat Production      Manufacture of Solid Fuels and Other Energy Industries
        Fugitive Emissions from Fuels               Petroleum Refining

Note: the production of electricity and heat includes waste incineration with energy recovery, the heat here is
the heat subject to a transaction.
Source: EEA, 2019

  42 – Key figures on climate – France, Europe and Worldwide
You can also read