Global-scale drought risk assessment for agricultural systems - NHESS
←
→
Page content transcription
If your browser does not render page correctly, please read the page content below
Nat. Hazards Earth Syst. Sci., 20, 695–712, 2020
https://doi.org/10.5194/nhess-20-695-2020
© Author(s) 2020. This work is distributed under
the Creative Commons Attribution 4.0 License.

Global-scale drought risk assessment for agricultural systems
Isabel Meza1 , Stefan Siebert2 , Petra Döll3,6 , Jürgen Kusche4 , Claudia Herbert3 , Ehsan Eyshi Rezaei2 ,
Hamideh Nouri2 , Helena Gerdener4 , Eklavyya Popat3 , Janna Frischen1 , Gustavo Naumann5 , Jürgen V. Vogt5 ,
Yvonne Walz1 , Zita Sebesvari1 , and Michael Hagenlocher1
1 Institute for Environment and Human Security (UNU-EHS), United Nations University,
UN Campus, Platz der Vereinten Nationen 1, 53113 Bonn, Germany
2 Department of Crop Sciences, University of Göttingen, Von-Siebold-Strasse 8, 37075 Göttingen, Germany
3 Institute of Physical Geography, Goethe University Frankfurt, Altenhöferallee 1, 60438 Frankfurt am Main, Germany
4 Institute of Geodesy and Geoinformation (IGG), University of Bonn, Nussallee 17, 53115 Bonn, Germany
5 European Commission (EC), Joint Research Centre (JRC), Via Enrico Fermi 2749, 21027 Ispra, VA, Italy
6 Senckenberg Biodiversity and Climate Research Centre Frankfurt (SBiK-F),

Senckenberganlage 25, 60325 Frankfurt am Main, Germany

Correspondence: Isabel Meza (meza@ehs.unu.edu)

Received: 31 July 2019 – Discussion started: 2 August 2019
Revised: 11 December 2019 – Accepted: 29 January 2020 – Published: 2 March 2020

Abstract. Droughts continue to affect ecosystems, commu-          1   Introduction
nities and entire economies. Agriculture bears much of the
impact, and in many countries it is the most heavily affected
sector. Over the past decades, efforts have been made to as-      Droughts exceed all other natural hazards in terms of the
sess drought risk at different spatial scales. Here, we present   number of people affected and have contributed to some of
for the first time an integrated assessment of drought risk for   the world’s most severe famines (FAO, 2018; CRED and
both irrigated and rainfed agricultural systems at the global     UNISDR, 2018). Drought is conceived as an exceptional and
scale. Composite hazard indicators were calculated for irri-      sustained lack of water caused by a deviation from normal
gated and rainfed systems separately using different drought      conditions over a certain region (Tallaksen and Van Lanen,
indices based on historical climate conditions (1980–2016).       2004; Van Loon et al., 2016). It can have manifold impacts on
Exposure was analyzed for irrigated and non-irrigated crops.      social, ecological and economic systems, for instance agri-
Vulnerability was assessed through a socioecological-system       cultural losses, public water shortages, reduced hydropower
(SES) perspective, using socioecological susceptibility and       supply, and reduced labor or productivity. While many sec-
lack of coping-capacity indicators that were weighted by          tors are affected by drought, agriculture’s high dependency
drought experts from around the world. The analysis shows         on water means it is often the first of the most heavily af-
that drought risk of rainfed and irrigated agricultural systems   fected sectors (Dilley et al., 2005; UNDRR, 2019). With
displays a heterogeneous pattern at the global level, with        nearly 1.4 billion people (18 % of the global population) em-
higher risk for southeastern Europe as well as northern and       ployed in agriculture, droughts threaten the livelihoods of
southern Africa. By providing information on the drivers and      many and hamper the achievement of the Sustainable De-
spatial patterns of drought risk in all dimensions of hazard,     velopment Goals (SDGs) – notably SDG 1 (no poverty),
exposure and vulnerability, the presented analysis can sup-       SDG 2 (zero hunger), SDG 3 (good health and well-being)
port the identification of tailored measures to reduce drought    and SDG 15 (life on land). While there is ambiguity regard-
risk and increase the resilience of agricultural systems.         ing global drought trends over the past century (Sheffield
                                                                  et al., 2012; Trenberth et al., 2013; McCabe and Wolock,
                                                                  2015), drought hazards will likely increase in many regions
                                                                  in the coming decades (Sheffield and Wood, 2008; Dai, 2011;
                                                                  Trenberth et al., 2013; Spinoni et al., 2017, 2019b; UNDRR,

Published by Copernicus Publications on behalf of the European Geosciences Union.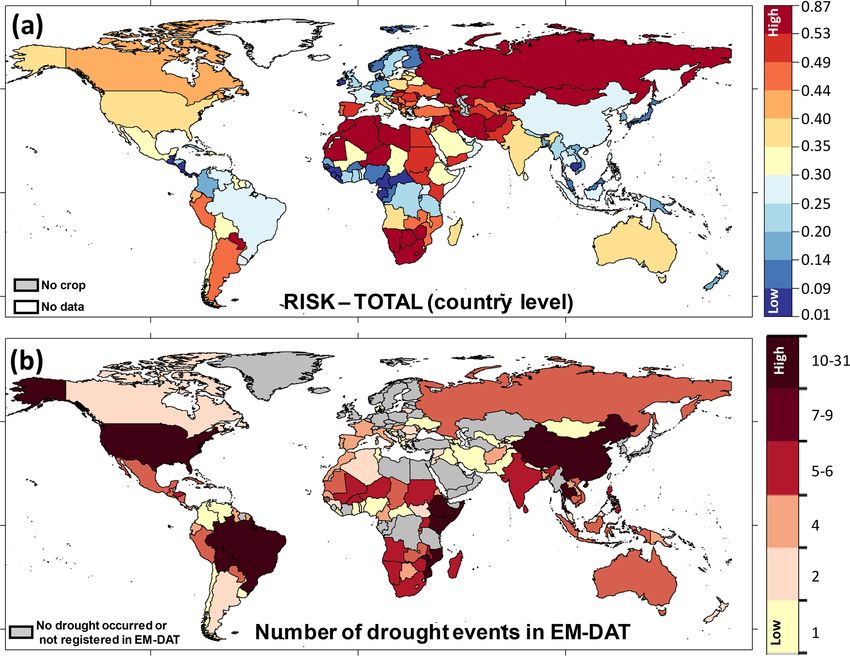
696                                              I. Meza et al.: Global-scale drought risk assessment for agricultural systems

2019). Identifying pathways towards more drought resilient           needed to inform targeted drought risk reduction, resilience
societies therefore remains a global priority.                       and adaptation strategies (IPCC, 2014). Such analyses are
   Recent severe droughts in southeastern Brazil (2014–              currently lacking. Furthermore, in their exposure analysis,
2017), California (2011–2017), the Caribbean (2013–2016),            Carrão et al. (2016) do not distinguish between rainfed and
northern China (2010–2011), Europe (2011, 2015, 2018), In-           irrigated agriculture, although different hazard indicators are
dia (2016, 2019), the Horn of Africa (2011–2012), South              relevant when assessing drought risk for these systems. In
Africa (2015–2016, 2018) and Vietnam (2016) have clearly             addition, the vulnerability analysis presented by Carrão et
shown that the risk of negative impacts associated with              al. (2016) is based on a reduced set of social, economic and
droughts is not only linked to the severity, frequency and du-       infrastructure-related indicators and does not account for the
ration of drought events but also to the degree of exposure,         role of ecosystem-related indicators as a driver of drought
susceptibility and lack of coping capacity of a given socioe-        risk – a gap that was recently highlighted in a systematic re-
cological system (SES). Despite this, proactive management           view of existing drought risk assessments across the globe
of drought risk is still not a reality in many regions across the    (Hagenlocher et al., 2019). A socioecological-system per-
world. Droughts and their impacts are still mostly addressed         spective, especially when assessing drought risk in the con-
through reactive crisis management approaches, for example,          text of agricultural systems, where livelihoods depend on
by providing relief measures (Rojas, 2018). To improve the           ecosystems and their services, can help to better understand
monitoring, assessment, understanding and ultimately proac-          the role of ecosystems and their services not only as a driver
tive management of drought risk effectively, we need to ac-          of drought risk but also as an opportunity for drought risk
knowledge that the root causes, patterns and dynamics of             reduction (Kloos and Renaud, 2016).
exposure and vulnerability need to be considered alongside              This paper addresses some of the above gaps by present-
climate variability in an integrated manner (Spinoni et al.,         ing, for the first time, an integrated drought risk assessment
2019a; Hagenlocher et al., 2019).                                    that brings together data from different sources and disci-
   Over the past decades, major efforts have been made to            plines for rainfed and irrigated agricultural systems consider-
improve natural hazard risk assessments and their method-            ing relevant drought hazard indicators, exposure and vulner-
ologies across scales, ranging from global risk assessments          ability at the global scale. The spatial variability in drought
to local-level assessments. At the global scale several stud-        risk on global and regional scales might help to identify
ies have been published in recent years, focusing on the as-         leverage points for reducing impacts and properly anticipate,
sessment of flood risk (Hirabayashi et al., 2013; Ward et al.,       adapt and move towards resilient agricultural systems.
2013, 2014), seismic risk (Silva et al., 2018), cyclone risk
(Peduzzi et al., 2012) or multi-hazard risk (e.g., Dilley et
al., 2005; Peduzzi et al., 2009; Welle and Birkmann, 2015;           2   Methods
Garschagen et al., 2016; INFORM, 2019; Koks et al., 2019;
                                                                     Today, it is widely acknowledged that risk associated with
UNDRR, 2019). While major progress has been made re-
                                                                     natural hazards, climate variability and change is a function
garding the mapping, prediction and monitoring of drought
                                                                     of hazard, exposure and vulnerability (IPCC, 2014; UNDRR,
events at the global scale (e.g., Yuan and Wood, 2013; Geng
                                                                     2019). Following that logic, Fig. 1 shows the overall work-
et al., 2013; Spinoni et al., 2013, 2019b; Damberg and
                                                                     flow of the assessment, while the subsequent sections de-
AghaKouchak, 2014; Hao et al., 2014; Carrão et al., 2017),
                                                                     scribe in detail how drought risk for agricultural systems,
very few studies have assessed either exposure to drought
                                                                     including both irrigated and rainfed systems, was assessed
hazards (Güneralp et al., 2015) or drought risk at the global
                                                                     at the global scale.
level (Carrão et al., 2016; Dilley et al., 2005; Li et al., 2009).
                                                                        The composite drought hazard indicators were calculated
The study by Carrão et al. (2016) presents the first attempt
                                                                     for irrigated and rainfed systems separately using drought
to map drought risk at the global scale while considering
                                                                     indices based on historical climate conditions (1980–2016),
drought hazard (based on precipitation deficits), exposure
                                                                     which resulted in integrated hazard maps for both rainfed and
(population, livestock, crops, water stress) and societal vul-
                                                                     irrigated agricultural systems, respectively. The different ir-
nerability (based on social, economic and infrastructural in-
                                                                     rigated and non-irrigated crops by country were considered
dicators). While generic drought risk assessments are useful
                                                                     to be the exposed element. Due to the lack of high-resolution
for establishing an overview of the key patterns and hotspots
                                                                     gridded data on an agricultural-dependent population at the
of drought risk, it is increasingly acknowledged that drought
                                                                     global scale, this exposure indicator was not considered. The
risk assessment should be tailored to the needs of specific
                                                                     vulnerability component was assessed through a SES lens,
users so that management plans can be developed to re-
                                                                     where socioecological susceptibility and a lack of coping-
duce impacts (Vogt et al., 2018; UNDRR, 2019). Impact or
                                                                     capacity indicators were weighted by drought experts around
sector-specific assessments of who (e.g., farmers) and what
                                                                     the world.
(e.g., crops) are at risk as well as what they are at risk of
(e.g., abnormally low soil moisture, deficit in rainfall, be-
low average streamflow), where they are at risk and why are

Nat. Hazards Earth Syst. Sci., 20, 695–712, 2020                              www.nat-hazards-earth-syst-sci.net/20/695/2020/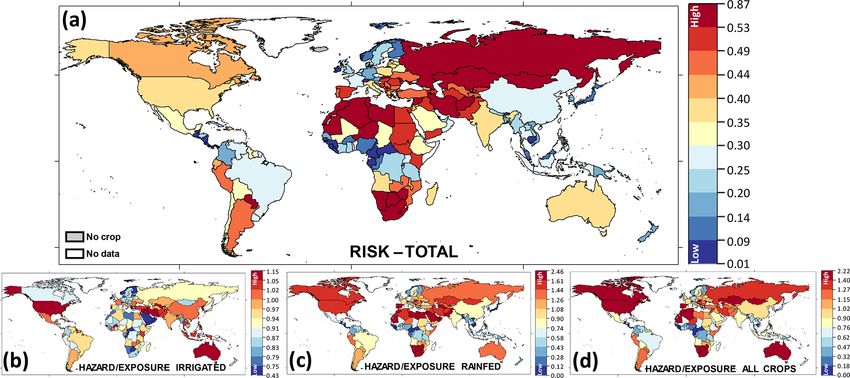
I. Meza et al.: Global-scale drought risk assessment for agricultural systems                                                           697

Figure 1. Workflow for the overall global drought risk assessment for agricultural systems (including irrigated and rainfed systems).

2.1   Drought hazard and exposure indicators                             elements located in areas that could be adversely affected by
                                                                         drought hazard. The distinct exposure of irrigated and rainfed
The drought hazard indicators considered here represent the              agricultural systems to drought was considered by weighting
average drought hazard during the period 1980 to 2016 in                 grid-cell-specific hazards with the harvested area of irrigated
each spatial unit for which it is computed. Drought hazard               and rainfed crops according to the monthly irrigated and
is defined as a deviation of the situation in a specific year or         rainfed crop areas’ (MIRCA2000) data set (Portmann et al.,
month from long-term mean conditions in the 30-year ref-                 2010) when aggregating grid-cell-specific hazards to expo-
erence period from 1986 to 2015. To quantify drought haz-                sure at a national scale. MIRCA2000 was also used to inform
ard for such a long period, we used the global water re-                 the models used in the hazard calculations about growing ar-
sources and water use model WaterGAP (Müller Schmied                     eas and growing periods of irrigated and rainfed crops. The
et al., 2014) and the global crop water model (GCWM;                     data set refers to the period centered around the year 2000;
Siebert and Döll, 2010). The models simulate terrestrial                 time series information is not available at the global scale.
hydrology (WaterGAP) and crop water use (GCWM) for                       To maximize the representativeness of the land use, the ref-
daily time steps on a spatial resolution of 30 arcmin (Wa-               erence period and evaluation period used in this study were
terGAP) or 5 arcmin (GCWM). The most recent version,                     centered around the year 2000.
WaterGAP 2.2d, was forced by the WFDEI-GPCC climate
data set (Weedon et al., 2014), which was developed by ap-               2.1.1   Irrigated agricultural systems
plying the forcing data methodology developed in the EU
project WATCH on ERA-Interim reanalysis data (Table 1).                  The composite drought hazard indicator is defined as the
The GCWM used the CRU-TS 3.25 climate data set (Har-                     product of mean severity and frequency of drought events.
ris et al., 2014) as input. CRU-TS 3.25 was developed by                 For irrigated agriculture (CH_IrrigAg) it combines an indica-
the Climate Research Unit of the University of East Anglia               tor for streamflow drought hazard (SH), i.e., for abnormally
by interpolation of weather station observations and is pro-             low streamflow in rivers, with an indicator of an abnormally
vided as a time series of monthly values. Pseudo-daily cli-              high irrigation water requirement (IH; Fig. 1). It thus consid-
mate was generated by the GCWM as described in Siebert                   ers the deviations of both demand and supply of water from
and Döll (2010). Following the definitions of the Intergov-              normal conditions. SH and IH are computed with a spatial
ernmental Panel on Climate Change put forward in their Fifth             resolution of 0.5◦ by 0.5◦ (55 km by 55 km at the Equator).
Assessment Report (IPCC, 2014), exposure is defined as the               Greenland and Antarctica are excluded. As IH is not mean-

www.nat-hazards-earth-syst-sci.net/20/695/2020/                                    Nat. Hazards Earth Syst. Sci., 20, 695–712, 2020
698                                               I. Meza et al.: Global-scale drought risk assessment for agricultural systems

Table 1. Hazard and exposure indicators used in the analysis and their processed data.

    Risk               Composite      Indicator             Processed data
    component          indicator
                                      Accumulated           WaterGAP (1980–2016) with climate forcing WFDEI-GPCC.
                                      streamflow deficit    Streamflow monthly time series.
                       CH_IrrigAg
                                      Accumulated           Irrigation GCWM (1980–2016) with climate forcing CRU TS3.25. Monthly
    Drought hazard                    surplus               time series of net irrigation requirements.
                                      AET / PET             GCWM (1980–2016) with climate forcing CRU TS3.25. Annual
                       CH_RfAg        deviation ratio       time series of the deviation of the ratio AET / PET from the
                                                            long-term (1986–2015) median of the ratio AET / PET.
    Exposed            Rainfed and    Aggregation of        MIRCA2000 data set was used to compute harvested area
    elements           irrigated      pixel-level data to   weighted averages of the indicators.
                                      national scale

ingful in grid cells without irrigation, CH_IrrigAg is only             uation period. As in the case of SH, the deficit and thus
computed for grid cells in which irrigated crops are grown              the severity of streamflow drought are strongly correlated
according to MIRCA2000 (Portmann et al., 2010).                         with the mean annual streamflow; mean severity is there-
   IH was calculated by using the GCWM based on a                       fore scaled by dividing the accumulated streamflow deficit
monthly time series of net irrigation requirements from 1980            by mean annual streamflow. In this way scaled mean stream-
to 2016. The net irrigation requirement is the volume of wa-            flow drought severity is expressed as the fraction of the mean
ter needed to ensure that the AET of irrigated crops is sim-            annual flow volume that is on average missing during drought
ilar to their PET (Fig. 1). The calculations were performed             events. In the case of IH, mean severity is transformed log-
for 487 121 grid cells with a resolution of 5 arcmin, contain-          arithmically before computation of IH, as in most grid cells
ing irrigated crop areas, and then aggregated to 26 478 grid            the volume of irrigation water needed additionally in drought
cells with a 30 arcmin resolution to be consistent with the             periods is relatively small (volume in 569 out of the 26 478 ir-
resolution used by WaterGAP. SH was calculated by using                 rigated grid cells is lower than 100 m3 ; in 1450 grids it is
WaterGAP based on a monthly time series of streamflow                   lower than 1000 m3 ). However, there are also some grids
from 1980 to 2016 in 66 896 grid cells with a 0.5◦ × 0.5◦               with extremely high values (95 grids where the additional
resolution worldwide.                                                   irrigation water requirement per drought event is larger than
   For both IH and SH, drought hazard per grid cell was                 100 000 000 m3 ). The logarithmic transformation accounted
quantified as the product of the (scaled or transformed)                for the specific value distribution.
mean severity of all drought events during the evaluation pe-              CH_IrrigAg was then calculated for each grid cell by
riod 1980–2016 and the frequency of drought events during               combining SH and IH. To ensure that both indicators are
this period. Drought events for IH and SH were determined               weighted equally, their native values were first scaled to a
independently. In the case of IH computation, a drought event           range between 0 and 1 by dividing SH and IH in each grid
starts as soon as the monthly irrigation requirement exceeds            cell by the maximum SH or IH detected globally. The fre-
the irrigation requirement threshold and ends when the sur-             quency distribution of the SH values calculated that way
plus reaches zero. In the case of SH computation, a drought             was shifted to the left, with a mean of 0.244, while the fre-
starts if the monthly streamflow drops below the stream-                quency distribution of IH was shifted to the right, with a
flow threshold and ends as soon as the deficit reaches zero.            mean of 0.664. Therefore, CH_IrrigAg was calculated for
For each grid cell and each of the 12 calendar months, a                each grid cell as
drought threshold was defined as the median of the vari-
able values in the respective calendar month during the ref-            CH_IrrigAg = 0.5 SH/SH + IH/IH ,                            (1)
erence period 1986–2015. To avoid spurious short droughts
and drought interruptions, it was defined that a drought event          with SH being the grid-cell-specific streamflow hazard,
starts (1) with at least 2 consecutive months with an IH sur-           IH being the grid-cell-specific irrigation requirement hazard,
plus or a SH deficit and (2) 1 month without an IH sur-                 and SH and IH being the mean of SH or IH calculated across
plus or if a SH deficit does not break the event (Spinoni               all grid cells.
et al., 2019a). The accumulated surplus (IH) divided by the                The exposure of irrigated agricultural systems to drought
deficit (SH) during each drought event is the severity of the           at the national scale was derived as the harvested-area
drought event. Mean severity is computed as the arithmetic              weighted mean of the CH_IrrigAg across all grid cells be-
average of the severity of all drought events during the eval-          longing to the respective aggregation units.

Nat. Hazards Earth Syst. Sci., 20, 695–712, 2020                                  www.nat-hazards-earth-syst-sci.net/20/695/2020/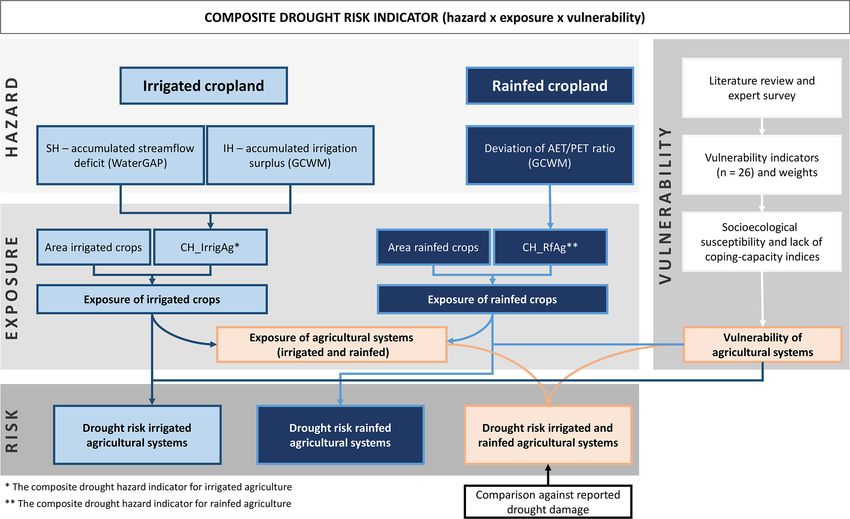
I. Meza et al.: Global-scale drought risk assessment for agricultural systems                                               699

2.1.2   Rainfed agricultural systems
                                                                Exptot =  AHrf · Exprf /0.189

The composite drought hazard indicator for rainfed agricul-            + AHirr · Expirr /0.455 /AHtot ,                     (2)
ture (CH_RfAg) was quantified based on the ratio of actual
                                                                with Exptot , Exprf and Expirr being the exposure of the whole,
crop evapotranspiration (AET in m3 d−1 ) to potential crop
                                                                rainfed and irrigated cropping systems to drought and AHtot ,
evapotranspiration (PET in m3 d−1 ), calculated for the eval-
                                                                AHrf and AHirr being the harvested area of all crops, rainfed
uation period 1980–2016 and compared to the reference pe-
                                                                crops and irrigated crops.
riod 1986–2015 (Fig. 1). PET quantifies the water require-
ment of the crop without water limitation, while AET refers     2.2   Vulnerability and risk assessment
to the evapotranspiration under actual soil moisture condi-
tions.                                                          According to the Intergovernmental Panel on Climate
   The GCWM was applied for 24 specific rainfed crops and       Change (IPCC, 2014), vulnerability is the predisposition to
the two groups “others, annual” and “others, perennial” to      be adversely affected as a result of the sensitivity or sus-
calculate crop-specific AET and PET on a daily time step.       ceptibility of a system and its elements to harm, coupled
Together, the 24 crops and two crop groups cover all crop       with a lack of coping and adaptive capacity. The assessment
species distinguished by FAO in their database FAOSTAT.         of drought vulnerability is complex because it depends on
The sum of daily crop-specific AET and PET was calcu-           both biophysical and socioeconomic drivers (Naumann et al.,
lated for all crops and for each year in the period 1980–2016   2014). Due to this complexity, the most common method to
for 927 857 grid cells containing rainfed cropland and aggre-   assess vulnerability in the context of natural hazards and cli-
gated to 37 265 grid cells with the resolution 0.5◦ × 0.5◦ .    mate change is using composite indicators or index-based
   The mean ratio between AET and PET (AET/PET) for             approaches (Beccari, 2016; de Sherbinin et al., 2019). Al-
the reference period 1986–2015 was then calculated for each     though their usefulness for policy support has also been sub-
grid cell. AET/PET reflects long-term water limitations for     ject to criticism (Hinkel, 2011; Beccari, 2016), it is widely
the geographic unit, with low values representing high arid-    acknowledged that composite indicators can identify generic
ity and high values for low aridity. CH_RfAg was then de-       leverage points for reducing impacts at the regional to global
termined by calculating the ratio AET / PET for each year       scale (De Sherbinin et al., 2017, 2019; UNDRR, 2019).
from 1980–2016 and by deriving the percentile of a relative        Following the workflow to calculate composite indi-
difference of 10 % to the long-term mean ratio AET/PET          cators proposed by the Organisation for Economic Co-
from the time series. Consequently, CH_RfAg reflects the        operation and Development (OECD, 2008) and Hagenlocher
probability of occurrence of a drought year in which the ra-    et al. (2018), the methodological key steps on which the vul-
tio between total AET and total PET across all rainfed crops    nerability assessment is based are (1) the definition of the
is 10 % lower than the long-term mean ratio AET/PET. We         conceptual framework, (2) identification of valid indicators,
also tested other percentage thresholds (20 %, 30 %, 50 %),     (3) data acquisition and preprocessing, (4) analysis and im-
but for many parts of the world we never computed reduc-        putation of missing data, (5) detection and treatment of out-
tions of the ratio AET / PET by more than 10 % of the long-     liers, (6) assessment of multicollinearities, (7) normalization,
term mean ratio (Table S5). Therefore, it was decided to use    (8) weighted aggregation, and (9) visualization.
the 10 % threshold consistently.                                   An initial set of vulnerability indicators for agricultural
                                                                systems was identified based on a recent review of exist-
2.1.3   Integration of drought exposure of irrigated and        ing drought risk assessments (Hagenlocher et al., 2019). In
        rainfed cropping systems                                total 64 vulnerability indicators, including social, economic
                                                                and physical indicators; farming practices; and environmen-
The combined drought exposure of rainfed and irrigated
                                                                tal, governance, and crime and conflict factors, were selected
cropping systems was evaluated at the country level by av-
                                                                and classified by socioecological susceptibility (SOC_SUS,
eraging the harvested-area weighted drought exposure of ir-
                                                                ENV_SUS), a lack of coping capacity (COP) and a lack of
rigated and rainfed cropping systems. As described before,
                                                                adaptive capacity (AC) following the risk framework of the
distinct methods were used to calculate hazard and expo-
                                                                IPCC (IPCC, 2014). Indicator weights, which express the rel-
sure of irrigated and rainfed systems so that a direct com-
                                                                evance of the identified indicators to characterizing and as-
parison of the exposure values is not meaningful. In addi-
                                                                sessing the vulnerability of agricultural systems to droughts,
tion, the frequency distributions differed considerably, with
                                                                were identified through a global survey of relevant experts
a harvested-area weighted global mean of the drought ex-
                                                                (n = 78), the majority of whom have worked in academia
posure of 0.455 for irrigated systems and 0.189 for rainfed
                                                                and for governmental organizations with more than 5 years
systems. To ensure a more similar weight of rainfed and irri-
                                                                of work experience (Meza et al., 2019). In total, 46 of the
gated drought exposure, country-specific exposures were di-
                                                                64 indicators were considered relevant by the experts, com-
vided by the global mean, and then the integrated exposure
                                                                prising susceptibility, coping- and adaptive-capacity indica-
was calculated as harvested-area weighted mean:
                                                                tors. However, since adaptive capacity is only relevant when

www.nat-hazards-earth-syst-sci.net/20/695/2020/                            Nat. Hazards Earth Syst. Sci., 20, 695–712, 2020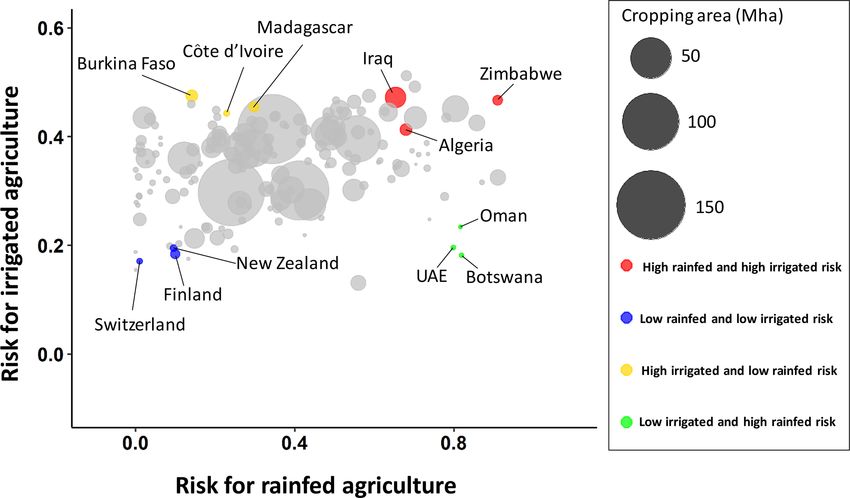
700                                                           I. Meza et al.: Global-scale drought risk assessment for agricultural systems

Table 2. Vulnerability indicators used in the analysis and their related expert weights.

           Indicator                                                                       Data source                         Weight∗
           Social susceptibility (SOC_SUS)
           Share of GDP from agr., forestry and fishing in USD (%)                         FAO (2016a)                          0.96
           Rural population (% of total population)                                        World Bank (2011–2017)               0.85
           Prevalence of undernourishment (% of population)                                World Bank (2015e)                   0.82
           Literacy rate, adult total (% of people ages 15 and above)                      World Bank (2015d)                   0.80
           Prevalence of conflict and/or insecurity (crime and theft, index: 0–30)         World Bank (2017a)                   0.76
           Proportion of population living below the national poverty line (%)             SDG indicators (2015–2017)           0.75
           Access to improved water sources (% of total population with access)            World Bank/FAO (2015a)               0.66
           DALYs (disability-adjusted life years; DALYs per 100 000; rate)                 GBD (2016)                           0.65
           GINI index                                                                      World Bank (2017b)                   0.64
           Insecticides and pesticides used (t ha−1 )                                      FAO (2016b)                          0.63
           Gender inequality index                                                         UNDP (2018)                          0.62
           Electricity production from hydroelectric sources (% of total)                  World Bank (2015b)                   0.62
           Unemployment, total (% of total labor force; national estimate)                 World Bank (2017)                    0.60
           Dependency ratio (population ages 15–64 – % of total population)                World Bank (2011–2016)               0.60
           Population using at least basic sanitation services (%)                         WHO (2015)                           0.60
           Healthy life expectancy (HALE) at birth (years)                                 WHO (2014)                           0.56
           Ecological susceptibility (ECO_SUS)
           Average land degradation in GLASOD erosion degree                               FAO (1991a)                          0.92
           Fertilizer consumption (kilograms per hectare of arable land)                   World Bank (2015c)                   0.74
           Average soil erosion                                                            FAO (1991b)                          0.72
           Terrestrial and marine protected areas (% of total territorial area)            World Bank (2016–2017)               0.63
           Lack of coping capacity (COP)
           Saved any money in the past year (% age 15+)                                    Global FINDEX (2014–2017)            0.87
           Government effectiveness: percentile rank                                       World Bank (2017)                    0.85
           Total dam storage capacity per capita. Unit: m3 per inhab.                      FAO (2017)                           0.82
           Total renewable water resources per capita (m3 per inhab. per year)             FAO (2014)                           0.76
           Corruption perception index (CPI)                                               Transparency International (2017)    0.68
           Travel time to cities ≤ 30 min (population; %)                                  JRC (2015)                           0.65
         ∗ Derived from a global expert survey (Meza et al., 2019).

assessing future risk scenarios and less relevant to current                     et al. (2014) in cases where the r value lay between −1.0
risk, indicators related to adaptive capacity and indicators                     and −0.9 or 1.0 and 0.9 using a Spearman correlation ma-
that could be measured with the same data source due to the                      trix and scatter diagram for visual interpretation. Following
similarity in what they represent were removed. For instance                     suggestions by Roth et al. (1999), Peng et al. (2006) and En-
agriculture (% of GDP) and dependency on agriculture for                         ders (2003), listwise and pairwise deletion thresholds were
livelihood (%) were averaged into one income indicator, and                      selected when > 30 % of data were missing on a country
the variables GDP per capita (PPP – purchasing-power par-                        level and when > 20 % of data were missing on the indicator
ity) and population below the national poverty line (%) both                     level. After the deletion, 168 countries and 26 indicators were
refer to poverty and therefore were also averaged to a com-                      considered for the final analysis. To detect potential outliers,
bined indicator. This resulted in a set of 26 indicators as part                 scatter plots and box plots for each indicator were created.
of the vulnerability assessment (Table 2).                                       Potential outliers were further examined using triangulation
   Following data acquisition, the data were preprocessed                        with other sources and past years. On this basis, outliers were
by transforming absolute to relative values and standardized                     identified in only one indicator (i.e., fertilizer consumption –
when necessary (e.g., travel time to cities ≤ 30 min – popu-                     kg ha−1 of arable land) and treated using winsorization fol-
lation, divided by the total population). Descriptive statistics                 lowing Field (2013). Multicollinearities were identified using
were used to evaluate the degree of missing data. The im-                        a Spearman correlation matrix for the different vulnerability
putation of missing values was done with data from previ-                        components (social susceptibility, environmental susceptibil-
ous years and using secondary sources following Naumann                          ity and a lack of coping capacity). Following the rule pro-

Nat. Hazards Earth Syst. Sci., 20, 695–712, 2020                                          www.nat-hazards-earth-syst-sci.net/20/695/2020/
I. Meza et al.: Global-scale drought risk assessment for agricultural systems 701
posed by Hinkle et al. (2003), any values higher than r > 0.9 impact data from the international Emergency Events
or smaller than r < −0.9 were considered very highly corre- Database (EM-DAT) of the Centre for Research on the Epi-
lated. The correlation was considered only if it was signifi- demiology of Disasters (CRED) using visual correlation
cant at the 0.05 level (two-tailed). Two indicators for the lack (Fig. 6). EM-DAT systematically collects reports of drought
of a coping-capacity component and two from social suscep- events and drought impacts from various sources, including
tibility (e.g., healthy life expectancy at birth – years – and UN agencies, NGOs, insurance companies, research insti-
disability-adjusted life) showed high and significant corre- tutes and press agencies. Here, the number of drought events
lations. However, no indicators were excluded on this basis within the period 1980–2016 was used as an input for the
due to the difference in concepts they represented and their comparison. Therefore, a drought event is registered in EM-
relevance at the global level. In order to render the indicators DAT when at least one of the following criteria applies: 10 or
comparable, the final selected indicators were normalized to more people are dead, 100 or more people are affected, or a
a range from 0 to 1 using min–max normalization (Naumann declaration of a state of emergency or a call for international
et al., 2014; Carrão et al., 2016): assistance is made.
Zi = Xi − Xmin /Xmax − Xmin , (3)
where Zi is the normalized score for each indicator score Xi . 3 Results
For variables with negative cardinality to the overall vulner-
ability the normalization was defined as This section presents the results of the global drought risk
assessment for agricultural systems (irrigated and rainfed) at
Zi = 1 − (Xi − Xmin /Xmax − Xmin ) . (4) the pixel level (Figs. 2 and 3) and for the total risk of both
systems combined at national resolution (Fig. 4). The dark-
Finally, the normalized indicator scores were aggregated into
red patterns show high levels of the different risk compo-
vulnerability components (SOC_SUS, ENV_SUS, COP) us-
nents, while dark blue reflects low scores of the different risk
ing weighted arithmetic aggregation based on (using the ex-
components.
ample of SOC_SUS)
X
SOC_SUS = Wi Zi , (5) 3.1 Drought risk for irrigated agricultural systems
where Wi is the weights for each normalized data set, and The drought risk for irrigated agricultural systems varies sig-
Zi is the weights as obtained from the global expert survey. nificantly among continents and countries. Especially large
Therefore, weights were normalized to add up to 1. The final countries such as the USA, Brazil, China and Australia show
indicators and their respective weights are listed in Table 2. a high variation at the country level due to varying climatic
The vulnerability components of socioecological susceptibil- conditions. Drought hazard and exposure was highest in re-
ity (SE_SUS) were combined using an average, which was gions with a high density of irrigated land and high irriga-
then combined with COP to obtain a final vulnerability in- tion water requirements such as the western part of the USA,
dex (VI) score: central Asia, northern India, northern China and southern
Australia. Vulnerability was high particularly in sub-Saharan
VI = V (SE_SUS) + V (COP)/2. (6) Africa but also in some countries in central Asia and the
The final drought risk index (DRI; Fig. 1) was calculated Middle East and low in general for industrialized and high-
by multiplying the indices for drought hazard and exposure income countries. The combination of hazard and vulnera-
by vulnerability. At the pixel level, the presence of hazard bility to risk resulted in the highest values for large parts of
and vulnerability point to a certain drought risk, independent western, central and southern Asia; eastern Africa; and the
of how much crop area is contained in the specific pixel. At eastern part of Brazil. Low-risk areas include western Eu-
the aggregated level, the different crop areas in the specific rope, the USA, Australia and most parts of China (Fig. 2).
pixels must be considered; therefore exposure was calculated
as harvested-area weighted mean of the pixel-level hazard 3.2 Drought risk for rainfed agricultural systems
and then multiplied by vulnerability to calculate drought risk
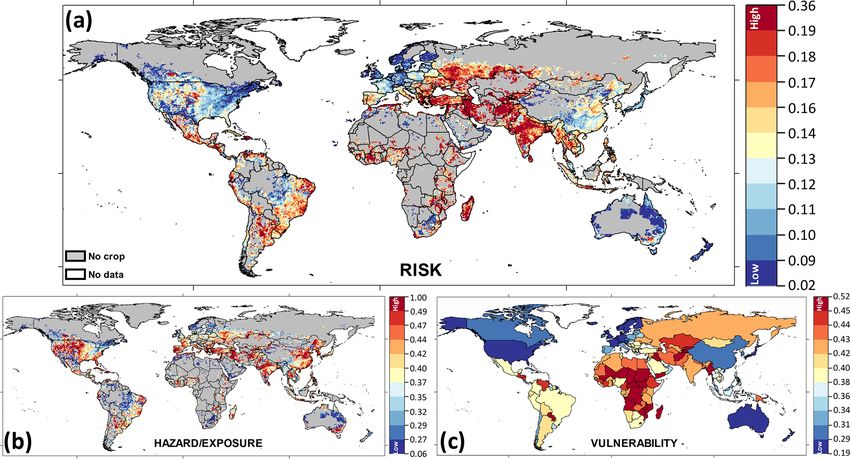
at the country level. High levels of risk (dark yellow to red color scheme) for
The total drought risk score for irrigated and rainfed sys- rainfed agricultural systems are observed in southern Africa,
tems combined (DRItot ) is derived by multiplying the expo- in southeastern Europe, in northern Mexico, in northeastern
sure of the whole cropping system Exptot (Eq. 2) by the VI. Brazil, at the western coast of South America, in southern
Russia and in western Asia. The vulnerability to drought
2.3 Comparison against drought impact data highlights the relevance to increasing the coping capacity
of the countries in order to reduce their overall drought
The outcomes of the risk assessment for irrigated and risk. For instance, Australia, despite being highly exposed to
rainfed systems combined (DRItot ) were compared against drought hazard, has low socio-ecological susceptibility and
www.nat-hazards-earth-syst-sci.net/20/695/2020/ Nat. Hazards Earth Syst. Sci., 20, 695–712, 2020702 I. Meza et al.: Global-scale drought risk assessment for agricultural systems
Figure 2. Drought risk (a), hazard and exposure (b), and vulnerability (c) for irrigated agricultural systems. The legends were defined
by assigning the median of the value distribution to the yellow color in the center, the 90th percentile to the deepest red color and the
10th percentile to the deepest blue color and by determining the class ranges of the other colors by linear interpolation. Risk was directly
calculated by multiplying hazard and exposure by vulnerability (pixel-level analysis).
high enough coping capacities to considerably reduce the of drought to both farming systems are Botswana, Namibia
overall drought risk. and Zimbabwe (Figs. 2 and 3). These countries share the
same relevant indicators that define their high vulnerability:
3.3 Drought risk for agricultural systems (irrigated a high soil and land degradation rate, a low literacy rate and
and rainfed combined) low total renewable water (Fig. S3). Table 3 shows the top
and bottom 10 countries with the highest and lowest total
The hazard and exposure maps shown in Fig. 4 are slightly drought risk (DRItot ) as well as their hazard and exposure
different to the ones shown in Figs. 2 and 3 due to the aggre- and vulnerability scores.
gation at the country level. The analysis shows that regions Seven out of the 10 countries with the highest overall
with low hazard and exposure of rainfed and irrigated crops drought risk are located on the African continent. However,
to drought tend to be tropical and subarctic regions following Kosovo, East Timor and Kazakhstan also possess high risk
the Köppen–Geiger climate classification (1980–2016; Beck levels (Table 3). Zimbabwe ranks as the country with the
et al., 2018). There are significant regional differences when highest drought risk, mainly due to its high exposure com-
comparing irrigated and rainfed drought hazard and expo- bined with its high vulnerability (Fig. S1 in the Supplement).
sure. For instance, the northern parts of Latin America and In general, the countries that present higher drought risk
central Africa have low hazard and exposure levels, given have a high amount of exposed crops. Vulnerability varies
the humid climate conditions resulting in a low total risk, among them, with Zimbabwe being the country with the
even though those regions are characterized by high vulnera- highest vulnerability. The lack of coping capacity and socioe-
bility levels. Southern Africa, however, has a high amount of cological susceptibility were determinant factors for coun-
drought-exposed rainfed crops but lower vulnerability com- tries like Botswana and Zimbabwe (Fig. S1). There were
pared to other African countries. Despite this, risk scores in cases where countries such as Namibia presented high socio-
that region are very high. Very high drought hazard and ex- ecological susceptibility in contrast with high coping capac-
posure and vulnerability levels can be found in the Middle ity, reducing its overall vulnerability. The drought risk in
East and northern Africa. countries such as Lesotho and Mauritania that have, in con-
Although the drought hazard was computed differently for trast, limited coping capacities is notably higher (Fig. S1).
the different agricultural systems, the countries with high risk The analysis also reveals that, although risk is currently close
Nat. Hazards Earth Syst. Sci., 20, 695–712, 2020 www.nat-hazards-earth-syst-sci.net/20/695/2020/I. Meza et al.: Global-scale drought risk assessment for agricultural systems 703 Figure 3. Drought risk (a), hazard and exposure (b), and vulnerability (c) for rainfed agricultural systems. The legends were defined by assigning the median of the value distribution to the yellow color in the center, the 90th percentile to the deepest red color and the 10th per- centile to the deepest blue color and by determining the class ranges of the other colors by linear interpolation. Risk was calculated by multiplying hazard and exposure by vulnerability (pixel-level analysis). Figure 4. Drought risk (a), hazard and exposure of irrigated crops (b), rainfed crops (c) and the whole crop production sector (d). The legends were defined by assigning the median of the value distribution to the yellow color in the center, the 90th percentile to the deepest red color and the 10th percentile to the deepest blue color and by determining the class ranges of the other colors by linear interpolation. Risk was calculated by multiplying hazard and exposure by vulnerability, as shown in Figs. 2c and 3c. www.nat-hazards-earth-syst-sci.net/20/695/2020/ Nat. Hazards Earth Syst. Sci., 20, 695–712, 2020
704                                                  I. Meza et al.: Global-scale drought risk assessment for agricultural systems

Table 3. Rank of countries with the highest and lowest risk of drought for combined agricultural systems (rainfed and irrigated).

             Country                      Drought       Risk                 Hazard and exposure                  Vulnerability
                                              risk      score   Haz. and exp.    Haz. and exp.   Haz. and exp.        score
                                         (country       total     irrigated        rainfed           total
                                            rank)
             Zimbabwe                           1      0.871       0.967             1.885           1.804            0.483
             Namibia                            2      0.846       0.769             2.122           2.061            0.411
             Botswana                           3      0.811       0.466             2.095           2.076            0.391
             Morocco                            4      0.786       0.774             2.172           1.873            0.419
             Kosovo                             5      0.728       0.936             1.871           1.854            0.393
             East Timor                         6      0.701       0.971             1.882           1.854            0.378
             Mauritania                         7      0.692       0.886             1.670           1.580            0.438
             Lesotho                            8      0.692       0.840             1.562           1.556            0.445
             Kazakhstan                         9      0.670       0.974             1.573           1.499            0.447
             Algeria                           10      0.636       0.969             1.595           1.492            0.426
             Guatemala                        158      0.039       0.857             0.026           0.087            0.446
             The Gambia                       159      0.037       0.760             0.093           0.094            0.394
             Belize                           160      0.035       0.943             0.079           0.093            0.375
             Sierra Leone                     161      0.023       0.934             0.005           0.057            0.402
             Brunei                           162      0.020       0.741             0.000           0.077            0.254
             Guinea                           163      0.019       0.822             0.033           0.042            0.452
             Switzerland                      164      0.017       0.695             0.046           0.068            0.247
             Guinea-Bissau                    165      0.017       0.723             0.026           0.042            0.401
             Fiji                             166      0.011       0.833             0.017           0.033            0.329
             Central African Republic         167      0.008       0.646             0.016           0.016            0.505

to zero in several countries (e.g., Fiji, Central African Re-              tions, with irrigated crops being cultivated in the more arid
public, Guinea-Bissau, etc.), this could rapidly change once               parts of the country and rainfed crops being cultivated in
these countries are affected by droughts given their very high             more humid parts. In addition, aquatic crops with high water
vulnerability.                                                             demand, such as rice and sugarcane, are the most commonly
   The comparison of the drought risks of rainfed and irri-                cultivated irrigated crops in these countries (Frenken, 2005).
gated cropping systems (Fig. 5) shows that several countries
such as Zimbabwe, Iraq and Algeria are exposed to high risk                3.4   Comparison
for both cropping systems. These countries are frequently hit
by drought and similarly have a high vulnerability to drought              The comparison of drought risk (DRItot ) with drought events
(Figs. 2 and 3). In contrast, countries such as Switzerland,               registered in EM-DAT shows good agreement in many coun-
Finland and New Zealand are characterized by low drought                   tries. For countries which have low drought risk, such as the
hazard and exposure of irrigated and rainfed systems and low               countries in tropical Africa, northern and western Europe,
vulnerability to drought (Figs. 2 and 3). In countries such                or the northern part of South America, there are either no
as Botswana, Oman and the United Arab Emirates, drought                    droughts or just one drought registered in EM-DAT (Fig. 6a
risk is high for rainfed cropping systems but low for irrigated            and b). There is also good agreement for countries in south-
cropping systems (Fig. 5). These countries are defined by                  ern Africa and some countries in the African transition zone
arid climate conditions, exposing rainfed crops to high risk,              with very high drought risk and many registered drought
while the drought risk for irrigated cropping systems is low               events and for countries with intermediate drought risk, such
because of relatively low interannual variability in climatic              as Canada, Australia or Italy. However, some disagreement
conditions resulting in low variability in the irrigation wa-              between calculated risk and the number of reported drought
ter requirement and streamflow. Their risk is also determined              events is acknowledged. For instance, Brazil does not show
by their different vulnerability dynamics (e.g., hydroelectric             high agreement between EM-DAT and the country risk level,
sources, retaining renewable water). In contrast, drought risk             even though the eastern part of the country presents a high
for irrigated cropping systems is high and drought risk of                 risk for irrigated and rainfed systems (Figs. 2 and 3), and
rainfed cropping systems is small in countries such as Burk-               the total drought risk level is affected by the other regions
ina Faso, Madagascar and Côte d’Ivoire (Fig. 5). In these                  with lower risk in the country. The same occurs in other
three countries, there is a big variability in climatic condi-             large countries such as the USA, Russia, China and India,

Nat. Hazards Earth Syst. Sci., 20, 695–712, 2020                                    www.nat-hazards-earth-syst-sci.net/20/695/2020/
I. Meza et al.: Global-scale drought risk assessment for agricultural systems 705 Figure 5. Country profiles contrasting the drought risk of irrigated and rainfed agricultural systems. The size of the bubbles indicates the crop growing area (sum of rainfed and irrigated areas per country in Mha. Figure 6. Comparison of total risk against drought impact data. where the calculated drought risk is low or intermediate, al- drought risk such as the central part of the USA, northeast- though a large number of drought events have been regis- ern Brazil, northern China and northwestern India are com- tered in EM-DAT. The reason for this disagreement is that plemented by other regions of low drought risk (Fig. 6a). the risk shown in Fig. 6a is representative of the whole coun- Therefore, the high number of registered drought events in try, while drought events which only have local or regional EM-DAT is corroborated by the presence of high regional impacts are also registered in EM-DAT (see Sect. 2.3). For all drought risk (Figs. 2 and 3). these big countries, we detected considerable spatial hetero- geneity with regard to drought risk, where regions with high www.nat-hazards-earth-syst-sci.net/20/695/2020/ Nat. Hazards Earth Syst. Sci., 20, 695–712, 2020
706                                            I. Meza et al.: Global-scale drought risk assessment for agricultural systems

4   Discussion                                                     most countries is either predominantly irrigated or predomi-
                                                                   nantly rainfed. We account for this by calculating total crop
The present study performs, for the first time, a separate         exposure to drought (Fig. 4d) as the harvested-area weighted
global drought risk analysis for irrigated and rainfed crop-       mean of the exposures of irrigated crops (Fig. 4b) and of the
ping systems, including regions that indicate a high vulner-       rainfed crops (Fig. 4c). Our attempt to calculate hazard, ex-
ability to droughts and are particularly exposed. In previous      posure and risk for the whole crop production sector by as-
assessments, the share of irrigated cropland was either ig-        signing a similar weight to the hazard exposures for rainfed
nored or considered to be a vulnerability indicator (Carrão        and irrigated systems must be viewed critically, and results
et al., 2016). The drought hazard analysis is based on three       should be analyzed with care. A potential way to derive spe-
indicators: SH, IH and CH_RfAg, which quantify drought as          cific weights for rainfed and irrigated exposure could be val-
a deviation from normal conditions consistent with common          idating not only calculated hazard and exposure but also vul-
definitions. In agreement with the results for drought hazard      nerability and risk, with information about drought impacts
obtained by Carrão et al. (2016), the largest drought hazard is    separately, for both irrigated and rainfed systems. A lack of
obtained for arid and semi-arid regions such as northern and       data for drought impacts distinguishing rainfed and irrigated
southern Africa, northern Mexico, along the coastline of Peru      systems was the main reason why this approach was not im-
and Chile, the Arabian Peninsula, and Mongolia for rain-           plemented for the current study.
fed systems; Italy, Turkey and western Mexico for irrigated           The calculation of the drought hazard of irrigated crop-
systems; and the western USA, northeastern Brazil, west-           ping systems in this study is based on the two components
ern Argentina, central Asia, the Middle East, western India,       SH and irrigation IH reflecting the water supply and water
northern China and southern Australia for both irrigated and       demand, respectively, of irrigated systems. Therefore we do
rainfed systems. In contrast, previous studies based on stan-      not consider specifically in our approach the availability and
dardized indices such as the standardized precipitation index      use of groundwater resources for irrigation. It is well known
(SPI) have detected the highest drought hazard mainly in hu-       that dynamics in streamflow are usually larger than dynamics
mid regions such as central Europe, southeastern Asia, south-      in groundwater storage so that groundwater is used by many
ern Brazil and tropical Africa (Geng et al., 2016). The reason     farmers to substitute temporary deficits in surface water sup-
for this difference could be that deviations from normal con-      ply for irrigation systems. In general, access to groundwa-
ditions should not be treated similarly for arid and humid         ter should therefore be considered to reduce drought hazard
regions, as not every precipitation or streamflow deficit in       and vulnerability of irrigated cropping systems. Considera-
humid regions will automatically become a hazard for crop-         tion of groundwater resources would, however, require dy-
ping systems. In fact, in humid regions, crops often perform       namic quantification of groundwater storage and groundwa-
better in relatively dry years (Holzkamper et al., 2015). We       ter levels, which is challenging for global-scale analyses and
account for these effects by normalizing streamflow deficits       not possible with the models applied in this study. In addi-
with long-term mean annual river discharge (SH) or by cal-         tion, more conceptual work is needed to decide which de-
culating the probability of reductions in the AET / PET ratio      gree of temporal variability in groundwater levels constitutes
of rainfed crops in relative terms (CH_RfAg).                      a hazard and how to treat long-term depletion of groundwater
   In the present study, the rainfed hazard is computed as the     resources (negative trends) in drought risk studies.
probability of a 10 % decline in the AET / PET ratio com-             The multi-dimensional nature of vulnerability of agricul-
pared to long-term mean conditions, whereas the irrigated          tural systems is represented by a set of 26 expert-weighted
drought hazard represents the combination of severity and          indicators. One of the major limitations of this data-driven
frequency values derived from the streamflow or irrigation         approach is the spatial detail information for computing the
water requirement (see Sect. 2). While the methodology re-         model; however, at a global level it is not feasible to get
flects the common understanding of the factors most influ-         a harmonized data set of all the proxy variables, but some
ential for drought hazard in the two cropping systems well,        caution must be advised when zooming in at the subnational
a direct numerical comparison of the calculated hazard for         level (Naumann et al., 2018). When interpreting the results,
rainfed and irrigated systems is not meaningful. The hazards       it is necessary to consider that some highly correlated indi-
and exposure calculated in this study should be used to rank       cators were maintained in the analysis, as they present differ-
or compare countries within the rainfed or irrigated domain        ent drivers of vulnerability and hence different entry points
but not in between. The reasoning for the calculation of the       for vulnerability reduction. The selected indicators comprise
total exposure and risk in this study was less to support com-     social, economic, environmental, physical and governance-
parisons across countries but more to account for the differ-      related factors contributing to socioecological susceptibility
ent extent of irrigated and rainfed systems within the specific    and the lack of coping capacity. In doing so, the present study
countries. There are countries in which crop production is         goes beyond existing global drought risk assessments (Car-
completely rainfed and countries in which all crops are irri-      rão et al., 2016), which are based on equal weights and do
gated so that only the risk for the rainfed or irrigated systems   not consider relevant environmental vulnerability indicators
is relevant. Aside from these extremes, crop production in         to be a driver of drought risk. The latter, however, is relevant

Nat. Hazards Earth Syst. Sci., 20, 695–712, 2020                            www.nat-hazards-earth-syst-sci.net/20/695/2020/
I. Meza et al.: Global-scale drought risk assessment for agricultural systems 707 when assessing drought risk for agricultural systems, where Despite these advancements, the presented analysis does factors such as land degradation and soil erosion are shown have limitations. First, due to the lack of up-to-date land use to exacerbate drought risk (Hagenlocher et al., 2019). In fu- data on irrigated vs. rainfed agriculture at the global scale, ture assessments an alternative to the expert-based weight- the exposure analysis is based on MIRCA data from the ing of vulnerability indicators chosen here could be the use year 2000 (Portmann et al., 2010). Given that cropping sys- of statistical approaches (e.g., principal component analysis tems are subject to change, this adds uncertainty to the re- – PCA) to identify relevant indicators. However, given the sults. Second, data used for the vulnerability analysis stem high number of experts who participated in the weighting ex- from different sources, which makes it difficult to evaluate ercise (n = 78) the expert-based approach seems more suit- the inherent uncertainties in the data. Third, the data are not able for identifying relevant indicators when compared to an consistently available for all countries for the same years (Ta- approach that builds on statistical significance only. Further, ble 2). Fourth, the vulnerability analysis is based on nation– Hagenlocher et al. (2013) evaluated the outcomes of PCA- state-resolution data, which do not allow for mapping spa- based and expert-based indicator choice on a composite vul- tial variability in vulnerability at the subnational level. Fifth, nerability index and did not find major differences. applying expert opinions to weight drought vulnerability in- The findings of the drought risk assessment presented here dicators according to their relevance brings subjectivity to correspond to a certain degree to the findings of Carrão et the assessment, which necessitates a strong network of rele- al. (2016). Although the focus of the current paper is more vant experts. Sixth, preventive or adaptive planning requires explicitly on agriculture, both studies present methodolog- going beyond evaluating drivers of risk and mapping current ical similarities. In Carrão et al. (2016) the percentage of patterns of risk. Future scenarios of drought risk, considering crop land per grid cell is one factor in the exposure analy- both changing environmental and climate conditions as well sis, and the percentage of irrigated agricultural land is one as possible future socioeconomic development pathways, are of the vulnerability factors. Although Carrão et al. (2016) needed in order to anticipate future challenges. include other factors such as population density, livestock Future research should address these challenges by also in- density and baseline water stress in the analysis, the results vestigating subnational patterns in vulnerability and develop- give a high weight to the risk for agriculture. In both studies ing future drought risk scenarios in all dimensions of drought the regions less affected by droughts correspond to the re- hazards, exposure and vulnerability. In addition, attempts to gions with little or no exposure of agriculture and population investigate changes and trends in drought risk and risk com- (e.g., deserts and tropical forests). This is mainly the case ponents are highly needed to better understand trajectories of in Amazonia and central Africa. Also, similarities between drought risk in different countries and for the whole world. areas of high levels of risk are evident, including southern Further, inherent uncertainties, as well as the sensitivity of and eastern Europe, the Eurasian steppe, northern Africa and the risk assessment outcomes towards changes in the input the Middle East, northeastern Brazil, and southeastern South parameters (e.g., indicator choice and weighting), should be America. investigated and validated statistically. This gap has also been Similarities are also found for the risk of irrigated agri- highlighted in a recent review of climate vulnerability assess- cultural systems. Examples are irrigated croplands in India, ments (de Sherbinin et al., 2019) in general as well as in a re- the US and Australia. Differences in the overall patterns are cent review of drought risk assessments (Hagenlocher et al., due to the separation of irrigated and non-irrigated agricul- 2019) in particular. ture in the current study and the aggregated exposure infor- The comparison conducted in this study has shown that mation in Carrão et al. (2016). In an updated version of the there are limited data available on agricultural losses and im- risk map from Carrão et al. (2016), using a higher-resolution pacts caused by droughts at the global level. Furthermore, population database and grid-level exposure information, as impacts are not always direct, as droughts can have cascad- shown in Vogt et al. (2018, Fig. 7), similarities are even more ing indirect impacts (Freire-Gonzáles et al., 2017; Van La- evident. nen et al., 2017) which are difficult to assess. In addition, for However, the present study includes a spatially explicit countries where we find high drought risk (e.g., Mongolia, model of AET for the main crop types of two different Iran, Kazakhstan and the countries in southeastern Europe), agricultural systems (irrigated and rainfed agriculture) and no or very few drought events are registered in EM-DAT. includes a specialized vulnerability index for this sector The reason for this mismatch could be that drought events according to expert judgment. These differences revealed in these countries were not registered in EM-DAT. For exam- the importance of focusing more clearly on distinct im- ple, in Romania, EM-DAT reports two drought events, while pacts (e.g., on irrigated vs. rainfed systems) when conduct- according to other reports, 12 years between 1980 and 2012 ing drought risk assessments, even within the same sector. were classified as drought years, with 48 % of the agricultural For instance, irrigated agricultural systems in Latin Amer- land affected (Lupu et al., 2010; Mateescu et al., 2013). On ica are highly exposed to droughts, whereas the probability top of this, in Iran, EM-DAT reports one drought event while of droughts occurring in rainfed agricultural systems in that other sources recounted several droughts during 1980–2005, region is comparably low. with the most extreme drought lasting for 4 years, from 1999 www.nat-hazards-earth-syst-sci.net/20/695/2020/ Nat. Hazards Earth Syst. Sci., 20, 695–712, 2020
You can also read