EMISSION PATHWAYS TO REACH 2 C TARGET - MODEL RESULTS AND ANALYSIS
←
→
Page content transcription
If your browser does not render page correctly, please read the page content below
Swiss Federal Office for the Environment (FOEN)

EMISSION PATHWAYS TO
REACH 2°C TARGET
MODEL RESULTS AND
ANALYSIS
Final Report
Zurich, 23 April 2012

Dr. Jürg Füssler, Martin Herren, Madeleine Guyer (INFRAS),
Joeri Rogelj and Prof. Dr. Reto Knutti (ETHZ)

The Swiss Federal Office for the Environment (FOEN) has funded the elabo-
ration of this study that it considers as a valuable contribution to the debate
on future greenhouse gas emission pathways. However, the FOEN does not
necessarily endorse all the information, analyses, views and comments pre-
sented in this study that are the sole responsibility of the authors..

                                                                                  INFRAS

                                                                                  BINZSTRASSE 23
                                                                                  POSTFACH
                                                                                  CH-8045 ZÜRICH
INSTITUTE FOR ATMOSPHERIC AND                                                     t +41 44 205 95 95
CLIMATE SCIENCE                                                                   f +41 44 205 95 99
ETH ZURICH                                                                        ZUERICH@INFRAS.CH

UNIVERSITAETSTRASSE 16                                                            MÜHLEMATTSTRASSE 45
CH-8092 ZURICH                                                                    CH-3007 BERN

WWW.IAC.ETHZ.CH                                                                   WWW.INFRAS.CH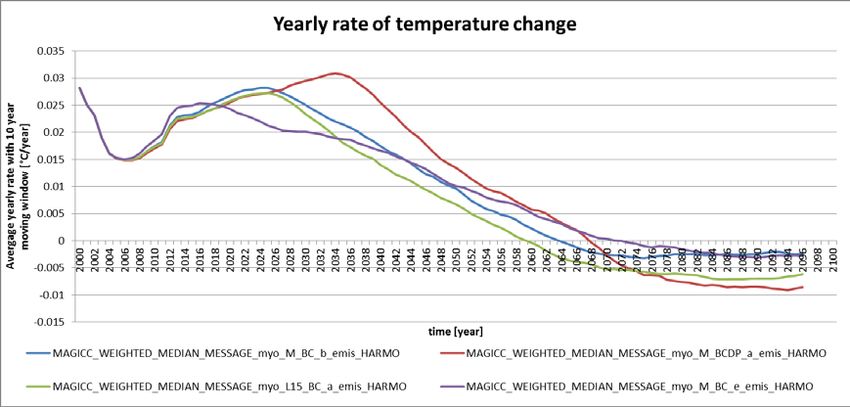
2|

CONTENT

Acknowlegements ___________________________________________________ 3
Executive Summary __________________________________________________ 3
1.       Introduction __________________________________________________ 9
Part I: International negotiations and approaches to burden sharing ________ 10
2.       Stocktaking of policy and science status _________________________ 10
2.1.     The state of negotiations __________________________________________ 10
2.2.     The state of science _____________________________________________ 13
3.       Approaches to burden sharing __________________________________ 14
Part II: Modelling of emission pathways ________________________________ 18
4.       Model results: global emission pathways _________________________ 18
4.1.     Characteristics of global emission pathways___________________________ 18
4.2.     Global temperature projections _____________________________________ 24
5.       Model results: burden sharing – country (-group) level ______________ 26
5.1.     Burden sharing between Annex I and non-Annex i countries ______________ 26
5.2.     Burden sharing results for specific contries____________________________ 30
5.2.1. Burden sharing appraoches on country level __________________________ 30
5.2.2. Discussion of selected countrie’s pathways ___________________________ 33
Part III: Synthesis and conclusions ____________________________________ 40
6.       Synthesis and conclusions _____________________________________ 40
Annex I Pledges of Annex I countries __________________________________ 44
Annex II Additional data and model results _____________________________ 47
Acronyms _________________________________________________________ 57
References ________________________________________________________ 58

INFRAS | 23 April 2012 | CONTENT
|3

ACKNOWLEGEMENTS

The authors would like to thank the Swiss Federal Office for the Environment (FOEN) for fi-
nancial support for this study and for fruitful discussions and inputs. We would also like to
thank the members of the Swiss Delegation and OcCC who provided valuable comments and
inputs into this project point as well as the research community that develops and maintains the
incredibly useful suite of models used – in particular the MESSAGE integrated assessment
model (IAM) operated at IIASA and the reduced-complexity climate system and carbon-cycle
model MAGICC v.6.

EXECUTIVE SUMMARY

The present study aims at contributing to the discussion about identifying a global goal for sub-
stantially reducing global emissions by 2050 and […] a timeframe for global peaking of green-
house gas emissions, a key issue tabled by the Cancun Agreements (2010) that was discussed at
COP/MOP 17 in Durban. It builds on earlier studies on pathways (INFRAS 2008, 2010).

1. GLOBAL PATHWAYS TO 2°C
This modelling work analyses different pathways of global greenhouse gas emissions that are
consistent with the 2°C target of the Cancun Agreements (2010). The analysis with an Integrated
Assessment Model allows to calculate for a given emissions pathway the related least cost ener-
gy technology mix. For instance, the prescription of declining greenhouse gas emissions leads to
a shift from coal and natural gas based power generation to renewables, energy efficiency and
carbon capture and storage compared to the reference scenario.

Not raising the ambition of the 2020 pledges will make reaching the 2°C much more diffi-
cult and costly
Our preliminary modelling results indicate that with the current ambitions of the party’s 2020
pledges it will be much more difficult (and costly) to reach the 2°C target than if substantial
mitigation action is already taken up by all countries and sectors before 2020. The required tran-
sition to low carbon economies is difficult; without raising the ambitions significantly, the 2°C
goal will be even more difficult to achieve. These findings are in line with similar results in the
UNEP GAP report (2010).

INFRAS | 23 April 2012 | EMISSION PATHWAYS TO REACH 2 C TARGET | INTRODUCTION
4|

Rapid emission reduction in Annex I and swift integration of non-Annex I countries into
global mitigation action is instrumental in reaching the 2°C target
Our modelling of pathways indicate that even if Annex I (developed) countries would take swift
action to rapidly reduce GHG emissions in the next decades, the 2°C target cannot be reached if
non-Annex I (developing) countries do not participate soon in mitigation action but keep follow-
ing a business-as-usual emissions pathway until 2030.
The results suggest that the room for manoeuvre is narrow. The 2°C target can only be met with
likely probability if the integration of non-Annex I countries into international mitigation action
can be achieved rather sooner than later. This is in line with the findings of the UNEP Gap re-
port (UNEP 2010).

2. BURDEN SHARING
The work on emissions pathways on a global level identifies the need for very strong cuts in
global emissions over the next decades in line with IPCC (2007a). The question on how to share
this large global burden in emission cuts between different countries is primarily a political one.
Science can only seek to provide relevant data that may feed into the political decisions taking
process. The overarching principle of burden sharing is laid down in the Convention (UNFCCC
1992 Art.3): Action should be taken by all countries on the basis of equity and in accordance
with their common but differentiated responsibilities and respective capabilities, with Annex I
countries taking the lead.
    The aim of the present modelling work on burden sharing is to illustrate on a conceptual
level how different quantitative burden sharing algorithms lead to different emission reduction
pathways for countries. Please note that these pathways are subject to high uncertainties and
depend heavily on the assumptions made in the modelling. The selection of burden sharing ap-
proaches and their operationalization in the model is by no means comprehensive and should be
regarded as an illustrative exercise in the quantitative analysis in burden sharing approaches. It
is by no means a proposal for actual burden sharing between countries.

INFRAS | 23 April 2012 | EMISSION PATHWAYS TO REACH 2 C TARGET | INTRODUCTION
|5
The following burden sharing approaches in line with the 2°C target are considered:
BURDEN SHARING APPROACHES
Approach Curve Description of implementation (simplified, see section 3)
Indian proposal 2008 INDPRO A developing country has to start mitigation action as soon as
it reaches average per capita emissions or a GDP per capita
of 20’000 USD.
Equal cumulative per CPC1990 The approach assigns for every country equal cumulative per
capita emissions capita emissions between 1990 and 2100.
Responsibility-Capacity RCI A country’s share in mitigation efforts is proportional to the
Indicator Responsibility-Capacity-Indicator. The indicator is composed
of ¾ “polluter pays” (i.e. per capita emissions over last 10
years) and ¼ “ability to pay” (i.e. per capita GDP)
Table 1 Considered approaches to share the burden of emission reductions between countries (see section 3).
All approaches are consistent with reaching the 2°C target.
The following figure summarizes the main results of the comparison of the three burden sharing
approaches:
COMPARISON OF ANNEX I AND NON-ANNEX I PATHWAYS
60000000
50000000
40000000
INDPRO - NAI
GHG Emissions [Gg CO2eq]
CPC1990 - NAI
30000000 RCI - NAI
BAU - NAI
INDPRO - AI
20000000 CPC1990 - AI
RCI - AI
BAU - AI
10000000
0
1950 2000 2050 2100
-10000000
Figure 1 Global emission pathways for Annex I (AI – developed countries; solid lines) and non-Annex I coun-
tries (NAI – developing countries, dashed lines) for different burden sharing approaches: Indian Proposal 2008
(INDPRO), Cumulative per capita emissions since 1990 (CPC1990), RC-Indicator (RCI) and Reference scenar-
io (BAU). All Kyoto-Gases considered excluding LULUCF. Please note that results are preliminary and for
illustrative purposes only.
INFRAS | 23 April 2012 | EMISSION PATHWAYS TO REACH 2 C TARGET | INTRODUCTION6|
Developed countries have to rapidly reduce their emissions
The model results show that in the Indian Proposal as well as in the RC-Indicator approach,
developed countries (Annex I) have to reduce emissions by -85% and -82%, respectively by
2050 (solid yellow and red lines in Figure 1). For individual countries, this rate can go down to
lower rates (see Table 2). With the equal cumulative per capita emissions approach the alloca-
tion for developed countries goes even negative over many years (solid dark green lines in Fig-
ure 1 and Table 2).
Developing countries on average have to (stabilize and) reduce their emissions
The emission allocations resulting from the considered burden sharing approaches require also
for average developing countries emission allocation to steadily decrease over the 21st century
(with the equal per capita emission approach allowing for a period of stabilisation, followed by
emission reduction).
The following Table 2 provides examples of results for different countries.
EXAMPLES OF COUNTRY PATHWAYS
Country (or country group) Emissions 2050/1990
INDPRO CPC1990 RCI
Examples Developed Countries
Japan 16% -30% 4%
Russia, Ukraine, Belarus 7% -29% 24%
USA 12% -51% 20%
Western Europe (including Switzerland) 18% -19% 9%
Examples Developing Countries
China 68% 15% 136%
India 291% 651% 189%
Oil exporting middle Eastern countries plus Libya 56% -19% 135%
Sub-Saharan Africa 292% 882% 165%
Table 2 Example results for some developed and developing countries. Percentages provide CO2eq Emissions
in 2050 as percentage of 1990 Emissions for different burden sharing approaches: Indian Proposal 2008
(INDPRO), Cumulative per capita emissions since 1990 (CPC1990), RC-Indicator (RCI). Please note that re-
sults are preliminary and for illustrative purposes only.
INFRAS | 23 April 2012 | EMISSION PATHWAYS TO REACH 2 C TARGET | INTRODUCTION|7
Our modelling results show the following main characteristics of burden sharing approaches:
1. The Responsibility-Capacity-Indicator approach leads to less stringent emission reduc-
tion requirements for high emitting developing countries and a higher burden for low-
emitting developing countries
The direct comparison of the implemented versions of burden sharing approaches indicate that
the linear approach of the RC-Indicator leads to significantly less stringent emission reduction
requirements for high emitting developing countries like China than the Indian proposal with its
threshold approach, but put a higher burden to developing countries with low per capita emis-
sions and high population growth rates (such as India and Sub-Saharan Africa) in particular in
the first half of the 21st century.
2. The Indian proposal reflects different responsibilities and abilities
The Indian proposal allows developing countries with low per capita emissions and high popula-
tion growth rates (such as India and Sub-Saharan Africa) for significant increases in their emis-
sion allocation. One might argue that this is more in line with the principle of equal rights to
development. From this perspective, the Indian proposal might seem more adequate to reflect
the different responsibilities and abilities of countries to contribute to climate change mitigation
than the RC-Indicator approach.
3. Burden sharing based on equal cumulative per capita emissions: It seems not obvious
how this approach could be implemented
For developing countries the approach leads on average to larger emission allocations than the
two other approaches, in particular for countries with low per capita emissions and projections
of strong population growth (e.g. India and Sub-Saharan Africa). Much more stringent emission
reduction pathways (with net negative emissions in some years) result for high emitting devel-
oping countries such as China.
From a practical point of view it seems less obvious how such a burden sharing with very
substantial net negative emission allocations for developed and advanced developing countries
could be implemented. This difficulty would become even more pronounced if earlier years than
the chosen base year 1990 would be considered.
Please note that these conclusions may only be valid for the implemented version of the burden
sharing approaches. Other ways of their operationalization may lead to different conclusions.
INFRAS | 23 April 2012 | EMISSION PATHWAYS TO REACH 2 C TARGET | INTRODUCTION8|
Further work is needed to analyse and understand the impact of burden sharing ap-
proaches on country’s emission pathways
The present study analyses different emission pathways for the 2°C target and illustrates some
characteristics of different burden sharing approaches. The work also identified several short-
comings of the considered approaches and the need for further analysis, including the refinement
of existing burden sharing approaches, analysis of new and more variants of burden sharing
approaches etc.
We hope that in parallel to the scientific work done on this important topic the international
negotiations process progresses and converges towards implementing actual quantitative emis-
sion limitations and restrictions for all relevant parties.
INFRAS | 23 April 2012 | EMISSION PATHWAYS TO REACH 2 C TARGET | INTRODUCTION|9
1. INTRODUCTION
The present study aims at contributing to the discussion about identifying a global goal for sub-
stantially reducing global emissions by 2050 and […] a timeframe for global peaking of green-
house gas emissions as requested by the Cancun Accord (2010) for COP/MOP 17. It builds on
earlier studies on possible pathways that focussed on one approach to burden sharing, the so
called “Indian Proposal” (INFRAS 2008, 2010). The present study seeks to expand this work
and in particular looks at several different burden sharing approaches and their impact on coun-
tries emissions pathways. Also, this work builds on a new partnership between INFRAS and the
Institute for Atmospheric and Climate Science at ETH Zurich which is responsible for the mod-
elling work, in particular with the MESSAGE integrated assessment model (IAM) and the re-
duced-complexity climate system and carbon-cycle model MAGICC v.6.
Part I provides a short overview of the current status in policy and science (section 2) and
discusses different approaches to burden sharing (section 3). Part II presents results from model-
ling of different global pathways to reach the 2°C target (section 4) and investigates the impact
of different burden sharing approaches on resulting emission pathways of countries (section 5).
Part III closes with synthesis and conclusions.
INFRAS | 23 April 2012 | EMISSION PATHWAYS TO REACH 2 C TARGET | INTRODUCTION10|
PART I: INTERNATIONAL NEGOTIATIONS AND
APPROACHES TO BURDEN SHARING
2. STOCKTAKING OF POLICY AND SCIENCE STATUS
2.1. THE STATE OF NEGOTIATIONS
Main outcome of the Copenhagen negotiations in 2009 was a minimal consensus document
referred to as the Copenhagen Accord (CA), of which the parties merely “took note of”. How-
ever, the CA was eventually annexed with (voluntary) quantitative pledges by 44 developing
countries (nationally appropriate mitigation actions of developing country Parties) and 42 devel-
oped countries, including aggregated pledges from 27 EU member states (quantified economy-
wide emissions targets) for 2020. These pledges are stated as a particular per cent reduction in
2020 (commonly between 17% and 30%) from a certain base year (for example, relative to
1990, 2000, or 2005). Others are stated in terms of reductions in carbon intensity (percent de-
cline in GtCO2e per unit of economic value). These pledges have become the basis for analysing
whether the world is being able to achieve the long-term temperature target of limiting global
temperature increase to below 2°C relative to pre-industrial and through what kind of pathways
this could be reached. For a comprehensive list of pledges by Annex I and non-Annex-I coun-
tries (NAMAs) see Annex I.
Due to the deadlocked positions between industrialised, emerging economies and develop-
ing countries, negotiations during the COP16, hosted by Mexico in Cancun in December 2010
did not lead to a binding treaty a post-2012 agreement. No progress was made on the legal form
of such an agreement including the US or on the establishment of a second commitment period
to the Kyoto Protocol. By including the goal of limiting temperature increase to a global average
of 2°C relative to pre-industrial levels, the AWG – LCA 1 brings, however, this aspiration into
the formal UNFCCC process. However, the pledges that have been included in the Annex to the
Copenhagen Accord have not been altered substantially to more stringent ones, neither during
the Cancun negotiations, the Bangkok climate talks in April 2011, nor during the Bonn climate
talks in June 2011, as mandated in the Cancun Agreement. Only a few countries made some
specifications or clarification, e.g. regarding the accounting method used to define their target.
The duty for the COP in Durban was therefore, to negotiate emission targets in order to achieve
the 2° C target recognized in the Cancun Agreements. Besides the lack of binding quantitative,
1 http://unfccc.int/files/meetings/cop_16/application/pdf/cop16_lca.pdf
INFRAS | 23 April 2012 | EMISSION PATHWAYS TO REACH 2 C TARGET | STOCKTAKING OF POLICY AND SCIENCE
STATUS|11
global emissions reduction targets until 2020 and/or 2050, also in the issue of the time of global
peaking is not tackled yet and remains on the agenda for the next COP.
The pledges made by developed and developing country parties are widely acknowledged to
not leading to achieving the 2°C target (SEI 2011, CAT 2011c, UNEP 2010, Rogelj et al. 2010).
While analysing the pledges, one has to take into account that there are many factors which are
yet needed to be clarified in order to estimate projected emissions in 2020 (REF ClimateAction-
Tracker).
As outlined in the UNEP (2010) report pledges can be classified as conditional vs. uncondi-
tional and “lenient” versus “strict” rules. First of all, many countries made lower pledges that
are unconditional and higher pledges that are conditional upon certain conditions (such as ac-
tions by other Parties or financial and technology support). Some countries also have only one
target which is conditional on comparable action by other Parties (UNEP 2010, SEI 2011).
However, up to now, there is a lack of clarity on the interpretation of the conditional targets.
Developing countries pledges are often contingent on finance or technology transfer. However,
the details on the nature and extent of this support required to implement the conditional pledges
remain unclear. For most countries also the intended use of carbon offsets to contribute to the
conditional targets of developing countries remains to be unclear (CAT 2011a).
Secondly, the international accounting rules for achieving emission reduction targets by
2020 are not clearly defined. For example, surplus emissions (surplus AAUs) arise when coun-
tries overachieve their targets during the first commitment period of the Kyoto Protocol. These
surplus AAUs can be banked for the period beyond 2012 and could raise the effective emission
limits of developed countries to an extent, which would allow them to not implement any further
climate policies up to 2020 (CAT 2011b). Options to allow the full, unconstrained use of sur-
plus AAUs from the first commitment period in the period beyond 2012 as well as to fully elim-
inate them by not allowing banking are included in the current negotiation text. The ultimate
impact of all the options regarding a carry-over of the surplus AAUs depends on the willingness
of countries to buy the surpluses. Several countries have stated to limit the use of surplus for the
attainment of their 2020 pledges. For example, the European Union has stated not to recognize
surplus AAUs from the first commitment period (CAT 2011b). Also in Switzerland’s current
draft legal text on its national climate policy post 2012 no use of carry-over units and
use/purchase of foreign AAUs is expected (see fccc/tp/2011/1).
The accounting rules regarding emissions from the land use, land-use change and forestry
(LULUCF) sector for the time period beyond 2012 are also not yet decided upon. This implies
that the extent to which LULUCF activities in Annex I countries could be used and help to meet
the 2020 targets are still not clear (UNEP 2010). For some countries, an important crux is the
INFRAS | 23 April 2012 | EMISSION PATHWAYS TO REACH 2 C TARGET | STOCKTAKING OF POLICY AND SCIENCE
STATUS12|
choice of the reference level for forest management activities. This aspect is still being negotiat-
ed and multiple options are considered. These unresolved issues have the potential to lead to
higher actual global emissions in 2020 than pledged [ref UNEP and ref CAT]. There are a range
of other factors affecting the accounting of global emissions, such as e.g. how to include bunker
emissions into a future agreement.
The timing of global emissions peaking and the definition of a global 2050 emission reduc-
tion target were also part of the mandate for COP 17 in Durban, as outlined in the LCA text of
Cancun (Cancun Accord 2010):
“… to work towards identifying a global goal for substantially reducing global emissions by
2050, and to consider it at its seventeenth session” and “… to work towards identifying a
timeframe for global peaking of greenhouse gas emissions based on the best available scientific
knowledge and equitable access to sustainable development, and to consider it at its seventeenth
session”. The discussion in this regard is currently driven by opposing forces and viewpoints,
which make the establishment of an equitable allocation of mitigation efforts difficult. On the
one hand, arguments for stronger mitigation efforts by developed countries and a later peaking
of developing countries are justified by the fact that developed countries have higher historic
emissions and the emissions in developing countries that arise from activities that produce goods
for consumption in developed counters. Furthermore, developing countries highlight their right
for development and therefore argue that a later peaking than developed countries is appropriate.
On the other hand, the share of global emissions that come from developing countries is increas-
ing and currently already larger than the share from developed countries. This trend is expected
to continue in future, supporting the argument, that most mitigation over the coming decades
shall be achieved in developing countries.
In this context, the creation of new market-based mechanisms is another important point to
be agreed upon. New market mechanism, such as e.g. sectorial trading, sectorial crediting or
crediting of nationally appropriate mitigation mechanisms to enhance and promote the cost-
effectiveness of mitigation actions, may have significant influence in the definition of future
emission reduction pathways.
On October 2nd 2011, Switzerland has submitted in Panama a Submission to the LCA pro-
cess aiming at (i) the recognition of a lack in ambition of current pledges, (ii) the evaluation of
options in stepping up the pledges to more ambitious levels, (iii) the clarification of the pledges
(as mentioned above) and (iv) an Agreement on the goal of a legally binding mid-term climate
regime in Durban (Switzerland 2011).
INFRAS | 23 April 2012 | EMISSION PATHWAYS TO REACH 2 C TARGET | STOCKTAKING OF POLICY AND SCIENCE
STATUS|13
2.2. THE STATE OF SCIENCE
The Fourth Assessment Report (IPCC, 2007a) of IPCC remains the most comprehensive and up-
to-date summary on climate change. The Fifth Assessment Report (AR5) drafted by the IPCC is
now underway. It will again consist of three Working Group (WG) reports and a Synthesis Re-
port, to be completed in 2013/2014. While results of AR5 are not available yet, an assessment of
the recent literature shows that the main conclusions of the physical science part of AR4 have
not changed significantly. The evidence accumulates that humans are largely causing the ob-
served warming, and newer model simulations confirm the emission reductions that are needed
to stabilize temperature. Recent work highlights that much of the warming, once it is realized, is
largely irreversible (e.g (Solomon et al., 2010)), and that the cumulative amount of greenhouse
gas emissions approximately defines the long-term global temperature increase(Meinshausen et
al., 2009, Matthews et al., 2009, Zickfeld et al., 2009, Allen et al., 2009). In order to achieve the
2°C target, the total amount of greenhouse gases emitted over the course of the century has to be
limited to a specified total emission budget. Higher emissions earlier therefore imply lower
emissions at a later stage. In the real world, emissions do not change instantaneously, but are
dependent on feasibility factors such as economical and/or technological constraints. For exam-
ple, changes in the energy system and industry that produces the bulk share of current emissions
depend on the life time of energy and industry infrastructure (Davis et al., 2010) (for example,
about 50 years for a coal-fired power plant) and the rate by which new technologies can be
scaled-up. Therefore, specifying well-informed yearly targets at specific time intervals can as-
sure that a technologically and economically feasible path is followed while limiting the total
emissions over the century to a maximum budget (UNEP, 2010, Rogelj et al., 2011b).
The emission reduction pledges stated by the countries have not been developed through a
quantitative top-down approach to emissions management, in the sense of first defining tem-
perature limits and then negotiating and distributing the burden of emission reduction to the
countries. Instead, they are a set of proposals by individual countries, collected in a bottom-up
process. Currently, they are unlikely to be sufficient to satisfy a 2° target. The crux will there-
fore be to negotiate the emission reduction pathways in a way that they will not overburden the
technological (refers to whether technologies exist and be scaled-up fast enough), social (refers
to whether measures to control emission would be acceptable to society) or economical (refers
to whether or not cost is considered prohibitively high) systems (UNEP, 2010, Rogelj et al.,
2011b).
While total emissions determine the long term warming, the time evolution determines the
rate of climate change, which for certain systems is an important factor (e.g. for the ability of
INFRAS | 23 April 2012 | EMISSION PATHWAYS TO REACH 2 C TARGET | STOCKTAKING OF POLICY AND SCIENCE
STATUS14|
biosphere and humankind to adapt to the change). For targets like 2°C, the required maximum
rate of change is similar for any plausible emission path, but the duration of periods of high
change differs between different pathways, leading to different time durations of adaptive stress.
3. APPROACHES TO BURDEN SHARING
The above-mentioned mandate urges Parties to find common ground on their pledges as soon as
possible, as to avoid a gap between the commitment periods of the Kyoto Protocol. However,
current debates about emission reduction pledges are hampered by fundamental discussions
about how the burden of global emission reduction should be distributed and ultimately shared
by all Parties. A burden-sharing approach determines how emission reductions are allocated to
different participating countries according to a variety of rules and principles. Under the UN-
FCCC (1992; Article 3.1-5) a variety of principles attempts to lay out the framework conditions
for equity among member parties: Action should be taken by all countries on the basis of equity
and in accordance with their common but differentiated responsibilities and respective capabili-
ties, with Annex I countries taking the lead. This principle of Common but Differentiated Re-
sponsibility (CBDR) is a central concept that forms the basis for most burden-sharing approach-
es. The principle encompasses two aspects: first, there are differences in the contribution of
states to current levels of greenhouse gases in the atmosphere and second, countries have vary-
ing technical and economic capacities to reduce them. The common responsibility of all states is
to protect the climate system, but individual contributions are dependent to respective capabili-
ties. However, the concepts of responsibility and capability are interpreted differently by the
different stakeholders. Besides CBDR, further principles, such as the right to develop, precau-
tionary principles, or the adequacy of action make the choice of one single approach even more
complex. Most burden-sharing discussions originate from the question whether advanced and
major emitting Developing Countries should commit to binding emission reductions and if so, to
what extent and financed by whom.
To date a multiplicity of burden-sharing approaches has been discussed in the political
and academic domain 2. In the following, we provide a description of some of the burden-
sharing approaches deemed most relevant and describe how they were technically imple-
mented for analysis in the framework of this study. The three approaches analysed in this
2 For an comprehensive overview of burden sharing approaches see section 13.3.3 in FAR WG3 (IPCC 2007)
INFRAS | 23 April 2012 | EMISSION PATHWAYS TO REACH 2 C TARGET | APPROACHES TO BURDEN SHARING|15 study are, (1) the “Indian Proposal”, (2) Equal Cumulative Per Capita Emissions and (3) the Responsibility-Capacity Indicator approach. Indian Proposal 2008 The Indian Proposal (INFRAS 2008, 2010) uses the level of actual per capita greenhouse gas (GHG) emissions (“polluter pays”) and the per capita gross domestic product (GDP) as a meas- ure of the country’s economic strength and ability to pay. In the context of this study, the pro- posal is implemented as follows: All countries (parties) are divided into three groups: participat- ing, non-participating and parties in a transitional state. A country changes its status from non- participating to participating in the year when its total greenhouse gas (GHG) per capita emis- sions reach the average level of all participating countries. Once a country reaches this per capi- ta GHG threshold, it starts participating to the global GHG mitigation effort, and its per capita GHG emissions have to follow the reduction path of all other participating countries from that moment onwards. A transitional regime is implemented for countries that reach a GDP threshold of 20’000 US$/capita (ppp) before they reach the total GHG per capita emissions threshold of the participating countries. Countries that enter this transitional regime, have to stabilize their total emissions, but do not yet have to reduce their absolute amount of emissions. Only once they have reached the total GHG per capita threshold of the participating countries, the absolute emissions start declining. This proposal requires that the initial group of participating countries receives exogenous reduction targets. In this study, the exogenous reduction target, applied to all Annex I-countries, is defined, starting from the Annex I 2020 pledges, in a way such that the global emissions are consistent with the 2°C target. Furthermore, all per capita emissions of Annex I countries converge by 2050 (please note that in contrast this convergence by 2050 is not required in the RC-Indicator approach described below). Equal Cumulative per Capita Emissions The Equal Cumulative per Capita Emissions Proposal focuses on historic responsibility of coun- tries and defines that over a given period of time and for all countries the sum of all per capita emissions is equal. As only the sum is defined, this proposal cannot specify one single pathway (or year-to-year evolution of emissions) which complies with the equal cumulative per capita constraint. Many pathways can comply with the overall constraints. Again, we choose our path- ways in a way such that the cumulative amount of global emissions until the end of the 21st century are consistent with the 2°C target, and that the cumulative per capita emissions per country are equal from 1990 to 2100. We start to model emission allocation pathways from 2010 onwards. . INFRAS | 23 April 2012 | EMISSION PATHWAYS TO REACH 2 C TARGET | APPROACHES TO BURDEN SHARING
16|

    Technically, the allocations for each country are computed by optimizing a cubic spline
shape over the 21st century in a way such that the cumulative per capita amount of emis-
sions is equal for all countries within the accounting period. The choice of using a cubic
spline to compute the pathways is arbitrary and not specified by the proposal itself. Emis-
sions by 2100 are assumed to be zero for all countries.

Responsibility-Capacity Indicator
A third burden sharing approach, in line with an informal statement by the Swiss government, is
analysed for this study (Fast Start Finance 2011). The Responsibility-Capacity Indicator ap-
proach (RC-indicator) is based on the principle that the effort of emission reductions can be
distributed among countries using an indicator based on 2 principles:
    (1) the “polluter pays” principle, based on “relative levels of emissions” and
    (2) the “ability to pay” principle,
while different weights can be given to one of these two principles.
The “polluter pays” principle is computed in every year and for every country by taking the
average per capita emissions per country over the 10 previous years. The “ability to pay” princi-
ple is implemented by taking the projected GDP/capita of each country (Van Vuuren et al.,
2007). The RC-Indicator is computed as the normalized sum of the values resorting from both
principles. The “polluter pays” principle is weighted relatively more (at 75%) and the “ability to
pay” relatively less at 25%. The GDP/capita projections at a country level are from the
downscaled SRES A1B scenario from (van Vuuren et al., 2006). In this study, the RC-indicator
has been used to share the effort between the Infras reference scenario defined in section 4 and a
mitigation scenario which mimics the “Pledges” pathway of section 4 until 2020 and that is in
line with the 2°C target.

    All of these approaches can be regarded as being based on the principle of Common but
Differentiated Responsibility. However, further perspectives regarding equity are addressed
individually (Table 3).

INFRAS | 23 April 2012 | EMISSION PATHWAYS TO REACH 2 C TARGET | APPROACHES TO BURDEN SHARING
|17
BURDEN SHARING APPROACHES AND EQUITY
Approach Allocation Outcome Historic re- Ability to pay Comment
Equity equity sponsibility
Indian pro- Per capita Per capita The historical Additional Developing coun-
posal 2008 emissions emissions of level of per transitional tries with large
(per capita AI converge capita emis- regime based populations par-
emissions by 2050 sions defines on GDP lets ticipate later.
threshold if a country more affluent Initial exogenous
approach) participates NAI-countries allocation
from the be- stabilize GHG scheme for An-
ginning or not. emissions nex I countries
consistent with
2°C is crucial.
Equal cumula- Per capita Same cumu- Cumulative Not taken into Determination of
tive per capita emissions lative per per capita account period per capita
emissions capita emis- emissions for emissions are
sions for all a specific accounted for is
countries period of time considered is
between crucial.
1990 and
2100
Responsibility- Per capita Ranking Average per GDP/capita Approach is re-
Capacity Indi- emissions according to capita emis- lated to Indian
cator (75% indicator sion per coun- Proposal, but
weight) and try in previous more gradual
GDP/capita 10 years
(25%
weight)
Table 3 Burden Sharing Approaches as implemented in this study in the light of equity principles.
The table shows that the Indian Proposal and the RC-Indicator approaches are related in that
they both build on per capita emissions and GDP to determine the burden sharing. Results for
the RC-Indicator approach show that is a more gradual approach than the Indian Proposal. With
the RC-Indicator approach, the burden allocated to an individual country (party) steadily in-
creases with increasing emissions and economic development, whereas with the Indian Proposal
the burden and therefore emission path of countries shifts suddenly as soon as they make the
transition from the group of non-participating to the group of participating countries.
The equal cumulative per capita emissions approach focuses entirely on past emissions and
disregards the (economic) ability of countries in engaging in GHG mitigation actions.
This will be further analysed in the model results section 5.
INFRAS | 23 April 2012 | EMISSION PATHWAYS TO REACH 2 C TARGET | APPROACHES TO BURDEN SHARING18|
PART II: MODELLING OF EMISSION PATHWAYS
4. MODEL RESULTS: GLOBAL EMISSION PATHWAYS
Several global emissions pathways are conceptually possible that are consistent with achieving
the 2°C target. However, they exhibit varying levels of technical and socio-economic feasibility.
In the following, we consider on a global level three different pathways reaching the 2°C target
(as included in the Cancun Agreement) as well as a pathway consistent with a 1.5°C target
(which the Cancun Agreement requires to reconsider in 2015) and analyse their characteristics.
The pivotal question is how pathways where fast mitigation action is taken compare to more
lenient approaches.
4.1. CHARACTERISTICS OF GLOBAL EMISSION PATH-
WAYS
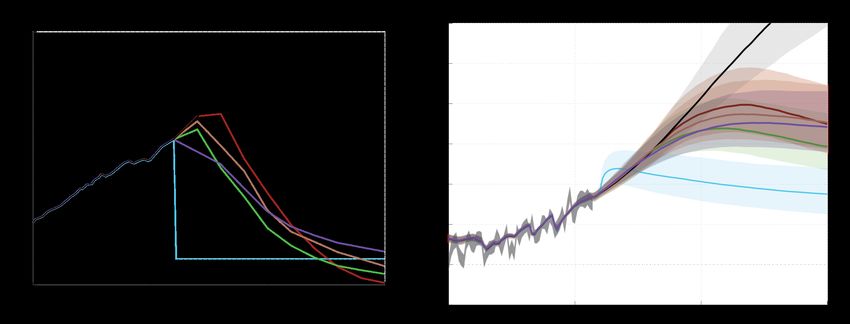
The global emission pathways in Figure 2 (left) were computed with the MESSAGE integrated
assessment model (IAM) of the International Institute of Applied Systems Analysis (IIASA,
Austria). IAMs simulate evolutions of the global energy system and take into account con-
straints on technological market penetration, technological availability, and resource constraints,
amongst other things (see also (O'Neill et al., 2009)). As such IAMs can give insights in the
technological and economic feasibility of emission pathways.
Reference scenario
As a basis for the evaluation of global pathways and burden sharing, a reference scenario has
been defined. The Reference scenario is constructed based on the latest historical data submitted
by Parties to the UNFCCC, the unconditional emission reduction pledges from both Annex I and
non-Annex I Parties as assessed in the UNEP “The Emissions Gap Report” (UNEP, 2010), and
further uses the projections from the IEA World Energy Outlook 2009 reference scenario. The
methodology and sources are similar to the “PRIMAP B” scenario in (Rogelj et al., 2011a), but
with the most recent CRF data for Annex I countries and National Communication data for non-
Annex I countries. More background on the methodology can be found in (Nabel et al., 2011). It
should be noted that emissions data submitted by parties may be of heterogeneous quality, in
particular for non-energy related emissions and LULUCF.
The reference scenario assumes that energy efficiency improvements follow historically ob-
served trends. The energy mix is balanced over all supply options (gas, coal, nuclear etc.). As
INFRAS | 23 April 2012 | EMISSION PATHWAYS TO REACH 2 C TARGET | MODEL RESULTS: GLOBAL EMISSION
PATHWAYS|19
such, this scenario does not represent a worst case scenario in terms of greenhouse gas emission
during the 21st century as they have been assessed in the literature (Sanderson et al., 2008).
Emission Scenarios
Six emission pathways are shown in Figure 2 (left) and Table 3. All but two of the five path-
ways shown are computed with the MESSAGE IAM. The setup of the pathways is based on
(GEA, 2011) and uses a setup similar to (Rogelj, forthcoming).
PATHWAYS
Pathway Description Target Comment
Reference Business as usual including n.a. See section 0 below
energy efficiency improvements
following historical trends
Climate commitment Sudden stop in global emis- n.a. Purely hypothetical pathway to
sions in 2010 demonstrate inertia of climate
system
Optimal Globally cost optimal path to 2°C Assumes full participation of all
target sectors in all regions (Annex I
and NAI) from 2010
Pledges Assumes reaching of emissions 2°C Assumes full participation of all
pledges 2020 sectors in all regions (Annex I
and NAI) from 2020
Delayed non-Annex I Entire mitigation action until 2°C Assumes full participation of all
2030 is carried out by Annex I sectors in all regions (Annex I
countries and NAI) from 2030
1.5°C target Full technology scenario leads 1.5°C Pathway overshoots 1.5°C and
to return to 1.5°C by 2100 with approaches 1.5°C from top
50% likelihood. towards 2100
Table 1 Overview on pathways of global GHG emissions considered in this study.
Besides the “reference” pathway characterized above, the “climate commitment” pathway (light
blue in Figure 2) represents a sudden stop in global emissions in 2010, and was not modelled
with the MESSAGE model. From the other four pathways, three represent pathways with a simi-
lar cumulative total greenhouse gas emission budget 3 over the 21st century. The latter three
3 The emission budget in the model runs has been counted from 2000 until 2110 and amounts to approximately
2400 to 2500 GtCO2e over the entire time frame. This budget has been chosen in a way such that the perfect
foresight, full-portfolio energy system simulation from 2010 until the end of the 21st century yields an emission
path which has a greater than 66% chance to limit global temperature increase to below 2°C above pre-industrial
levels. The applied cumulative GHG emission budgets roughly result in a 1900 to 2000 GtCO2e budget between
2000 and 2050. This is consistent with earlier studies which, at that point, did not yet assume a large potential for
negative emissions in the second half of the century. For example: MEINSHAUSEN, M., MEINSHAUSEN, N.,
HARE, W., RAPER, S. C. B., FRIELER, K., KNUTTI, R., FRAME, D. J. & ALLEN, M. R. 2009. Greenhouse-gas
emission targets for limiting global warming to 2°C. Nature, 458, 1158-1162.
INFRAS | 23 April 2012 | EMISSION PATHWAYS TO REACH 2 C TARGET | MODEL RESULTS: GLOBAL EMISSION
PATHWAYS20|
emission pathways have been modelled with the MESSAGE integrated assessment model (IAM)
operated at IIASA. These pathways are illustrations of possible and internally consistent evolu-
tions of emissions, but do not represent an in-depth analysis of feasibility of each of the path-
ways or of the 2020 emission levels. The costs associated with each path differ significantly. For
the creation of the pathways we assume that all currently known mitigation technologies will be
available in the future but have nuclear energy supply phase-out over the 21st century 4. Based on
the IAM results, the “Optimal” and “Pledges” pathway can be considered “technologically and
economically feasible” (see Box 1). The “Delayed non-Annex I” pathway is considered not to be
“technologically and economically feasible” by the model.
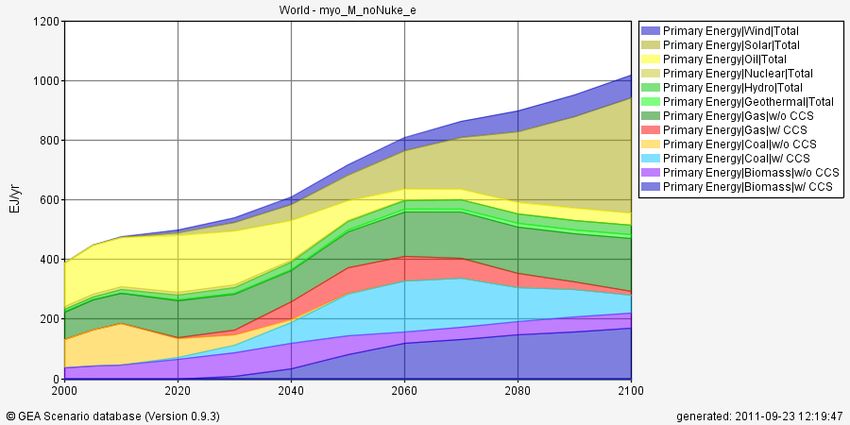
The “Optimal” pathway (purple) shows the emissions in case a globally cost-optimal path would
be followed from today onwards. This is only possible through full and immediate participation
of all sectors in all regions. Such early action allows for slower emissions decrease in later dec-
ades and allows for positive global emissions in 2100, reducing the need for potentially very
costly technologies with negative emissions such as biomass energy combined with carbon cap-
ture and storage (CCS). As an example, the mix of energy technologies assumed for the “Opti-
mal” pathway is shown in Annex II (A).
The orange “Pledges” pathway first raises to global emission levels in 2020 in line with the es-
timate emission levels based on the emission reduction pledges of countries under the Copenha-
gen Accord and the Cancún Agreements (from (UNEP, 2010)). After 2020 it is assumed that all
sectors and all regions participate in the global mitigation effort. The orange pathway can only
be considered “feasible” if one assumes major technological breakthroughs such as the advanced
decarbonisation of the transportation sector, with the pace of energy efficiency improvements
and technology penetration rates lying beyond those observed in the past. This pathway requires
a massive upscaling of CCS to reach net negative global emissions at the end of the 21st century.
4 In particular no new investments are made in nuclear energy beyond today. This assumption is made to assure
partial consistency with current Swiss energy policy (Bundesrat 2011).
INFRAS | 23 April 2012 | EMISSION PATHWAYS TO REACH 2 C TARGET | MODEL RESULTS: GLOBAL EMISSION
PATHWAYS|21
Box 1: What are “feasible pathways” in the context of the Integrated Assessment Model?
The Integrated Assessment Model (IAM) optimizes overall cost to reach a certain global emis-
sion level. Besides the existing energy technologies such as fossil fuel based power generation
or CCS (and their future improved versions), the model provides the technological option of
very expensive (>1000USD/tCO2) yet unknown “backstop” mitigation technologies. Scenarios,
where existing technologies are not sufficient to reach required emission levels are characterized
by high levels of this “backstop” technology. In general, the amount of unknown backstop tech-
nologies allowed by the end of the century should not exceed 5% for a scenario to be considered
technologically and economically feasible [ref Chapter 17 GEA].
It should be however noted, that scenarios that are considered technologically and economically
feasible in the sense of the IAM may not materialize, because of socio-political barriers. E.g. all
scenarios compliant with the 2°C target assume to a large extent the realisation of economically
and technically feasible potentials in fossil and biomass based CCS. Given the barriers that cur-
rent CCS pilot projects face, at this point it seems rather unlikely that such low carbon technolo-
gies will be disseminated with sufficient pace to allow for the emission reductions assumed in
the considered pathways.
The “delayed non-Annex I” pathway (dark red) represents a pathway in which the entire mitiga-
tion action until 2030 is carried out in developed countries and non-Annex-I parties follow a
BAU emissions scenario between 2020 and 2030. Developing countries join the global effort to
limit global temperature to below 2°C above pre-industrial levels after 2030. Global emissions
peak therefore only in 2030 and have to decline very steeply thereafter. Significant net negative
global emissions in the last quarter of the 21st century are necessary to reach the 2°C target. This
pathway is considered technologically infeasible by the IAM, because not enough technologies
are available to generate the steep and sustained decrease in emission after the peak. The only
way in which the (technology-rich) MESSAGE model is able to simulate such a path is by as-
suming that more than a quarter of the total energy demand by 2100 is met by unknown so-
called “backstop” technologies (see Box 1). Therefore the “delayed non-Annex I” scenario
shown in Figure 2 (left) is considered technologically and economically infeasible.
The “1.5°C” scenario (light green) represents a full technology portfolio scenario with a reduced
global total emission budget 5 which allows returning to below 1.5°C by 2100 with at least a
50% chance. According to the IAM results, such a scenario is only feasible, if large investments
5 In analogy with the approach for the 2°C budget, the 1.5°C cumulative GHG emission budget has been determined
in way such that the perfect foresight, full-portfolio simulation yields the desired climate outcome.
INFRAS | 23 April 2012 | EMISSION PATHWAYS TO REACH 2 C TARGET | MODEL RESULTS: GLOBAL EMISSION
PATHWAYS22| at the demand side are combined with policies that promote energy-efficient ways of living (GEA 2011) in order to embark on a future high-efficiency and low-demand path. For example, such a low energy demand future includes a very strong shift to a globally decarbonized trans- portation sector and an emphasis on public transport. Also this pathway requires considerable net negative global emissions in the last quarter of the 21st century. This set of possible future emission pathways show very distinct characteristics. All pathways exploit the full allowable potential of biomass combined with carbon capture and storage (BECCS) and all allow the full use of the fossil CCS potential. The “Optimal”, “Pledges”, and “1.5°C” scenario all are able to limit global temperature increase to below 2°C without a future reliance on nuclear energy or other yet unknown “backstop” technologies. For the “1.5°C” sce- nario a very important shift to energy-efficient modes of living, including a decarbonisation (implying a large-scale electrification) of the global transport sector, would be a requirement. INFRAS | 23 April 2012 | EMISSION PATHWAYS TO REACH 2 C TARGET | MODEL RESULTS: GLOBAL EMISSION PATHWAYS
|23

Figure 2 Left: considered pathways for global GHG emissions excluding LULUCF (Reference, Climate commitment, Optimal, Pledges, Delayed non-Annex I, 1.5°C target – see Table 1).
Right: Resulting probabilistic temperature projections for each of the pathways based on MAGICC model showing median and “likely” (66%) probability ranges.

INFRAS | 23 April 2012 | EMISSION PATHWAYS TO REACH 2 C TARGET | MODEL RESULTS: GLOBAL EMISSION PATHWAYS
24|

4.2. GLOBAL TEMPERATURE PROJECTIONS

For each of the global emission scenario described in Table 1, probabilistic temperature projec-
tions are computed with the reduced-complexity climate system and carbon-cycle model
MAGICC (Meinshausen et al., 2011a), version 6. MAGICC has been calibrated and can reliably
simulate atmospheric CO2 concentrations from emissions following high-complexity carbon-
cycle models (Meinshausen et al., 2011b, Meinshausen et al., 2011a). Also its global average
near-surface warming projections are closely in line with estimates from the suite of atmos-
phere-ocean general circulation models, as assessed in the IPCC AR4 (IPCC, 2007b). The model
has been constrained with historically observed hemispheric land/ocean temperatures (Brohan et
al., 2006) and ocean heat-uptake estimates (Domingues et al., 2008). It further emulates the
C4MIP carbon-cycle models (Friedlingstein et al., 2006) and uses a climate sensitivity probabil-
ity distribution (Rogelj et al., in review) which closely reflects IPCC estimates (IPCC, 2007b).
For each pathway, a 600-member ensemble is calculated to determine its transient temperature
probability distribution. The figures show the median and the 66% probability range.
The emission pathways resulting from the “Optimal”, “Pledges” and “Delayed non-ANNEX I”
scenario all stay with a likely (greater than 66%) chance below 2°C in the long term (i.e. beyond
the 21st century). However, they show very distinct differences in their transient exceedance
probabilities. Whereas both the “optimal” and the “pledges” scenario limit global temperature
increase to below 2°C with a likely (greater than 66%) chance during the entire 21st century, this
probability for the “delayed non-ANNEX I” scenario is reduced to 50%. Despite having the
same long-term probability to stay below 2°C, the “delayed non-ANNEX I” shows significantly
longer periods in which the rate of temperature change exceeds 0.2°C per decade, a threshold
that may being implying increasing amounts of adaptation stress to eco-systems.

INFRAS | 23 April 2012 | Model results: global emission pathways
|25

Figure 3 Resulting rate of temperature change per year (10 year moving average) for considered pathways of
global GHG emissions (Optimal, Pledges, Delayed non-Annex I, 1.5°C target – see Table 1).

  For comparison, Figure 2 provides also a Reference (BAU) scenario (for definition see section
  0). The median temperature estimate in 2100 for the BAU scenario is 3.7°C above rep-
  industrial, with a 66% confidence range of 3.0 to 4.6°C.

INFRAS | 23 April 2012 | Model results: global emission pathways
26|

5. MODEL RESULTS: BURDEN SHARING – COUNTRY (-
   GROUP) LEVEL

In this section, the “Pledges” pathway from section 4 serves as a the basis for exploring three
different approaches to sharing the burden of emissions reductions to meet the 2°C target be-
tween countries (parties). The three burden sharing approaches considered are described in sec-
tion 3: (i) Indian proposal, (ii) Equal cumulative per capita emissions, and (iii) Responsibility-
Capacity Indicator. For the RC-Indicator based approach, the “burden” of emission reductions to
be shared by countries results from the difference between “Reference” and “Pledges” pathways.
     In the following, the characteristics of the different burden sharing approaches and their im-
pact on the relative share of emission allowances for different counties or country groups are
analysed. It should be noted that underlying assumptions regarding data, models and necessary
emission reduction efforts are subject to significant uncertainties and that the results should
therefore be considered quantified illustrations of the different concepts rather than exact calcu-
lations. The resulting pathways for specific country (groups) are not proposals for the actual
burden sharing, but aim at illustrating the dynamic interaction of different approaches and as-
sumptions and highlighting major challenges that lie in such an effort sharing exercise.

5.1. BURDEN SHARING BETWEEN ANNEX I AND NON-
     ANNEX I COUNTRIES

Figure 4 shows the resulting pathways for both developed countries (Annex I – “AI”) and de-
veloping countries (non-Annex I – “NAI”). The reference scenario (BAU) assumes for Annex I
countries roughly a stabilisation of emissions, whereas non-Annex I countries from 2010 to
2050 are expected to more than double their GHG emissions to over 50 Gt CO2eq (black/grey).

INFRAS | 23 April 2012 | Model results: burden sharing – country (-group) level
|27
COMPARISON OF ANNEX I AND NON-ANNEX I PATHWAYS
60000000
50000000
40000000
INDPRO - NAI
GHG Emissions [Gg CO2eq]
CPC1990 - NAI
30000000 RCI - NAI
BAU - NAI
INDPRO - AI
20000000 CPC1990 - AI
RCI - AI
BAU - AI
10000000
0
1950 2000 2050 2100
-10000000
Figure 4 Global emission pathways for Annex I (AI – developed countries; solid lines) and non-Annex I coun-
tries (NAI – developing countries, dashed lines) for different Burden sharing approaches: Indian Proposal 2008
(INDPRO), Cumulative per capita emissions since 1990 (CPC1990), RC-Indicator (RCI) and Reference scenar-
io (BAU). Please note that results are preliminary. All Kyoto-Gases considered excluding LULUCF.
The RC-Indicator approach requires a very rapid decrease in emissions in Annex I countries
right after the defined Pledges of 2020 (RCI-AI), because of the high per capita emissions and
GDP leading to a high RC-Indicator which requires Annex I countries to shoulder a large
amount of the reduction burden. But by 2020 also a significant number of non-Annex I countries
in total are expected to have reached per capita emissions and GDP levels that trigger immediate
strong emission reductions.
On the global level of Annex I vs. non-Annex I countries, the threshold based Indian pro-
posal (INDPRO) leads to rather similar results than the more gradual RC-Indicator approach
(RCI), because both approaches mimic the total global emissions (AI plus NAI) of the “Pledges”
scenario of section 4. Also, both approaches are primarily driven by actual (INDPRO) or aver-
age past emissions during the last ten years (RCI), respectively, resulting in similar shapes. The
Indian proposal is somewhat more stringent for total AI emissions in 2050 than RC-Indicator
(15% of 1990 emissions instead of 18%) and somewhat less stringent with NAI countries (108%
instead of 95%), as shown in Table 4.
INFRAS | 23 April 2012 | Model results: burden sharing – country (-group) levelYou can also read