America's Dirtiest Power Plants - Their Oversized Contribution to Global Warming and What We Can Do About It
←
→
Page content transcription
If your browser does not render page correctly, please read the page content below
America’s Dirtiest Power Plants
Their Oversized Contribution to Global
Warming and What We Can Do About It
America’s Dirtiest
       Power Plants
Their Oversized Contribution to Global Warming
        and What We Can Do About It

                        Written by:

     Jordan Schneider and Travis Madsen, Frontier Group
 Julian Boggs, Environment America Research & Policy Center

                     September 2013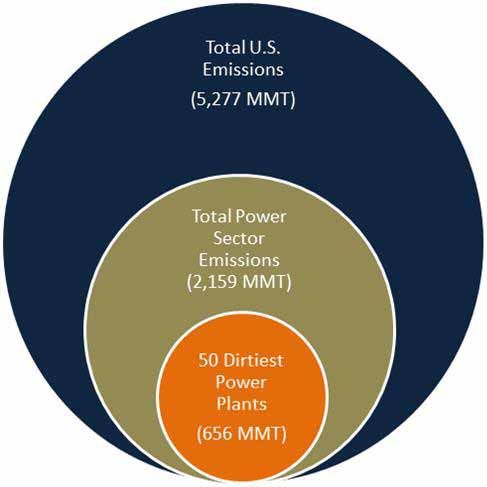
Acknowledgments
The authors thank Jeff Deyette, Senior Energy Analyst at Union of Concerned Scientists; Liz Perera,
Senior Washington Representative, and Debbie Sease, Legislative Director, at Sierra Club; Mike
Obeiter, Senior Associate, Climate and Energy Program at World Resources Institute; Starla Yeh,
Policy Analyst, Climate and Clean Air Program at Natural Resources Defense Council; and others for
providing useful feedback and insightful suggestions on drafts of this report. We also thank Frank
Iannuzzi at Environment America Research & Policy Center for contributing to this report; and Tony
Dutzik and Ben Davis at Frontier Group for providing editorial support.

The authors bear responsibility for any factual errors. The views expressed in this report are those of
the authors and do not necessarily reflect the views of our funders or those who provided review.

© 2013 Environment America Research & Policy Center

                            Environment America Research & Policy Center is a 501(c)(3) organization.
                            We are dedicated to protecting our air, water and open spaces. We
                            investigate problems, craft solutions, educate the public and decision-
                            makers, and help the public make their voices heard in local, state and
                            national debates over the quality of our environment and our lives. For
more information about Environment America Research & Policy Center or for additional copies of
this report, please visit www.environmentamericacenter.org.

Frontier Group conducts independent research and policy analysis to support a cleaner, healthier
and more democratic society. Our mission is to inject accurate information and compelling ideas into
public policy debates at the local, state and federal levels. For more information about Frontier Group,
please visit www.frontiergroup.org.

Cover photo: Georgia Power Company’s Plant Scherer in Juliette, Georgia, is the nation’s most-
polluting power plant. Each year, it emits more carbon dioxide pollution than that produced by
energy consumption in Maine. See Table 1 in report.

Photo Credit: TinRoof Marketing & Design

Design and Layout: To the Point Publications, www.tothepointpublications.com
Table of Contents Executive Summary . . . . . . . . . . . . . . . . . . . . . . . . . . . . . . . . . . . . . . . . . . . . . 4 Introduction . . . . . . . . . . . . . . . . . . . . . . . . . . . . . . . . . . . . . . . . . . . . . . . . . . . . 8 The Dirtiest U.S. Power Plants Are a Major Source of Global Warming Pollution . . . . . . . . . . . . . . . . . . . . . . . . . . . . . . . . . . . . . . . 10 Cutting U.S. Power Plant Pollution Can Help Prevent the Worst Impacts of Global Warming . . . . . . . . . . . . . . . . . . . . . . . . . . . . . . . 16 Carbon Pollution Standards Are Needed to Clean Up Existing Power Plants . . . . . . . . . . . . . . . . . . . . . . . . . . . . . . . . . . . . . . . . . . . 20 Policy Recommendations . . . . . . . . . . . . . . . . . . . . . . . . . . . . . . . . . . . . . . . . 22 Methodology . . . . . . . . . . . . . . . . . . . . . . . . . . . . . . . . . . . . . . . . . . . . . . . . . . 24 Appendices . . . . . . . . . . . . . . . . . . . . . . . . . . . . . . . . . . . . . . . . . . . . . . . . . . . . . 26 Notes . . . . . . . . . . . . . . . . . . . . . . . . . . . . . . . . . . . . . . . . . . . . . . . . . . . . . . . . . 42
Executive
Summary

G                                                         A small handful of the dirtiest
          lobal warming is one of the most profound
          threats of our time, and we’re already start-   power plants produce a massive and
          ing to feel the impacts – especially when it    disproportionate share of the nation’s
comes to extreme weather. From Hurricane Sandy to         global warming pollution.
devastating droughts and deadly heat waves, ex-
treme weather events threaten our safety, our health      • In 2011, the U.S. power sector contributed 41
and our environment, and scientists predict things          percent of all U.S. emissions of carbon dioxide, the
will only get worse for future generations unless we        leading pollutant driving global warming.
cut the dangerous global warming pollution that
                                                          • There are nearly 6,000 electricity generating facili-
is fueling the problem. Power plants are the largest
                                                            ties in the United States, but most of the global
source of global warming pollution in the United
                                                            warming pollution emitted by the U.S. power
States, responsible for 41 percent of the nation’s
                                                            sector comes from a handful of exceptionally dirty
production of carbon dioxide pollution, the leading
                                                            power plants. For example, about 30 percent of
greenhouse gas driving global warming.
                                                            all power-sector carbon dioxide emissions in 2011
America’s power plants are among the most signifi-          came from the 50 dirtiest power plants; about half
cant sources of carbon dioxide pollution in the world.      came from the 100 dirtiest plants; and about 90
The 50 most-polluting U.S. power plants emit                percent came from the 500 dirtiest plants. (See
more than 2 percent of the world’s energy-related           Figure ES-1.)
carbon dioxide pollution – or more pollution than
every nation except six worldwide.

Despite their enormous contribution to global warm-
ing, U.S. power plants do not face any federal limits
on carbon dioxide pollution. To protect our health,
our safety and our environment from the worst
impacts of global warming, the United States should
clean up the dirtiest power plants.

      Figure ES-1. The 50 Dirtiest Power Plants
      Contribute Significantly to U.S. Carbon Dioxide
      Pollution (Million Metric Tons – MMT), 2011

4  America’s Dirtiest Power Plants
• The dirtiest power plant in the United States, The dirtiest U.S. power plants are
Georgia Power’s Plant Scherer, produced more major sources of global warming
than 21 million metric tons of carbon dioxide pollution on a global scale.
in 2011 – more than the total energy-related
emissions of Maine. (See Table ES-1.) • If the 50 most-polluting U.S. power plants
were an independent nation, they would be
• Dirty power plants produce a disproportionate the seventh-largest emitter of carbon dioxide
share of the nation’s global warming pollution – in the world, behind Germany and ahead of
especially given the relatively small share of total South Korea. (See Figure ES-2.) These power
electricity they produce. For example, despite plants emitted carbon dioxide pollution
producing 30 percent of all power-sector carbon equivalent to more than half the emissions
dioxide emissions, the 50 dirtiest power plants only of all passenger vehicles in the United States
produced 16 percent of the nation’s electricity in in 2010.
2011.
Table ES-1. Emissions Equivalencies for the Nation’s Top Emitters of Global Warming Pollution
Total 2011 Percent of Percent of Global
Emissions (Million Total U.S. Carbon Dioxide
Metric Tons of Carbon Dioxide Emissions from These Plants Produce Carbon Dioxide
Carbon Dioxide) Emissions Energy Use Greater Than or Equivalent To…
• The total energy-related emissions
Top Polluting of Maine
Plant (Scherer 21 0.4% 0.1% • The pollution produced by
Power Plant, GA) electricity use in all New England
homes in a year
• The pollution emitted by all the
passenger vehicles in New York and
Top 10 Polluting California
179 3.4% 0.5%
Power Plants
• The total energy-related emissions
of Venezuela
• Half the emissions of all passenger
Top 50 Polluting vehicles in the United States
656 12.4% 2.0%
Power Plants • The total energy-related emissions
of Texas
• The emissions of all passenger
vehicles in the United States
Top 100 Polluting
1,052 19.9% 3.2% • The pollution produced by
Power Plants
electricity use in all U.S. homes in
a year
Executive Summary 5Figure ES-2. Carbon Dioxide Pollution Emitted by the 50 Dirtiest Power Plants Compared to
Other Countries (MMT CO2)
10,000
9,000
8,000
7,000
6,000
5,000
4,000
3,000
2,000
1,000
0
China United All U.S. India Russia Japan Germany 50 Dirtiest South Canada
States Power U.S. Korea
Plants Power
Plants
• The 100 most-polluting U.S. power plants ºº New plants – The Environmental Protection
produced more than 3 percent of the world’s Agency (EPA) should work to meet its Sep-
carbon dioxide emissions from energy use in 2011, tember 2013 deadline for re-proposing a
while the 500 most-polluting power plants were stringent emissions standard for new power
responsible for about 6 percent. plants. It should also set a deadline for final-
izing these standards no later than June 2015.
To protect our health, our safety, and
our environment from the dangers of ºº Existing plants – The EPA should work to
global warming, America must clean meet the timeline put forth by President
up polluting power plants. Obama for proposing and finalizing emis-
sions standards for existing power plants. This
• The Obama Administration should set strong timeline calls for limits on existing plants to
limits on carbon dioxide pollution from new be proposed by June 2014 and finalized by
power plants to prevent the construction of a new June 2015. The standards should be based on
generation of dirty power plants, and force exist- the most recent climate science and designed
ing power plants to clean up by setting strong to achieve the emissions reduction targets
limits on carbon dioxide emissions from all exist- that are necessary to avoid the worst impacts
ing power plants. of global warming.
6 America’s Dirtiest Power PlantsIn addition to cutting pollution from at residential, commercial and industrial buildings
power plants, the United States should over the next two decades.
adopt a suite of clean energy policies
• Encouraging the use of energy-saving combined
at the local, state, and federal levels to
heat-and-power systems in industry.
curb emissions of carbon dioxide from
energy use in other sectors. • Facilitating the deployment of millions of plug-in
In particular, the United States should prioritize es- vehicles that operate partly or solely on electricity,
tablishing a comprehensive, national plan to reduce and adopting clean fuel standards that require a
carbon pollution from all sources – including trans- reduction in the carbon intensity of transportation
portation, industrial activities, and the commercial fuels.
and residential sectors.
• Ensuring that the majority of new residential and
Other policies to curb emissions include: commercial development in metropolitan areas
takes place in compact, walkable communities
• Retrofitting three-quarters of America’s homes and with access to a range of transportation options.
businesses for improved energy efficiency, and • Expanding public transportation service to double
implementing strong building energy codes to ridership by 2030, encouraging further rider-
dramatically reduce fossil fuel consumption in new ship increases through better transit service, and
homes and businesses. reducing per-mile global warming pollution from
• Adopting a federal renewable electricity standard transit vehicles. The U.S. should also build high-
that calls for 25 percent of America’s electricity to speed rail lines in 11 high-priority corridors by
come from clean, renewable sources by 2025. 2030.
• Strengthening and implementing state energy • Strengthening and expanding the Regional Green-
efficiency resource standards that require utili- house Gas Initiative, which limits carbon dioxide
ties to deliver energy efficiency improvements in pollution from power plants in nine northeast-
homes, businesses and industries. ern state, and implementing California’s Global
Warming Solutions Act (AB32), which places an
• Installing more than 200 gigawatts of solar panels economy-wide cap on the state’s greenhouse gas
and other forms of distributed renewable energy emissions.
Executive Summary 7Introduction
I
t doesn’t take a trip to the Arctic Circle to see for future generations unless we immediately and
evidence of global warming these days. The im- dramatically reduce the dangerous carbon pollution
pacts of a warming planet are now appearing that is fueling the problem. Meeting that challenge
on our doorsteps, making headlines in the morning can seem overwhelming, and it’s certainly not going
paper. The United States has seen much more than to be easy. But the United States and the world can
its usual share of extreme downpours and intense make a major down-payment toward those emission
heat waves in recent years, and emerging science reductions by cleaning up our biggest sources of
links the increase in frequency and severity of some pollution.
of these events to global warming.1 New research
In the case of the United States, that means power
also shows that a warmer world is likely to exacer-
plants. As this report will show, a small number of
bate the impacts of extreme weather events, such
dirty power plants make a massive and dispropor-
as hurricanes, floods, drought and wildfires.2 Many
tionate contribution to the nation’s global warming
extreme weather events of 2012 foreshadow the
emissions. Cleaning up our existing power plants –
kind of disruption global warming may cause in the
and preventing construction of a new generation of
future. From the late-season “superstorm” Hurricane
dirty power plants – would make a significant differ-
Sandy wreaking havoc on the East Coast, to early-
ence in fighting global warming.
season wildfires destroying thousands of homes in
the West, to year-round drought conditions parch- For the first time in history, the United States is
ing the largest area of the continental U.S. since preparing to take action to clean up these massive
1956, extreme weather events are occurring with sources of carbon pollution. In 2012, the Environ-
increasing frequency and severity.3 mental Protection Agency (EPA) issued the first-ever
pollution standards for new power plants, and this
Since 2007, federally declared weather-related
summer President Obama directed the EPA to estab-
disasters in the United States have affected counties
lish a standard for existing power plants by 2015.5
housing 243 million people – or nearly four out of
five Americans.4 These events have caused billions By finalizing strong carbon pollution standards for
of dollars in economic damage, have harmed our new and existing power plants, the U.S. will seize one
natural environment, and have jeopardized the of its best available opportunities to significantly re-
lives of thousands of people. Climate science tells duce carbon pollution – helping to forestall the worst
us that the impacts of these events will only worsen impacts of global warming for future generations.
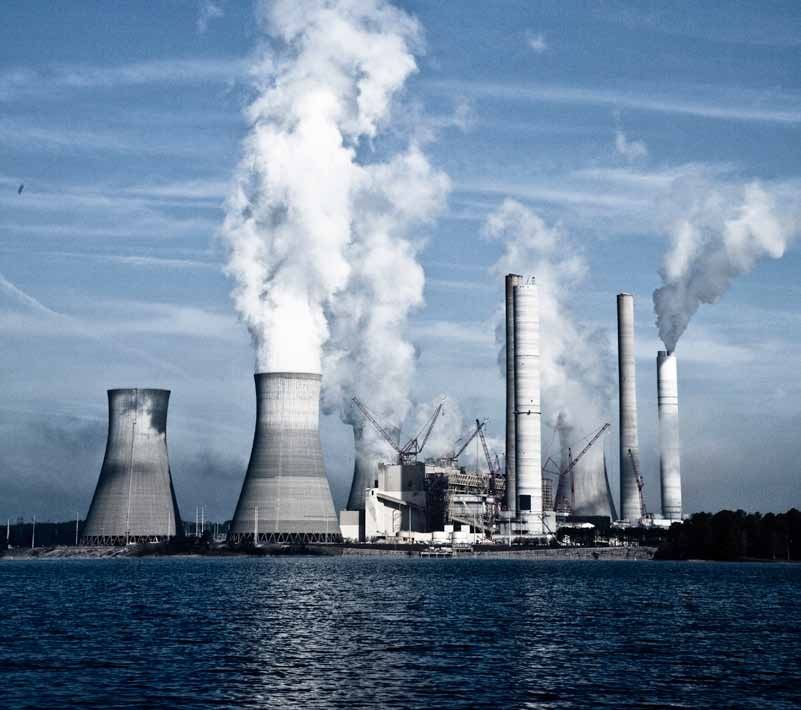
8 America’s Dirtiest Power PlantsPhoto: Keith Syvinski
Indiana Michigan Power Company’s coal-fired Rockport power plant in Spencer
County, Indiana, is the 11th largest emitter of carbon dioxide pollution in the
U.S. power sector. It produces global warming pollution equivalent to that
produced by 3.2 million passenger vehicles in a year. See Table A-2 in Appendix.
By finalizing strong carbon pollution standards for
new and existing power plants, the U.S. will seize
one of its best available opportunities to significantly
reduce carbon pollution – helping to forestall the worst
impacts of global warming for future generations.
Introduction 9The Dirtiest U.S. Power Plants
Are a Major Source of Global
Warming Pollution
C
arbon dioxide is the leading greenhouse gas dirty power plants, Georgia Power’s Plant Scherer,
driving global warming, and power plants produces more global warming pollution each year
are the largest source of carbon dioxide than all the energy-related emissions of Maine.9
pollution in the United States.6 Burning fossil fuels
for electricity generation produced about 41 percent • In 2011, the 50 dirtiest U.S. power plants
of total U.S. carbon dioxide emissions in 2011.7 A were responsible for 30 percent of all U.S.
disproportionate share of these power-sector carbon power-sector emissions of carbon dioxide, 12
dioxide emissions come from a small subset of the percent of total U.S. energy-related emissions,
nation’s dirtiest power plants, particularly coal-fired and 2 percent of worldwide energy-related
power plants. However, despite their enormous emissions.10 (See Figure 1.) If the 50 dirtiest power
contribution to global warming, U.S. power plants plants were an independent nation, they would
currently face no federal limits on carbon dioxide be the seventh-largest emitter of carbon dioxide
pollution. Cleaning up these dirty power plants with pollution in the world, behind Germany and ahead
strong, nationwide pollution standards is one of the of South Korea.11 (See Figure 2.) Their emissions
most important steps the U.S. can take to curb global in 2011 were greater than half the emissions of all
warming pollution. passenger vehicles in the United States in 2010.12
(See Table 1 for additional comparisons.)
The 50 Dirtiest Power Plants Contribute
• The 100 dirtiest plants were responsible for about
a Massive and Disproportionate Share
half of total carbon dioxide emissions from the U.S.
of Carbon Dioxide Emissions
electricity sector in 2011, and more than 3 percent
There are nearly 6,000 electricity generating facilities of total worldwide emissions from energy use.13
in the United States, but most of the global warming
pollution emitted by the U.S. power sector comes • The 500 dirtiest power plants were responsible
from a handful of exceptionally dirty power plants.8 for around 90 percent of total carbon dioxide
These dirty power plants also produce a dispropor- emissions from the U.S. electricity sector, and
tionately large amount of the nation’s total global about 6 percent of total worldwide emissions from
warming pollution. For example, just one of these energy use.14
10 America’s Dirtiest Power PlantsFigure 1. The 50 Dirtiest Power Plants Contribute Significantly to U.S. Carbon Dioxide Emissions
Figure 2. Carbon Dioxide (CO2) Pollution Emitted by the 50 Dirtiest Power Plants Compared to CO2
Pollution in Other Countries (MMT)
10,000
9,000
8,000
7,000
6,000
5,000
4,000
3,000
2,000
1,000
0
China United All U.S. India Russia Japan Germany 50 Dirtiest South Canada
States Power U.S. Korea
Plants Power
Plants
The Dirtiest U.S. Power Plants Are a Major Source of Global Warming Pollution 11Table 1. Emissions Equivalencies for the Nation’s Top Emitters of Global Warming Pollution15
Total 2011 Percent of
Emissions Percent of Total Global Carbon
(Million Metric U.S. Carbon Dioxide
Tons of Carbon Dioxide Emissions from These Plants Produce Carbon Dioxide
Dioxide) Emissions Energy Use Greater Than or Equivalent To…
• The total energy-related emissions of
Top Polluting
Plant (Scherer Maine16
21 0.4% 0.1%
Power Plant, • The pollution produced by electricity use
GA) in all New England homes in a year17
• The pollution emitted by all the passen-
Top 10 ger vehicles in New York and California18
Polluting 179 3.4% 0.5%
Power Plants • The total energy-related emissions of
Venezuela19
• Half the emissions of all passenger
Top 50 vehicles in the United States20
Polluting 656 12.4% 2.0%
Power Plants • The total energy-related emission of
Texas21
• The emissions of all passenger vehicles in
Top 100 the United States22
Polluting 1,052 19.9% 3.2%
Power Plants • The pollution produced by electricity use
in all U.S. homes in a year23
The Dirtiest Power Plants Are Old and Information Administration (EIA).26 Coal plants are
Inefficient not designed to last much longer than 30 years, but
coal companies routinely renovate these plants to
Coal-fired power plants are among the biggest extend their lifetimes.27 Still, many of these plants
sources of carbon dioxide pollution in the electric are inefficient to operate, so power providers run
power sector.24 In fact, 98 of the nation’s 100 most- them at only a fraction of their full capacity or for
polluting power plants in terms of total carbon di- shorter periods of time, which results in a lower
oxide emissions are coal plants; among the top 500, “capacity factor” (the ratio of a power plant’s actual
317 (63 percent) are coal plants.25 The remainder are output compared to its full capacity) for the oldest
older oil and gas-fired power plants. (See Table A-2 and dirtiest plants. In 2009, the average capacity
in Appendix). factor for the whole U.S. coal fleet was 64 percent,
with about 40 percent reporting capacity factors
Most of the nation’s coal plants are old and inef-
below 30 percent.28
ficient. About 74 percent of U.S. coal plants were at
least 30 years old at the end of 2012, and about half Although many coal plants today are underutilized
were 40 to 60 years old, according to the Energy because of their age and inefficiency, they remain
12 America’s Dirtiest Power PlantsFigure 3. Share of Statewide Power-Sector Emissions vs. Share of Electricity Generation for Top 5
Emitters in 20 States31
46%
SD 100%
DE 49%
99%
RI 53%
99%
NH 3%
97%
VT 48% Top 5 Share
96%
MT 52%
96% of Total
NM 23%
94%
Electricity
NE 50% Generation
93%
ND 65% (2011)
93%
AK 8%
92%
ID 69%
91%
UT 78%
90% Top 5 Share
OR 46%
89%
of Total
WY 44% Power-
89%
KS 60% Sector
88%
35% Emissions
WA 88%
46% (2011)
MN 85%
40%
TN 83%
ME 11%
82%
AZ 22%
81%
0% 20% 40% 60% 80% 100%
among the worst contributors to global warming In some states, emissions from a handful of the
pollution. For example, coal-fired power plants dirtiest power plants can exceed emissions from
were responsible for nearly 80 percent of the global the rest of the economy, including the industrial
warming pollution produced by electric power and transportation sectors. For example, in five
plants in 2011, even though they produced only states – Wyoming, Montana, North Dakota, West
42 percent of the nation’s electricity.29 The 50 dirti- Virginia, and New Mexico – the five dirtiest power
est plants produced 30 percent of all power-sector plants are responsible for about half of total state-
carbon dioxide emissions, but only 16 percent of wide energy-related emissions; and in 31 states,
electricity nationwide in 2011.30 In some states, this these top polluters are responsible for at least
imbalance is even more extreme. (See Figure 3.) one-quarter of statewide energy-related emis-
sions. (See Table 2 and Table A-3 in the Appendix.)
The Dirtiest U.S. Power Plants Are a Major Source of Global Warming Pollution 13Table 2. Emissions of Top 5 Polluting Plants as a Share of Power-Sector and Statewide Total Carbon
Dioxide Emissions in 50 States, 201132
Total Emissions of Top
5 Power Plants (Million
Metric Tons of Top 5 Share of Power-
State Carbon Dioxide) Sector Emissions (2011) Top 5 Share of Total Emissions33
Wyoming 38.1 89% 59%
Montana 16.1 96% 55%
North Dakota 27.1 93% 52%
West Virginia 49.3 69% 52%
New Mexico 29.1 94% 50%
Utah 30.6 90% 49%
Arizona 43.0 81% 46%
Nebraska 24.7 93% 45%
Arkansas 32.0 92% 45%
Kansas 30.8 88% 41%
Alabama 48.1 63% 36%
Delaware 3.9 99% 36%
North Carolina 43.0 71% 36%
Missouri 50.1 62% 35%
Georgia 52.1 76% 34%
Iowa 29.7 75% 34%
Kentucky 50.4 54% 34%
South Carolina 26.3 70% 34%
Tennessee 34.4 83% 34%
Oklahoma 35.0 69% 32%
Hawaii 5.6 77% 31%
New Hampshire 4.9 97% 31%
Wisconsin 29.1 67% 29%
Maryland 18.6 80% 28%
Nevada 9.3 64% 28%
Colorado 26.2 67% 28%
Rhode Island 3.5 99% 28%
Michigan 42.8 64% 27%
Indiana 58.7 52% 27%
Minnesota 26.3 85% 27%
Mississippi 14.1 61% 25%
Ohio 54.7 50% 24%
South Dakota 2.9 100% 23%
Pennsylvania 55.7 48% 22%
14 America’s Dirtiest Power PlantsTable 2. (continued)
Total Emissions of Top
5 Power Plants (Million
Metric Tons of Top 5 Share of Power-
State Carbon Dioxide) Sector Emissions (2011) Top 5 Share of Total Emissions33
Oregon 5.9 89% 22%
Illinois 44.0 46% 19%
Virginia 16.8 60% 19%
Florida 41.7 37% 18%
Massachusetts 10.5 66% 16%
Connecticut 5.9 75% 16%
Washington 6.7 88% 15%
Louisiana 35.0 61% 12%
Maine 2.8 82% 11%
Texas 74.6 30% 10%
New Jersey 9.9 64% 10%
New York 11.0 32% 7%
Alaska 2.8 75% 6%
Idaho 0.4 91% 4%
California 7.5 19% 2%
Vermont 0.0 96% 0%
Despite the large contribution of fossil fuel-fired gases. As a result, these power plants have emitted
power plants to U.S. global warming emissions, carbon dioxide pollution unchecked for decades,
neither these highly polluting plants nor proposed and there is no guarantee that new power plants will
new power plants face any federal regulations limit- be built in ways that minimize their contribution to
ing emissions of carbon dioxide or other greenhouse global warming.
The Dirtiest U.S. Power Plants Are a Major Source of Global Warming Pollution 15Cutting U.S. Power Plant Pollution
Can Help Prevent the Worst
Impacts of Global Warming
G
lobal warming threatens our health, our plants in the United States, America can make a
safety, and our environment. Rising global meaningful difference in preventing the worst im-
average temperatures and other climate pacts of global warming.
impacts have already resulted in extreme precipita-
tion events and heat waves in the United States,
and climate science tells us that global warming will The U.S. must act now to prevent the
likely lead to further changes in weather extremes.34 worst impacts of global warming
Extreme weather events such as Hurricane Sandy, In 2007, the Intergovernmental Panel on Climate
extended droughts, heat waves, and floods caused Change (IPCC) – the world’s foremost scientific
by heavy precipitation are likely to become more authority on the subject – concluded that “warm-
common in a warming world.35 At the same time, ing of the climate system is unequivocal” and that
global warming-induced sea-level rise, changes in “[m]ost of the observed increase in global average
summer and winter precipitation patterns, and eco- temperatures since the mid-20th century is very
system changes could reduce the ability of natural likely due to the observed increase in anthropo-
and man-made systems to withstand even normal genic [greenhouse gas] concentrations.”38 In 2013, in
weather events. a draft of its upcoming Fifth Assessment Report on
climate change, the IPCC strengthened this asser-
To avoid the worst impacts of global warming,
tion, citing “near certainty” that global warming is
worldwide emissions of carbon dioxide and other
human-caused and suggesting that seas could rise
global warming pollutants will have to peak roughly
by as much as three feet by the end of the century if
three years from now, and then decline quickly and
greenhouse gas emissions continue unabated.39
dramatically – dropping by more than 50 percent by
2050.36 In the United States, addressing this chal- Clear signs of global warming have already begun
lenge means cleaning up our biggest sources of to emerge:
global warming pollution – especially dirty power
plants, which are responsible for more than 40 per- • Global average sea and air temperatures in 2010
cent of our emissions of carbon dioxide each year.37 were tied for the hottest on record, according to
the National Oceanic and Atmospheric Admin-
A handful of exceptionally dirty power plants are istration (NOAA).40 2001 to 2010 was the hottest
the worst contributors to this problem. By focusing decade on record, with average temperatures
on cleaning up power plants – our country’s largest estimated to be 0.83˚F hotter than the 1961-1990
single source of carbon pollution – and preventing norm.41 2010 was also the wettest year on record
construction of a new generation of dirty power based on global average precipitation.42
16 America’s Dirtiest Power Plants• Oceans have absorbed 80 percent of the extra • A 150 percent increase in ocean acidity above
heat in the climate system, causing ocean water to pre-industrial levels, resulting in wide-ranging,
expand.43 Coupled with melting glaciers, this has negative impacts on marine species and ecosys-
caused sea levels to rise by about eight inches – tems, with particularly severe damage to coral
with the rate of increase accelerating.44 reefs and fisheries.52
• Hurricanes have become more intense, and the • An increase of 20-30 percent in the amount of
frequency of extreme rain and snowstorms has precipitation falling during heavy rainstorms,
increased.45 increasing the risk of major flooding events in
many parts of the world.53
• At the same time, droughts in many parts of the
world have become longer and more severe, • Increasing aridity, drought and extreme tempera-
especially in the tropics and subtropics.46 tures in Africa, southern Europe and the Middle
East, and most of the Americas, Australia, and
• In the United States, warmer average annual Southeast Asia.54
temperatures are connected to increases in
extreme precipitation and more intense heat
waves. Furthermore, the U.S. has experienced an Global Warming Endangers Public
increase in the frequency and severity of extreme Health
weather events, including floods, prolonged Hotter temperatures bring about numerous threats
drought, more intense wildfires, and stronger tropi- to public health. High temperatures combine with
cal storms and hurricanes.47 sunlight, nitrogen oxides and volatile organic com-
pounds to create ozone “smog,” which damages
The more global warming pollution that humanity the respiratory system, reduces lung function, and
emits, the more serious the consequences. And the aggravates asthma and other respiratory diseases.55
changes will be largely irreversible for a thousand The Union of Concerned Scientists estimates that, by
years after emissions stop.48 2020, students in the United States could experience
more than 900,000 additional missed school days,
On our current emissions path, humanity risks in- and seniors and infants could experience more than
creasing the average global temperature by 4°C 5,000 additional hospitalizations due to increases
(7.2°F) or more (above the pre-industrial era) by the of ozone smog exposure that result from the higher
end of this century even if current emission reduc- temperatures caused by global warming.56 Higher
tion commitments and pledges are met, according to temperatures will also allow pollen allergens such
a 2012 report by the World Bank.49 Warming on this as ragweed to proliferate, causing those who suf-
scale would have catastrophic consequences, includ- fer from seasonal allergies to experience worsening
ing: symptoms, such as hay fever and asthma.57
• Sea level rise of as much as 3 feet in the next Global warming can also be expected to increase
century, causing extensive coastal inundation and the number of deaths caused by heat stress.58 Exces-
increasing the risk of storm surge flooding in major sive heat events happen when high temperatures
coastal cities.50 By 2300, global mean sea levels combine with other weather conditions – such as
could rise as high as 13 feet above present-day dew point temperature, cloud cover, wind speed and
levels.51 surface atmospheric pressure throughout the day –
Cutting U.S. Power Plant Pollution Can Help Prevent the Worst Impacts of Global Warming 17and contribute to heat-related deaths in a particular dioxide, too, is a respiratory irritant for sensitive
location.59 According to a 2012 study by the Natural populations.68 In addition, it is a major component of
Resources Defense Council (NRDC), excessive heat acid rain that has damaged forests across the eastern
events caused by global warming could kill up to United States.69
150,000 people in America’s 40 largest cities by the
end of the century.60
Cleaning Up U.S. Power Plants
Higher temperatures may also change the patterns
of occurrence of various infectious diseases. A 2009
Would Cut Carbon Pollution at
study, for example, found a correlation between a Global Scale
warmer temperatures and increased reports of infec- Humanity as a whole must limit emissions to no more
tion by West Nile Virus.61 Global warming may also than 1 trillion metric tons of carbon dioxide from
increase the risk of more frequent and more wide- 2000 through 2050 in order to have a 75 percent
spread outbreaks of waterborne illnesses by allow- chance of limiting the global temperature increase
ing warm-water pathogens to expand into cooler to 3.6° F (2° C) above the pre-industrial era – a target
climates, or by exposing more urban water bodies the international community has set to limit the most
to sewage contamination after flooding caused by severe global warming impacts.70 For the world, this
major precipitation events, according to NRDC.62 means that emissions will need to peak by 2015 and
decline by more than half by 2050 to have a chance
Increases in droughts and flooding caused by global
at preventing the worst impacts of climate change.71
warming can also reduce water available for drinking
For the United States and other developed countries,
or for irrigation; they can also harm crops directly,
emission reductions must occur more quickly and
diminishing food variety, nutritional content, and
more steeply, with reductions of at least 25 to 40 per-
availability, all of which can contribute to malnutri-
cent below 1990 levels by 2020 and 80 to 95 percent
tion and the spread of disease.63 Finally, sea-level rise
by 2050.72
and disasters such as strong storms and floods can
damage urban infrastructure and displace existing As of 2011, annual U.S. greenhouse gas emissions
communities.64 were still 10 percent above 1990 levels.73 The annual
emissions from a small group of the nation’s dirti-
Global warming pollutants are not the only emis-
est power plants are greatly hindering our ability to
sions from power plants that harm human health.
meet the emissions reduction targets necessary to
For example, in 2010, two-thirds of all airborne
avoid the worst impacts of global warming. Replac-
mercury pollution in the United States came from the
ing these power plants with zero-emission energy
smokestacks of coal-fired power plants.65 Mercury
sources such as wind and solar power, or eliminating
is a potent neurotoxicant, and exposure to mercury
the need for the power they produce through en-
during critical periods of brain development can
ergy efficiency and conservation, would reduce U.S.
contribute to irreversible deficits in verbal skills, dam-
greenhouse gas emissions to 11 percent below 1990
age to attention and motor control, and reduced IQ.66
levels, even in the absence of other efforts to reduce
Coal- and natural gas-fired power plants also emit
emissions.74
nitrogen oxides (NOX), which exacerbate ozone smog
pollution, as well as other pollutants that contrib- Limiting carbon dioxide pollution from new and ex-
ute to particulate matter and acid rain. Like smog, isting power plants is one of the most effective ways
particulate matter pollution contributes to a host to reduce U.S. global warming pollution in the short
of respiratory and cardiovascular ailments.67 Sulfur run and for decades to come, reducing the risk that
18 America’s Dirtiest Power Plantsemissions will reach a level that triggers dangerous, local, state and federal policies to increase energy
irreversible climate change impacts. efficiency, deploy clean energy technologies and
improve public transportation, the United States
Adopting federal limits on carbon dioxide pollution
could curb emissions of carbon dioxide from en-
from power plants as part of a suite of policies to
ergy use by as much as 3.5 percent below 1990
reduce global warming pollution at all levels of gov-
levels by 2020 and 20 percent below 1990 levels
ernment would help the United States achieve 2020
by 2030.75 A nationwide cap on carbon pollution
emissions reduction targets – even in the absence
from all sources – not just power plants – would al-
of a federal, economy-wide cap on carbon pollu-
low the United States to make the remaining emis-
tion. For example, Environment America Research
sions reductions necessary to prevent the worst
& Policy Center’s 2011 report, The Way Forward on
impacts of global warming.
Global Warming, demonstrated that with a suite of
Cutting U.S. Power Plant Pollution Can Help Prevent the Worst Impacts of Global Warming 19Carbon Pollution Standards
Are Needed to Clean Up
Existing Power Plants
T
he unprecedented threat that global warm- larger to 1,000 pounds of CO2 per megawatt-hour
ing poses to our health, our safety and our (MWh) of electricity they produce.79 According to
environment demands that the United the EPA, this standard was based on commonly
States takes urgent action to reduce emissions of used combined-cycle natural gas power plants – a
global warming pollution. However, U.S. power standard that new coal plants are highly unlikely to
plants currently face no federal limits on the amount meet.80 Existing coal plants produce an average of
of carbon dioxide pollution they can emit. 2,180 lbs CO2/MWh, with the worst plants producing
more than 3,000 lbs CO2/MWh.81
Given the enormous share of global warming pollu-
tion contributed by U.S. power plants, limiting car- The EPA has yet to propose a standard for existing
bon dioxide emissions from both new and existing power plants, a large portion of which are aging
power plants must be a key part of any strategy to coal-fired plants. However, the president has directed
reduce U.S. global warming emissions. Fortunately, the EPA to propose and submit carbon pollution
the first steps toward setting these standards are limits for existing plants by June 2014 and to finalize
already being taken. On June 25, 2013, President those limits the following year.82 (See “The Long Road
Obama announced his plan to address global warm- to Carbon Pollution Limits” on page 21.)
ing through executive action, using existing statu-
Some states already limit carbon pollution from pow-
tory authority and funds.76 The two most important
er plants. California has an economy-wide cap on car-
elements of this plan are finalizing carbon emissions
bon dioxide emissions, and nine states from Maine
standards for new power plants and directing the
to Maryland participate in the Regional Greenhouse
EPA to quickly propose and implement a limit on
Gas Initiative (RGGI), which caps pollution from
existing plants.77
power plants in the Northeast. Once finalized, the
The EPA proposed a limit on new power plants EPA’s carbon pollution limits for all new power plants
in March 2012. Since then, the EPA has received nationwide would go a long way toward reducing
more than 3.2 million public comments supporting future U.S. global warming pollution. However, the
limiting carbon pollution from power plants, and agency must also move quickly to establish strong
President Obama has asked the EPA to re-propose a federal standards for existing power plants – and
carbon pollution standard for new power plants by force the nation’s largest sources of carbon pollution
September 20, 2013.78 to clean up.
The originally proposed limit restricts global warm-
ing pollution for facilities 25 megawatts (MW) or
20 America’s Dirtiest Power PlantsThe Long Road to Carbon Pollution Limits
The Obama administration’s recent actions indicating progress toward carbon dioxide pollution
from power plants are the culmination of a 14-year campaign to clean up the nation’s power
plants. In 1999, one year after the EPA declined to include carbon dioxide pollution limits in new
vehicle emissions standards, 19 environmental and public interest groups petitioned the EPA to
classify carbon dioxide as an air pollutant subject to the Clean Air Act regulation.83 They cited car-
bon dioxide’s contribution to global warming – which threatens human health and the environ-
ment – as rationale for regulation.84
In 2003, the EPA released an official statement that it did not believe the Act authorized the EPA
to regulate global warming pollution, and that even if it did authorize regulating greenhouse
gases, the EPA objected to doing so on policy grounds.85 However, the U.S. Supreme Court dis-
agreed with the EPA in 2007, ruling with several states and environmental groups that the EPA
does indeed have the authority to regulate greenhouse gases, and that its policy objections were
insufficient to decline to regulate.86 The court also directed the EPA to determine if greenhouse
gases contribute to global warming and, if so, whether global warming endangered public health
and welfare.87 By the end of 2009, the EPA officially determined that emissions of carbon dioxide
endanger public health and welfare by contributing to global warming.88
In December 2010, the EPA announced its plan to release new performance standards and manda-
tory emissions guidelines for all new fossil fuel-fired power plants.89 The EPA proposed an interim
carbon pollution standard for new power plants in April 2012 that is in effect until a rule can be
finalized.90 This step set the first-ever national limits on the amount of carbon pollution power
plants can emit.91
Carbon Pollution Standards Are Needed to Clean Up Existing Power Plants 21Policy
Recommendations
To protect our health, our economy, In addition to cutting pollution from
and our environment from the dangers power plants, the United States
of global warming, America must clean should adopt a suite of clean energy
up its dirtiest power plants. policies at the local, state, and
federal level to curb emissions of
• The Obama Administration should set strong carbon dioxide from energy use in
limits on carbon dioxide pollution from new other sectors.
power plants to prevent the construction of a new
generation of dirty power plants, and force exist- In particular, the United States should prioritize
ing power plants to clean up by setting strong establishing a comprehensive, national plan to
limits on carbon dioxide emissions for all existing reduce carbon pollution from all sources – includ-
power plants. ing transportation, industrial activities, and the
commercial and residential sectors.
ºº New plants – The EPA should work to meet its
September 2013 deadline for re-proposing a Other policies to curb emissions include:
stringent emissions standard for new power
• Retrofitting three-quarters of America’s
plants. It should also set a deadline for finalizing
homes and businesses for improved energy
these standards no later than June 2015.
efficiency, and implementing strong building
energy codes to dramatically reduce fossil fuel
ºº Existing plants – The EPA should work to meet
consumption in new homes and businesses.
the timeline put forth by President Obama for
proposing and finalizing emissions standards • Adopting a federal renewable electricity
for existing power plants. This timeline calls for standard that calls for 25 percent of America’s
limits on existing plants to be proposed by June electricity to come from clean, renewable
2014 and finalized by June 2015.92 The stan- sources by 2025.
dards should be based on climate science and
designed to achieve the emissions reductions • Installing more than 200 gigawatts of solar
targets that are necessary to avoid the worst panels and other forms of distributed renew-
impacts of global warming. able energy at residential, commercial and
industrial buildings over the next two decades.
• Strengthening and implementing state energy
efficiency resource standards that require utili-
ties to deliver energy efficiency improvements
in homes, businesses and industries.
22 America’s Dirtiest Power Plants• Encouraging the use of energy-saving combined and reducing per-mile global warming pollution
heat-and-power systems in industry. from transit vehicles. The U.S. should also build
high-speed rail lines in 11 high-priority corridors
• Setting strong energy efficiency standards for by 2030.
household appliances and commercial equip-
ment, and promoting the use of energy-efficient • Carrying out President Obama’s Executive Order
boilers, process heat systems, and energy-saving 13514, which requires large reductions in global
combined heat-and-power in industrial facilities. warming pollution from federal agencies.
• Facilitating the deployment of millions of plug-in • Rejecting proposals to increase our access to
vehicles that operate partly or solely on electric- and use of carbon-intensive fuels, including
ity, and adopting clean fuel standards that require current proposals to import tar sands oil from
a reduction in the carbon intensity of transporta- Canada via the Keystone XL pipeline and to
tion fuels. The U.S. should also adopt strong fuel open more land to hydraulic fracturing for shale
economy standards for heavy-duty trucks. oil and natural gas.
• Ensuring that the majority of new residential and
• Strengthening and expanding the Regional
commercial development in metropolitan areas
Greenhouse Gas Initiative, which limits carbon
takes place in compact, walkable communities
dioxide pollution from power plants in nine
with access to a range of transportation options.
northeastern states, and implementing Califor-
• Expanding public transportation service to nia’s Global Warming Solutions Act (AB32),
double ridership by 2030, encouraging further which places an economy-wide cap on the
ridership increases through better transit service, state’s greenhouse gas emissions.
Policy Recommendations 23Methodology
I
n this report we examine emissions of carbon di- fuels are already part of the non-fossil portion of
oxide from all utility and non-utility power plants the world’s carbon cycle.
within the United States in 2011. We derive emis-
sions data from fuel consumption figures reported to • We multiplied fuel consumption in terms of
the U.S. Department of Energy and estimates of the heat content by the appropriate carbon dioxide
carbon content of each fuel source developed by the emissions factors, yielding an estimate of 2011
U.S. Environmental Protection Agency. Details follow. carbon dioxide emissions by plant. Using database
tools, we sorted or aggregated the data in various
• We obtained fuel consumption and electricity ways to generate the facts in this report. Our
generation data for power plants operating in methodology resulted in a value for 2011 carbon
the United States from the U.S. Department of dioxide pollution from the power sector very
Energy’s Energy Information Administration (EIA), similar to that listed in the EPA’s 2011 greenhouse
2011 December EIA-923 Monthly Time Series.93 gas emissions inventory (see above); our analy-
We focused on fuel consumption for electricity sis resulted in a value of 2,202 MMT of carbon
generation, excluding any fuel consumption for dioxide from all U.S. power plants, while the EPA’s
the purposes of generating heat. emissions inventory gave a value of 2,159 MMT of
carbon dioxide emissions from the power sector
• We obtained estimates of the carbon dioxide – a difference of less than 2 percent. EIA’s 2011
emissions created per unit of energy output of the Annual Energy Review lists a value of 2,166 MMT of
different fuels used in electricity generation from carbon dioxide emitted by power plants in 2011.94
the U.S. Environmental Protection Agency, Center
for Climate Leadership, Emission Factors for Green- • We chose to estimate 2011 carbon dioxide pollu-
house Gas Inventories, November 2011; and U.S. tion based on plant-level energy consumption
Environmental Protection Agency, Inventory of U.S. data because EIA’s Form 923 database (which
Greenhouse Gas Emissions and Sinks: 1990-2011, contains such data) includes information on a
April 2013. Table 3 lists these coefficients. For all broader range of power plants than the EPA’s Air
biomass fuels, including wood waste and the Markets Program Data, which provides estimates
biogenic fraction of municipal solid waste, we of carbon dioxide emissions for a subset of large
assigned an emissions value of zero, since these electric power plants.95
24 America’s Dirtiest Power PlantsTable 3: Carbon Dioxide Emission Coefficients
Emission Coefficient
Category Fuel
(Kg CO2 / MMBtu)
Coal Bituminous 93.40
Coal Lignite 96.36
Coal Sub-Bituminous 97.02
Coal Waste Coal 96
94.38
Coal Coal-Derived Synthesis Gas97 94.38
Coal Anthracite 103.54
Coal Coal-Based Synfuel 98
92.91
Petroleum Products Distillate Fuel Oil99
73.15
Petroleum Products Jet Fuel 72.22
Petroleum Products Kerosene 75.20
Petroleum Products Petroleum Coke 102.41
Petroleum Coke-Derived
Petroleum Products 102.41
Synthesis Gas100
Petroleum Products Residual Fuel Oil101 78.80
Petroleum Products Propane 61.46
Petroleum Products Waste Oil 102
66.53
Natural Gas and other gases Natural Gas 103
53.02
Natural Gas and other gases Blast Furnace Gas104 274.32
Natural Gas and other gases Other Fossil-Fuel Gas105 59.00
Other Purchased Steam 106
88.18
Other Tire-Derived Fuels107 85.97
Municipal Solid Waste - Non-
Other 90.70
Biogenic Fraction
Methodology 25Appendices
Table A-1. Power Plant Carbon Dioxide Emissions as a Share of Total State-Level Emissions (MMT),
2010108
Total Power
Percentage Estimated Share Sector Emissions
Total of of Statewide Equivalent
Electric Statewide Statewide Emissions in Number
Power Energy- Emissions Contributed by Top of Passenger
Sector Related from Power 5 Emitting Power Vehicles
State Emissions Emissions Plants Plants± (Millions)109
Alabama 76.7 132.7 58% 36% 16.0
Alaska 3.0 38.7 8% 6% 0.6
Arizona 54.4 95.9 57% 46% 11.3
Arkansas 32.3 66.1 49% 45% 6.7
California 43.5 369.8 12% 2% 99.1
Colorado 39.9 96.5 41% 28% 8.3
Connecticut 7.7 36.9 21% 16% 1.6
Delaware 4.2 11.7 36% 36% 0.9
District of Columbia 0.2 3.3 6% 6% 0.0
Florida 119.6 246.0 49% 18% 24.9
Georgia 79.1 173.7 46% 34% 16.5
Hawaii 7.6 18.9 40% 31% 1.6
Idaho 0.7 16.2 4% 4% 0.1
Illinois 94.0 230.4 41% 19% 19.6
Indiana 114.3 219.1 52% 27% 23.8
Iowa 40.6 88.7 46% 34% 8.5
Kansas 35.4 75.0 47% 41% 7.4
Kentucky 94.2 150.7 63% 34% 19.6
Louisiana 42.6 223.5 19% 12% 8.9
Maine 2.6 18.5 14% 11% 0.5
Maryland 24.9 70.5 35% 28% 5.2
Massachusetts 18.2 73.0 25% 16% 3.8
Michigan 70.4 165.9 42% 27% 14.7
Minnesota 29.3 93.4 31% 27% 6.1
Mississippi 26.4 65.5 40% 25% 5.5
Missouri 76.0 135.7 56% 35% 15.8
Montana 19.8 34.9 57% 55% 4.1
Nebraska 23.1 48.0 48% 45% 4.8
26 America’s Dirtiest Power PlantsContined from page 26
Table A-1. Power Plant Carbon Dioxide Emissions as a Share of Total State-Level Emissions
(MMT), 2010108
Total Power
Percentage Estimated Share Sector Emissions
Total of of Statewide Equivalent
Electric Statewide Statewide Emissions in Number
Power Energy- Emissions Contributed by Top of Passenger
Sector Related from Power 5 Emitting Power Vehicles
State Emissions Emissions Plants Plants± (Millions)109
Nevada 16.8 38.1 44% 28% 3.5
New Hampshire 5.4 17.0 32% 31% 1.1
New Jersey 17.7 115.4 15% 10% 3.7
New Mexico 29.0 54.8 53% 50% 0.6
New York 38.1 172.8 22% 7% 7.9
North Carolina 72.2 142.9 51% 36% 15
North Dakota 29.5 52.5 56% 52% 6.2
Ohio 120.8 249.1 48% 24% 25.2
Oklahoma 47.4 103.4 46% 32% 9.9
Oregon 9.8 40.3 24% 22% 0.2
Pennsylvania 119.6 256.6 47% 22% 24.9
Rhode Island 3.1 11.0 28% 28% 0.6
South Carolina 40.9 84.0 49% 34% 8.5
South Dakota 3.5 15.1 23% 23% 0.7
Tennessee 43.3 107.1 40% 34% 0.9
Texas 220.4 652.6 34% 10% 45.9
Utah 34.8 64.2 54% 49% 7.2
Vermont 0.0 6.0 0% 0% 0.0
Virginia 34.3 109.8 31% 19% 7.1
Washington 13.1 76.1 17% 15% 2.7
West Virginia 74.3 98.9 75% 52% 15.5
Wisconsin 42.6 99.2 43% 29% 8.9
Wyoming 42.8 64.9 66% 59% 8.9
Total* 2,240.0 5,631.3 40% 24% 466.7
* For the emissions of the United States as a country see, U.S. Energy Information Administration, Monthly Energy Review,
Section 12: Environment, August 2013. Differing methodologies between that data series and the state-by-state data list-
ed here causes the total for all states to be slightly different from the national-level estimate. The amount varies no more
than 0.5 percent. NOTE: The District of Columbia is included in the data tables, but not in the analysis as it is not a state.
± Estimates obtained by multiplying Emissions for Top 5 as a Share of Power-Sector Total (2011) by Emissions for Power-
Sector as a Share of Statewide Total (2010). U.S. EIA does not have state-by-state data on power-sector emissions from
2011. See Table A-3.
Appendices 27Table A-2. The Nation’s 100 Most-Polluting Power Plants, Carbon Dioxide Emissions Equivalent in
Passenger Vehicles and Primary Fuel Category, 2011
Rank State Emissions Emissions Equivalent
Primary Fuel (Million Metric in Passenger Vehicles
Operator Name Plant Name Category Tons)112 (Millions)113
1 GA Georgia Power Co. Scherer Coal 21.3 4.44
2 AL Alabama Power Co. James H. Miller Jr. Coal 20.7 4.3
3 TX Luminant Generation Martin Lake Coal 18.8 3.91
Company, LLC
4 MO Union Electric Co. (MO) Labadie Coal 18.5 3.85
5 TX NRG Texas Power, LLC W. A. Parish Coal 17.8 3.71
6 IN Duke Energy Indiana Inc. Gibson Coal 16.9 3.53
7 OH Ohio Power Co. General James M. Coal 16.6 3.46
Gavin
8 PA FirstEnergy Generation Corp. FirstEnergy Bruce Coal 16.4 3.41
Mansfield
9 MI Detroit Edison Co. Monroe Coal 16.4 3.41
10 AZ Salt River Project Navajo Coal 15.9 3.32
11 IN Indiana Michigan Power Co. Rockport Coal 15.4 3.22
12 KS Westar Energy Inc. Jeffrey Energy Coal 14.7 3.05
Center
13 GA Georgia Power Co. Bowen Coal 14.2 2.97
14 WV Appalachian Power Co. John E. Amos Coal 13.9 2.89
15 NM Arizona Public Service Co. Four Corners* Coal 13.8 2.88
16 NC Duke Energy Carolinas, LLC Belews Creek Coal 13.8 2.87
17 TX Luminant Generation Monticello Coal 13.7 2.85
Company, LLC
18 MT PPL Montana, LLC Colstrip Coal 13.6 2.82
19 TX NRG Texas Power, LLC Limestone Coal 13.3 2.77
20 LA Louisiana Generating LLC Big Cajun 2 Coal 13.2 2.75
21 MN Northern States Power Co. – Sherburne Coal 13.1 2.73
Minnesota County
22 SC South Carolina Public Service Cross Coal 12.9 2.69
Authority
23 WY PacifiCorp Jim Bridger Coal 12.9 2.68
24 IL Dynegy Midwest Generation Baldwin Energy Coal 12.8 2.67
Inc. Complex
25 OH Dayton Power & Light Co. J. M. Stuart Coal 12.7 2.66
26 KY Kentucky Utilities Co. Ghent Coal 12.7 2.65
27 TN Tennessee Valley Authority Cumberland Coal 12.4 2.57
28 WY Basin Electric Power Coop Laramie River Coal 12.2 2.54
Station
29 UT Los Angeles Department of Intermountain Coal 12.0 2.51
Water & Power Power Project*
30 KY Tennessee Valley Authority Paradise Coal 12.0 2.49
*Indicates that this power plant is scheduled for retirement.110
28 America’s Dirtiest Power PlantsContined from page 28
Table A-2. The Nation’s 100 Most-Polluting Power Plants, Carbon Dioxide Emissions Equivalent in
Passenger Vehicles and Primary Fuel Category, 2011
Rank State Emissions Emissions Equivalent
Primary Fuel (Million Metric in Passenger Vehicles
Operator Name Plant Name Category Tons)112 (Millions)113
31 IA MidAmerican Energy Co. Walter Scott Jr. Coal 11.7 2.43
Energy Center*
32 NC Progress Energy Carolinas Inc. Roxboro Coal 11.6 2.42
33 NM Public Service Co. of NM San Juan* Coal 11.5 2.4
34 AZ Tucson Electric Power Co. Springerville Coal 11.5 2.39
35 AR Entergy Arkansas Inc. Independence Coal 11.1 2.3
36 TX Southwestern Electric Power Welsh* Coal 11.0 2.29
Co.
37 TX Lower Colorado River Authority Fayette Power Coal 10.9 2.26
Project
38 TX Oak Grove Management Co., Oak Grove Coal 10.8 2.26
LLC
39 OH FirstEnergy Generation Corp. FirstEnergy W. H. Coal 10.6 2.2
Sammis
40 PA Allegheny Energy Supply Co., Hatfields Ferry Coal 10.5 2.18
LLC Power Station*
41 WV Allegheny Energy Supply Co., FirstEnergy Coal 10.4 2.16
LLC Harrison Power
Station
42 AR Entergy Arkansas Inc. White Bluff Coal 10.4 2.16
43 AL Alabama Power Co. E. C. Gaston Coal 10.3 2.14
44 FL Progress Energy Florida Inc. Crystal River* Coal 10.2 2.13
45 NC Duke Energy Carolinas, LLC Marshall Coal 10.1 2.09
46 IN Indianapolis Power & Light Co. AES Petersburg Coal 10.0 2.09
47 PA GenOn Northeast Management Keystone Coal 10.0 2.08
Company
48 PA GenOn Northeast Management Conemaugh Coal 9.9 2.06
Company
49 IL Midwest Generations EME, LLC Powerton Coal 9.8 2.04
50 NE Nebraska Public Power District Gerald Gentleman Coal 9.3 1.94
51 OK Oklahoma Gas & Electric Co. Muskogee Coal 9.2 1.92
52 FL Tampa Electric Co. Big Bend Coal 9.2 1.91
53 KY Louisville Gas & Electric Co. Mill Creek Coal 9.1 1.89
54 PA Midwest Generations EME, LLC Homer City Station Coal 9.0 1.87
55 CO Tri-State G & T Assn., Inc. Craig Coal 9.0 1.87
56 KY East Kentucky Power Coop, Inc. H. L. Spurlock Coal 8.9 1.86
57 ND Great River Energy Coal Creek Coal 8.8 1.84
58 NE Omaha Public Power District Nebraska City Coal 8.7 1.82
59 PA PPL Brunner Island, LLC PPL Brunner Island Coal 8.6 1.79
60 OK Public Service Co. of Oklahoma Northeastern* Coal 8.6 1.79
*Indicates that this power plant is scheduled for retirement.110
Appendices 29You can also read