Baltic Sea Regional Investment Plan - August 2020 Draft version prior to public consultation
←
→
Page content transcription
If your browser does not render page correctly, please read the page content below
Ten-Year
Network
              Regional Investment Plan
              Baltic Sea
Development
Plan 2020

              August 2020 · Draft version prior to public consultation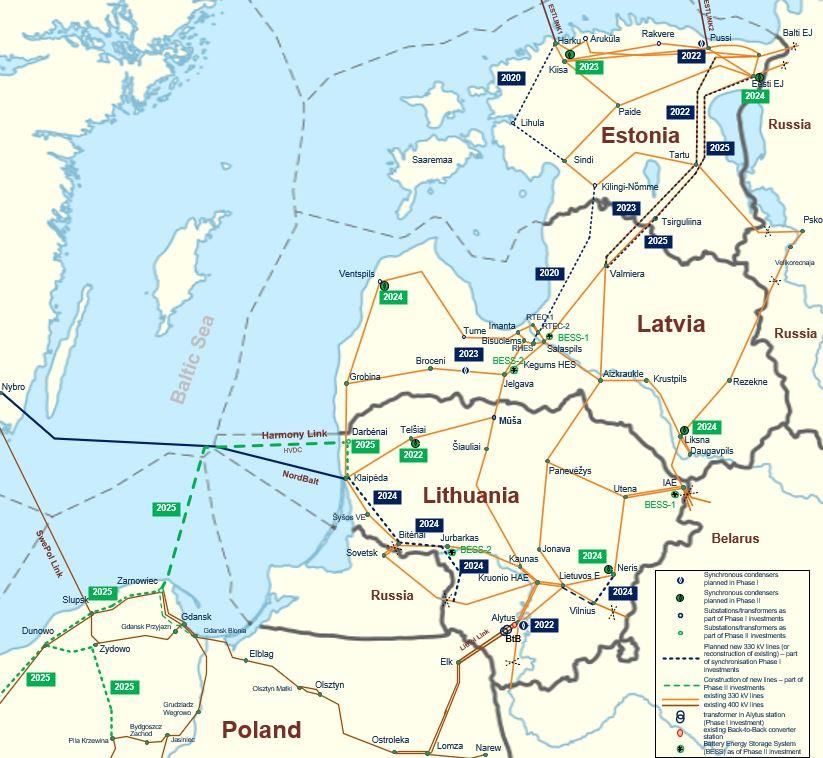
Regional Investment Plan 2020 – Baltic Sea

                                                                        Table of Contents

1. EXECUTIVE SUMMARY.............................................................................................. 3

     1.1 Key messages of the region ........................................................................................................................................................ 3
     1.2    Future capacity needs ........................................................................................................................................................... 5

2          .INTRODUCTION .................................................................................................... 7

     2.1         Regional Investment Plans as foundation for the TYNDP 2020 ............................................................................... 7
     2.2         Legal requirements................................................................................................................................................................. 8
     2.3         Scope and structure of the Regional Investment Plans ................................................................................................ 8
     2.4         General methodology ........................................................................................................................................................ 10
     2.5         Introduction to the region ................................................................................................................................................. 10
     2.6         Evolution since the RegIP 2017...................................................................................................................................... 11

3.         REGIONAL CONTEXT .......................................................................................... 13

     3.1     Present situation ................................................................................................................................................................... 13
         3.1.1     The transmission grid in the Baltic Sea region .................................................................................................. 13
         3.1.2     Power generation, consumption and exchange in the Baltic Sea region...................................................... 15
         3.1.3     Grid constraints in the Baltic Sea region ............................................................................................................ 19
     3.2 Description of the scenarios ..................................................................................................................................................... 20
         3.2.1 Selective description of electricity results .................................................................................................................. 22
         3.2.2     Key findings of the scenarios for the Baltic Sea region. .................................................................................. 26
         3.2.3     Technical challenges of the power system ......................................................................................................... 29

4          . REGIONAL RESULTS ......................................................................................... 32

     4.1         Future capacity needs ......................................................................................................................................................... 32
     4.2         Market results of IoSN 2040............................................................................................................................................ 36

5.         Additional Regional Studies and MAF study ............................................................ 43

     5.1 Baltic synchronisation ............................................................................................................................................................... 43
     5.2 ENTSO-E Mid Term Adequacy Forecast (MAF) 2019.................................................................................................... 46
     5.3    Challenges and opportunities for the Nordic power system...................................................................................... 48
     5.4     Nordic Grid Development Plan 2019 ............................................................................................................................ 49

Appendices....................................................................................................................... 51

     Appendix 1. Links to the National Development Plans ........................................................................................................... 51
     Appendix 2.      Projects .............................................................................................................................................................. 52
       Pan-European projects ............................................................................................................................................................... 52
       Regional projects ........................................................................................................................................................................ 53
     Appendix 3.      Abbreviations ................................................................................................................................................... 66
     Appendix 4. Glossary ....................................................................................................................................................................... 67

ENTSO-E | Rue de Spa, 8 | 1000 Brussels | info@entsoe.eu | www.entsoe.eu | @entso_e                                                                                                  Page 2 of 71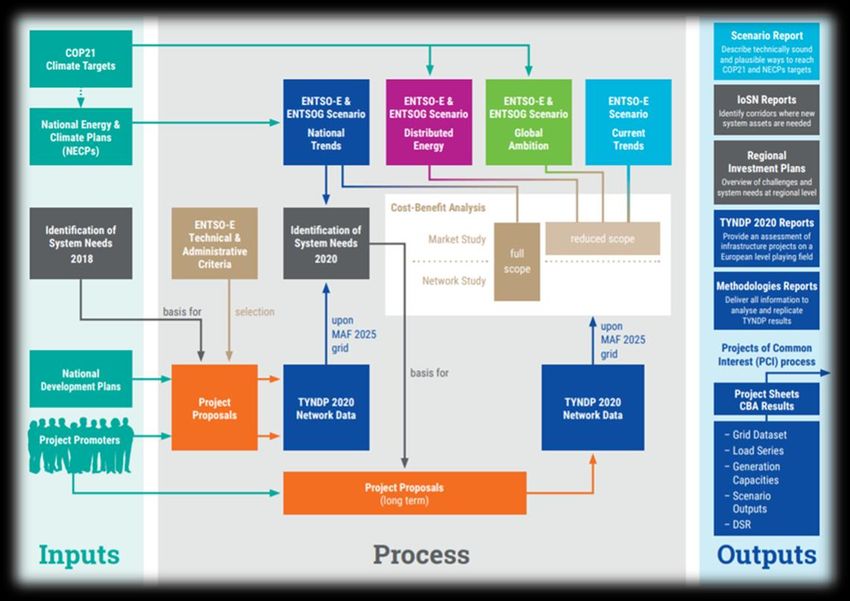
Regional Investment Plan 2020 – Baltic Sea

1. EXECUTIVE SUMMARY

1.1 Key messages of the region
The electricity system in the Baltic Sea region is undergoing an unprecedented change as the electricity
generation structure is rapidly decarbonising and is simultaneously becoming more variable according to the
weather conditions.

Construction of renewable energy in the region has been accelerated by rapid technology development and
national subsidy mechanisms. In particular, the increase in wind power production has reduced the price of
electricity. The energy surplus created on the market has lowered the price of electricity, and the profitability
of traditional generation has also weakened significantly, which has resulted in the closure of adjustable
production capacity. This development has reduced carbon dioxide emissions, but it has also increased the
risk of brownouts or blackouts in the parts of the region as it has been identified in the MAF 2019 study issued
by ENTSO-E previous year. At the same time, society’s dependency on electricity is increasing. As a result, the
power systems of the future might be expected to provide even greater reliability in order to safeguard the
vital functioning of society.

Large quantities of new renewable energy
generation are still being planned across the
region, and these must be integrated
successfully while also maintaining security of
supply and facilitating an efficient and secure
European energy market. The integration of
renewables will further replace production
from thermal power plants and the grid
needs to facilitate the flows to cover the
deficit at the load centres due to closure of
power plants and the growing flows between
synchronous areas. In order to solve the
challenges regarding balancing the load and
power generation in all parts of the region
further grid development is favourable and
necessary. As the future generation-mix is
expected to be much more weather-
dependent, this increases the need of
strengthening the grid.
                                                                   Figure 1-2 – Key drivers of the Baltic Sea region

The main driver for the energy system in the region is the green energy transition along with climate goals
and decarbonization-goals. From a grid development perspective, the drivers within the Baltic Sea region are
as follows.

Driver 1: Need for flexibility → Further integration between synchronous areas

ENTSO-E | Rue de Spa, 8 | 1000 Brussels | info@entsoe.eu | www.entsoe.eu | @entso_e                              Page 3 of 71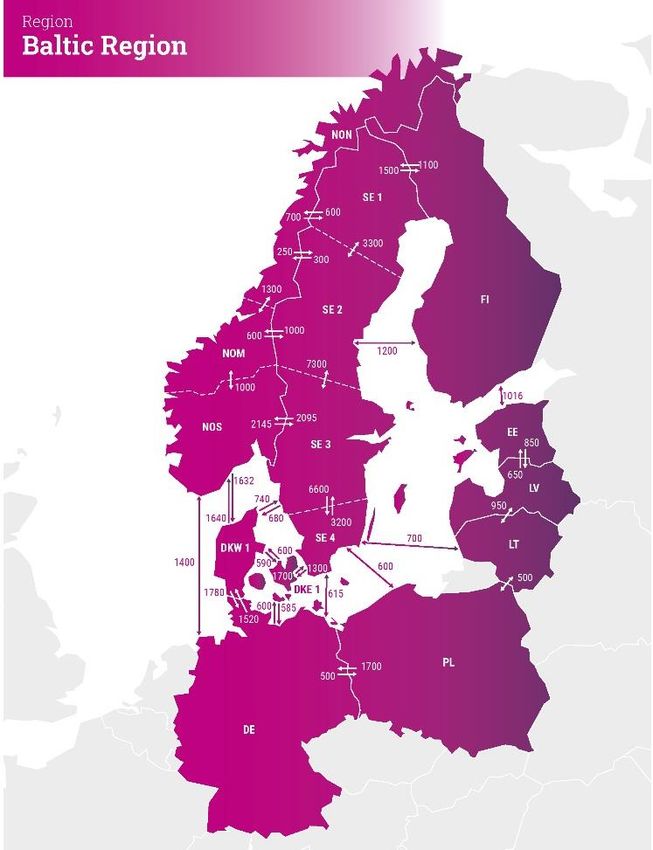
Regional Investment Plan 2020 – Baltic Sea

The transformation of the European power system leads to a less flexible generation-mix. The Nordic system
continues to be a flexible system, due to the hydro-dominated generation-mix. In addition, the Nordic system
is likely to increase the annual energy surplus, even though some nuclear power plants are decommissioned.
Both the flexibility-need and the expected price-differences between the systems, seem to be a driver for
further integration between different synchronous systems. In continental low wind-situations energy might
be exported from the Nordic system, in continental high wind-situations power might be imported and stored
in the hydro-dominated Nordic system.

Driver 2: Integration of renewables → Increased North-South flows

Based on the political goals of reduced CO2 emissions, and based on the cost development of wind and solar
generation units, further integration of renewables is expected within the Nordic countries. In Germany large
amounts of solar is already seen today and is expected to further increase. In Germany, Denmark and Sweden
large amounts of onshore wind is already integrated. Next to come seems to be offshore wind, with huge
potential in the Baltic Sea region. New interconnectors to the continent/Baltic States in combination with
substantial amounts of new renewable generation capacity is increasing the need to strengthen the
transmission capacities in the North-South direction in Germany, Sweden, Norway, Finland and Denmark. In
addition, nuclear and/or thermal plants are expected to be decommissioned in southern Germany, Sweden,
Denmark and Finland, which further increase the capacity-need in the North-South direction.

Driver 3: Electrification / New consumption → reinforcements of the grid

Based on European climate goals, the European energy system is supposed to be much more efficient. This
means more efficient use of energy both within industry, transport and households, as well as solutions
lowering the energy consumption. As a result of this the total energy demand for Europe is expected to
decrease. At the same time electrification of all kind of consumption plays the major role of this
transformation towards a much more efficient and decarbonised system. In addition, new type of
consumption like data-storage increases the electricity-consumption. For the coming decades the energy-
consumption is expected to decrease while the electricity-consumption is expected to increase. Due to this
increased electricity-consumption and due to the electrification huge reinforcements of the grid might be
necessary.

Driver 4: Baltic integration → Improved security of supply for the Baltic system

For historical reasons, the Baltic States are currently operated in synchronous mode with the Russian and
Belarussian electricity systems (the IPS/UPS system). During the last years, the integration of Baltic countries
with European energy markets has made great progress with the commissioning of the NordBalt and LitPol
link. Baltic countries are now connected to Finland, Sweden and Poland via HVDC connections.

The three Baltic TSOs are now preparing to de-synchronise from IPS/UPS, and instead to synchronise with the
Continental European Network (CEN) through current interconnection between Lithuania and Poland. In
addition, a new subsea HVDC (Harmony Link) is planned between Lithuania and Poland to improve the level
of security of supply. Synchronisation of Baltic countries with the CEN will ensure energy security by
connection to a grid that is operated following joint European rules.

Driver 5: Nuclear and thermal decommissioning → Challenges the security of supply

All nuclear power plants in Germany, a substantial proportion of the thermal/nuclear power plants in Sweden,
and a substantial proportion of the thermal power plants in Germany, Denmark and Finland are expected to
be decommissioned by 2030. Furthermore, decommissioning of thermal power plants, especially in Poland,

ENTSO-E | Rue de Spa, 8 | 1000 Brussels | info@entsoe.eu | www.entsoe.eu | @entso_e                   Page 4 of 71
Regional Investment Plan 2020 – Baltic Sea

is needed to achieve the EU’s climate targets. Decommissioning of both nuclear and thermal power plants
would lead to an increased system-risk, challenging the security of supply. Nuclear and thermal power has
many important features in today’s system, and a phase-out will require new generation capacity, grid
development, and further development of system services.

Driver 6: Smart sector integration and flexible loads → Optimises the decarbonisation

Sector integration and demand response and flexible loads are core instruments to cut emissions in a cost-
effective way. Smart Sector Integration (SSI) seeks the optimal solution for the whole energy system and
supports a fast and cost-optimised path to zero emissions by 2050. Electricity would be used either directly
in other sectors (e.g. transportation and heating in buildings and industry) or to produce green hydrogen.
Hydrogen may in turn be used directly in transportation, heating, and even power generation (e.g. in hours
of scarcity) or to produce methane, fuels or ammonia etc. The benefits of SSI arise from the variable character
and the falling costs of wind and solar power. In addition to cut emissions in a more cost-effective way, SSI
as well provide flexibility between different energy systems. This again increases the security of supply-level
in the power system. Flexible loads and demand response will help to optimize the dimensioning and
operation of the power system. Flexibility markets may be used in the future to solve bottlenecks in the
system.

1.2 Future capacity needs
The drivers for grid development described above are the basis for further grid developments. The grid
development needs in the short term can be studied by analysing the current measurements, trends and
plans of generation as well as consumption changes. The grid infrastructure is a long-term investment with a
lifetime of tens of years; building a new line, for example, can take a decade or more, particularly when
factoring in all the necessary planning and permitting. Therefore, it is important to be able to consider the
benefits of the new infrastructure in the long term. It is not meaningful to try to forecast the future as ‘one
truth’, because small changes, such as in policies or fuel prices, can have a major impact on the resulting view
of the future.

Additionally, to the main drivers described above in the list below are given the key messages which explains
the future capacity needs and the positive effect of transmission grid expansion towards 2050:

     •    The green energy transition along with climate goals and decarbonization will lead to fundamental
          change of generation and energy demand, which triggers changed power flows across the region.
          The dominant power flow direction will go from North to South.

     •    Rapid expansion of both onshore and offshore renewables in the region and decommissioning of
          nuclear generation in Germany until end of 2022 and potentially in Sweden by 2040 triggers related
          offshore and onshore infrastructure needs.

ENTSO-E | Rue de Spa, 8 | 1000 Brussels | info@entsoe.eu | www.entsoe.eu | @entso_e                   Page 5 of 71
Regional Investment Plan 2020 – Baltic Sea

     •    Flexibility is challenged; however, Sector Integration and demand response will be a part of the
          solutions in combination with hydro resources. (Electrification and load increase is expected to keep
          in line with the development in industrial and transport.)

     •    The above requires new interconnectors, some of them are already in preparation or under
          construction (NO-DE, SE-FI e.t.c.) and will also help IEM, SoS, RES integration. The continued strong
          collaboration between the actors in the region is needed and the actors are responsible for the timely
          implementation of the interconnectors.

     •    Baltic countries will be synchronized with Continental Europe by 2025, but security of supply will need
          to be further enhanced. The med-term system adequacy issue (SoS) in Baltic States, is mainly related
          to flexibility needs after desynchronization from IP/UPS and synchronization with the CEN.

All the scenarios being studied in the Identification of System Needs (IoSN) include a large increase in
renewable generation and a decrease in CO2 emissions, but without additional grid development the price
spread between market areas in the region would increase rapidly and some of the climate benefits would
not be realised. The benefits of increased capacities in the scenarios are clearly visible in the Chapter 4 where
the market results of IoSN have been described. Increasing the capacities at the borders, would have a
significant impact on both the electrical system and on society. In summary, the main benefits of satisfying
the identified capacity needs, if the scenarios end up realising the summarised results, are shown below:

     ✓    Up to 50 € per MWh reduction in marginal costs;

     ✓    From 46 to 80 TWh less curtailed energy;

     ✓    A 10 MT reduction in CO2 emissions.

ENTSO-E | Rue de Spa, 8 | 1000 Brussels | info@entsoe.eu | www.entsoe.eu | @entso_e                    Page 6 of 71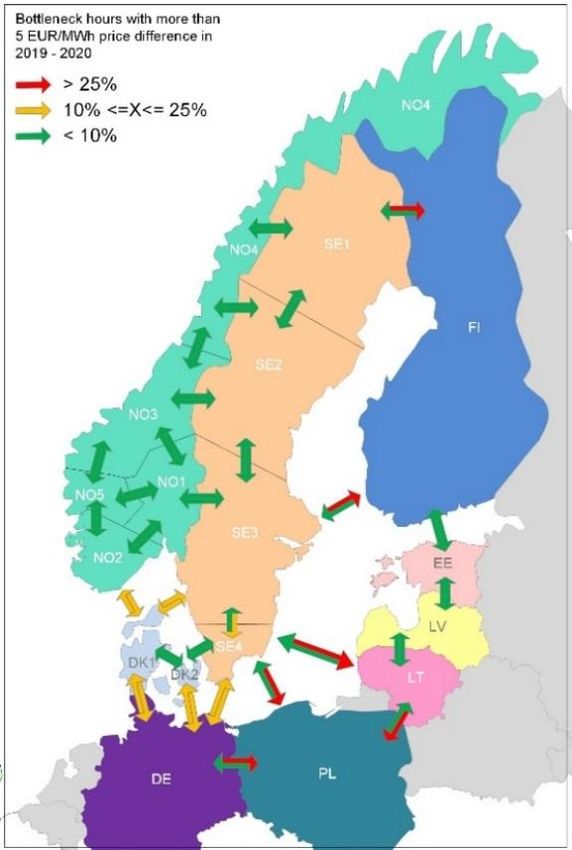
Regional Investment Plan 2020 – Baltic Sea
2. INTRODUCTION
2.1 Regional Investment Plans as foundation for the
TYNDP 2020
ENTSO-E’s Ten-Year Network Development Plan (TYNDP) is the most comprehensive planning reference for
the pan-European electricity transmission network. Released every even year, it presents and assesses all
relevant pan-European projects at a specific time horizon, as defined by a set of various scenarios to describe
the future development and transition of the electricity market. The TYNDP is serves as basis to derive the EU
list of European Projects of Common Interest (PCI).
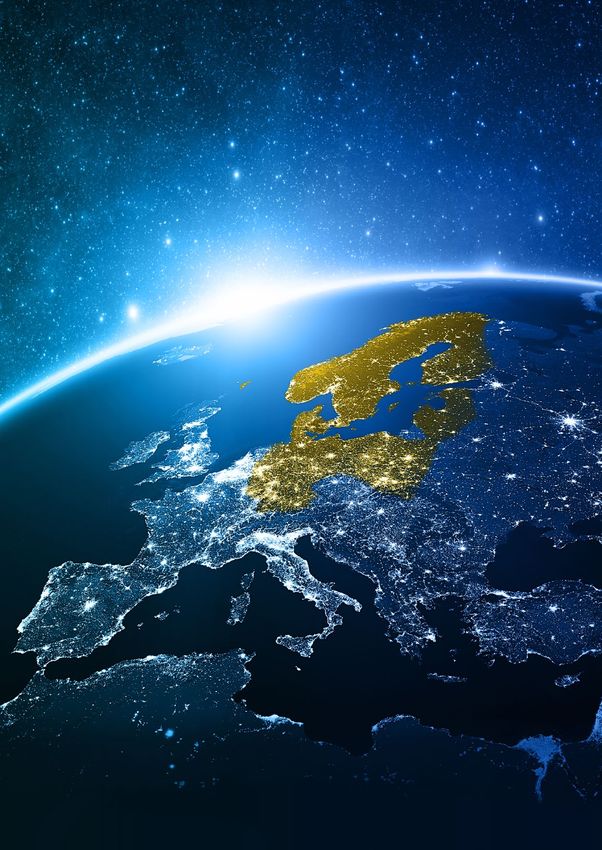
An essential part of the TYNDP 2020 package, the six Regional Investment Plans address challenges and
system needs at the regional level, for each of ENTSO-E’s six system development regions (Figure 2-1).
Figure 2-1 – ENTSO-E’s six system development regions
The regional investment plans are part of the TYNDP2020 package, which also include, among others, the
‘Completing the map - Power system needs in 2030 and 2040’ report and the Scenarios report, describing
the scenarios serving as basis for the IoSN 2040 and the regional investment plans.
ENTSO-E | Rue de Spa, 8 | 1000 Brussels | info@entsoe.eu | www.entsoe.eu | @entso_e Page 7 of 71
Regional Investment Plan 2020 – Baltic Sea

                               Figure 2-2 – Overview of TYNDP 2020 process and outputs

2.2 Legal requirements
Regulation (EU) 2019/943 Article 34 (recast of Regulation (EC) 714/2009) states that TSOs shall establish
regional cooperation within ENTSO-E and shall publish regional investment plans every two years. TSOs may
take investment decisions based on regional investment plans. Article 48 further states that ENTSO-E shall
publish a non-binding community-wide Ten-Year Network Development Plan, which shall be built on national
investment plans and take into account regional investment plans and the reasonable needs of all system
users and shall identify investment gaps.

In addition, the TYNDP package complies with Regulation (EU) Nº 347/2013, which defines new European
governance and organisational structures that shall promote transmission grid development.

2.3 Scope and structure of the Regional Investment

Plans
The Regional Investment Plans are based on pan-European market study results combined with European
and/or regional network studies. They present the current situation of the region as well as the expected
future regional challenges, considering a 2040 time-horizon. To illustrate circumstances that are especially
relevant to each region, available regional sensitivities and other available studies are included in the Plans.
The operational functioning of the regional system and associated future challenges may also be addressed.

ENTSO-E | Rue de Spa, 8 | 1000 Brussels | info@entsoe.eu | www.entsoe.eu | @entso_e                   Page 8 of 71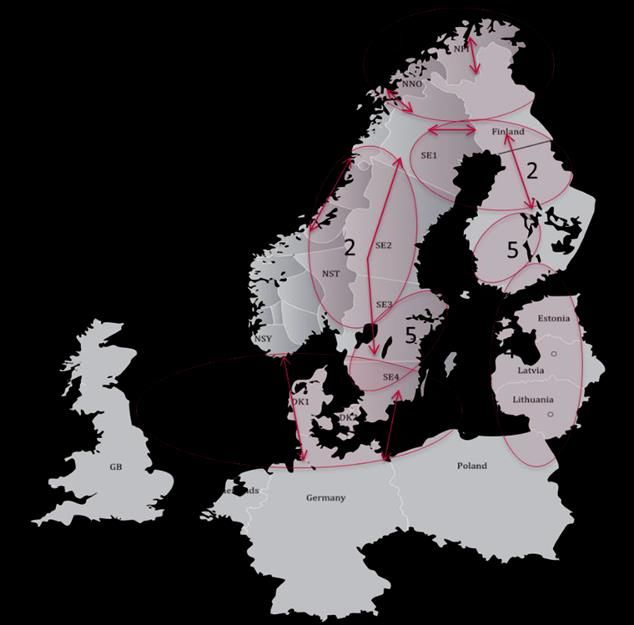
Regional Investment Plan 2020 – Baltic Sea

As one of the solutions to the future challenges, the TYNDP project has performed market and network studies
for the long-term 2040 time horizon National Trend scenario to identify investment needs, that is, cross-
border capacity increases and related necessary reinforcements of the internal grid that can help to mitigate
these challenges.

In addition, the Regional Investment Plans list the regional projects from the TYNDP 2020 project collection.
In the summer of 2020, each of these projects will be assessed and presented in the final TYNDP 2020 package.

The approach followed by the regional investment plans is summarised in Figure 2-3.

                                                                                      Market
     Description of the              Future                  Regional                            Regional
                                                                                        and
     present situation              regional                 capacity                             Project
                                                                                      Network
      and scenarios                challenges               in-creases                              list
                                                                                       results

                           Figure 2-3 – Mitigating future challenges – TYNDP methodology

The current document comprises six chapters with detailed information at the regional level:

•Chapter 1 presents the key messages about the region.

•Chapter 2 sets out in detail the general and legal basis of the TYNDP and regional investment plans and
provides a short summary of the general methodology used by all ENTSO-E regions.

•Chapter 3 covers a general description of the present situation of the region. The future challenges of the
region are also presented when describing the evolution of generation and demand profiles in the 2040
horizon but considering a grid as expected by the 2025 horizon. This chapter also includes links to the
respective national development plans (NDPs) of the countries of the region.

•Chapter 4 includes an overview of the regional needs in terms of capacity increases and the main results
from the market perspective.

•Chapter 5 is dedicated to additional analyses conducted inside the regional group or by external parties
outside the core TYNDP process.

• The Appendix includes the list of links to the National Development Plans, projects proposed by promoters
in the region at the Pan-European level as well as important regional projects that are not part of the European
TYNDP process. In the Appendix the abbreviations and terminology used in the whole report is included as
well as additional content and detailed results.

The actual Regional Investment Plan does not include the CBA-based assessment of projects. These analyses
will be developed in a second step and presented in the final TYNDP 2020 package.

ENTSO-E | Rue de Spa, 8 | 1000 Brussels | info@entsoe.eu | www.entsoe.eu | @entso_e                         Page 9 of 71
Regional Investment Plan 2020 – Baltic Sea

2.4 General methodology
The Regional Investment Plans build on the results of studies, called ‘Identification of System Needs’ (IoSN),
which are conducted by a European team of market and network experts originating from the six regional
groups of ENTSO-E’s System Development Committee. The results of these studies have been discussed and,
in some cases, extended with additional regional studies by the regional groups to cover all relevant aspects
in the regions.

The aim of the Identification of System Needs is to identify investment needs in the long-term time horizon
(2040) —triggered by market integration, RES integration, security of supply and interconnection targets —
in a coordinated pan-European manner that also builds on the expertise of the grid planners of all TSOs.

A more detailed description of this methodology is available in the TYNDP 2020 ‘Completing the map – Power
system needs in 2030 and 2040’ report.

2.5 Introduction to the region
The Baltic Sea Regional Group under the scope of the ENTSO-E System Development Committee is among
the six regional groups that have been set up for transmission grid planning and system development tasks
in short and long terms. The countries belonging to the Baltic Sea regional group are shown below.

                        Figure 2-4 – ENTSO-E System Development Committee Baltic Sea region

The Regional Group Baltic Sea comprises nine countries, listed in Table 2-1 along with their representative
TSO.

ENTSO-E | Rue de Spa, 8 | 1000 Brussels | info@entsoe.eu | www.entsoe.eu | @entso_e                Page 10 of 71
Regional Investment Plan 2020 – Baltic Sea
Country Company/TSO
Denmark ENERGINET
Estonia ELERING
Finland FINGRID
Germany 50HERTZ GmbH
Latvia AS AUGSTSPRIEGUMA TIKLS
Lithuania LITGRID AB
Norway STATNETT
Poland PSE S.A.
Sweden Svenska Kraftnät
Table 2-1 – ENTSO-E Regional Group Baltic Sea membership
2.6 Evolution since the RegIP 2017
The EU has agreed a comprehensive update of its energy policy framework to facilitate the transitions away
from fossil fuels towards a carbon-neutral energy and to deliver commitments for reducing greenhouse gas
emissions, that creates growth and jobs in a modern economy and increase our quality of life as citizens.
Buildings are responsible for approximately 40 % of energy consumption and 36 % of CO2 emissions in the
EU therefore by improving energy performance in buildings, the EU can more readily achieve its energy and
climate goals. EU has set an ambitious, binding target of 32 % for renewable energy sources in the EU's energy
mix by 2030. Energy efficiency is also a key objective in the package, as energy savings are the easiest way of
saving money for consumer and for reducing greenhouse gas emissions. The binding targets for EU has set
of at least 32,5 % energy efficiency by 2030 (business as usual scenario).
According to political agreement by the Council and the European Parliament in 2018 and early 2019 EU
countries have 1-2 years to transpose the new directives into national law. Clean energy for all Europeans
package consists of eight legislative acts and it aims to set right balance between making decisions at EU,
national and local levels. The package marks significant step towards the implementation of the Energy Union
strategy and explains the numerous benefits the new EU rules will provide. The changes will bring
considerable benefits from a consumer perspective, from an environmental perspective, and from an
economic perspective and provides an important contribution to the EU's long-term strategy of achieving
carbon neutrality by 2050.
The Clean energy for all Europeans package includes a robust governance system for the energy union,
through which each Member State is required to draft integrated and sustainable 10-year national energy
and climate plans (NECPSs) up to 2030 and even view towards 2050. As required under the rules, the
ENTSO-E | Rue de Spa, 8 | 1000 Brussels | info@entsoe.eu | www.entsoe.eu | @entso_e Page 11 of 71Regional Investment Plan 2020 – Baltic Sea Commission published an analysis of each draft plan with recommendations to be taken into account during 2019. A further part of the package seeks to establish a modern design for the EU electricity market, adapted to the new realities of the market – more flexible, more market oriented and better placed to integrate a greater share of renewable. In addition to the legal acts in the Clean energy for all Europeans package, the Commission has started a number of non-legislative initiatives aimed at facilitating the clean energy transition and ensuring that it is fair transition. The link to the publication of full Clean Energy for all Europeans package is here. ENTSO-E | Rue de Spa, 8 | 1000 Brussels | info@entsoe.eu | www.entsoe.eu | @entso_e Page 12 of 71
Regional Investment Plan 2020 – Baltic Sea

3. REGIONAL CONTEXT
In the following Chapter the Baltic Sea regional context has been described with a focus on present situation
in transmission grid, power generation, consumption and power flow exchange as well as defined most
significant grid constraints among Baltic Sea region countries.

3.1 Present situation
3.1.1 The transmission grid in the Baltic Sea region

The Baltic Sea region is comprised of Sweden, Norway, Finland, Denmark, Estonia, Latvia, Lithuania, Poland
and Germany. Within this region, there are three separate synchronous systems: the Nordic system, the
Continental system, and the Baltic States power system, which is currently synchronous with the IPS/UPS
system (i.e. Russia and Belarus). The synchronous areas are illustrated in Figure 3-1. Note that Denmark is
divided between two synchronous areas: Denmark-East, which is a part of the Nordic system, and Denmark-
West, which is the part of the Continental system.

              Figure 3-1 – Synchronous areas and existing interconnections in the Baltic Sea region

The Baltic States countries are currently in the same synchronous area with the Russian IPS/UPS power system
and have several AC connections to both Russia and Belarus. However, Latvia and Estonia have no market
exchange with Russia. Interconnection capacities between the Baltic States are strongly dependent on the
operations of non-ENTSO-E countries; therefore, there is political motivation in the Baltic States to

ENTSO-E | Rue de Spa, 8 | 1000 Brussels | info@entsoe.eu | www.entsoe.eu | @entso_e                   Page 13 of 71
Regional Investment Plan 2020 – Baltic Sea desynchronise from the IPS/UPS system and synchronise with the European system. The synchronization project started on 28th June 2018 when the President of the Commission Jean-Claude Juncker together with the Heads of State or Government of Lithuania, Latvia, Estonia and Poland agreed on the Political Roadmap on the synchronisation of the Baltic States' electricity networks with the Continental European Network via Poland by the target date of 2025. In line with the Political Roadmap on the synchronisation of the Baltic States' electricity networks with the Continental European Network via Poland, the BEMIP High Level Group (senior-official level) on the synchronisation project on 14 th September 2018 agreed on the technical and economic feasibility of the synchronisation option consisting of the existing double-circuit AC line between Poland and Lithuania (LitPol Link), complemented by the construction of an offshore HVDC link together with other optimization measures, including synchronous condensers. Transmission capacity plays a key role in addressing the future power system challenges. Adequate transmission capacity allows for a cost-effective utilisation of power, ensures access to adequate generation capacity, enables the smooth exchanging of system services, and is key to a well-integrated market. A cost- effective transition towards a green power system depends strongly on the strength of the transmission networks. Many new HVDC interconnectors since 2010 Almost seven new interconnectors have been commissioned since 2010, which have increased the total capacity by approximately 4,450 MW. These new interconnectors are Skagerrak 4 (Norway-Denmark), Fenno- Skan 2 (Sweden-Finland), Estlink 2 (Estonia-Finland), Nordbalt (Sweden-Lithuania), LitPol link (Lithuania- Poland), Cobra (Denmark-The Netherlands) and the Kriegers Flak CGS (Denmark-Germany) project which commissioning is being postponed to the end of September 2020. Four new HVDC connections are planned to be commissioned in the region during the next five years. Preparatory works for construction of Harmony link - HVDC link between Poland and Lithuania have been started in 2019 as a result of the Baltic synchronization project. The Interconnected HVAC network in the Baltic Sea region is illustrated in Figure 3-2 and is also found at https://www.entsoe.eu/map/. The Nordic and continental systems utilise 400 kV AC as the main transmission voltage level and 220/130/110 kV AC as sub-transmission voltage levels. In the Baltic States power system, the main transmission voltage level is 330 kV. The map in Figure 3-3 shows the diverse level of Net Transfer Capacities (NTC) in the Baltic Sea region. The NTC is the maximum total exchange capacity in the market between two adjacent price areas. ENTSO-E | Rue de Spa, 8 | 1000 Brussels | info@entsoe.eu | www.entsoe.eu | @entso_e Page 14 of 71
Regional Investment Plan 2020 – Baltic Sea

 Figure 3-2 – Interconnected network of the Baltic Sea
                                                                           Figure 3-3 – NTCs in the Baltic Sea region
                        region

3.1.2 Power generation, consumption and exchange in the Baltic Sea region

The total annual power consumption in the Baltic Sea region is approximately 1100 TWh, of which half is
consumed in Germany. The peak load is much higher in winter than in summer due to colder weather in the
Nordic and high share of electric heating in Nordic and Baltic States countries. From 2010 until 2018, peak
load has only shown moderate growth in the region, while renewable generation capacity has greatly
increased, as shown in Figure 3-4. Thermal fossil fuel-fired generating capacity has decreased in the Nordic
countries, while it has slightly increased in continental Europe. German nuclear phase-out is also clearly visible
in the figure.

The Continental and Nordic markets currently have sufficient thermal production capacity to cover demand
during periods of low production from variable renewable sources or during dry years with low hydro
production. Currently, all countries except Finland, Sweden and Lithuania have enough reliably available
capacity to cover peak load without having to import from neighbouring countries. However, the trend in
Denmark is also towards dependency on imports in peak load situations.

ENTSO-E | Rue de Spa, 8 | 1000 Brussels | info@entsoe.eu | www.entsoe.eu | @entso_e                                Page 15 of 71
Regional Investment Plan 2020 – Baltic Sea
Figure 3-4 – Installed generation capacities by fuel type and maximum consumption in the Baltic Sea region
in 2010 and 2018
The Nordic power system is dominated by hydropower, followed by nuclear, wind power and combined heat
and power (CHP). Most of the hydropower plants are located in Norway and northern Sweden and the nuclear
power plants are located in southern Sweden and Finland. During a year with normal inflow, hydropower
represents approximately 50 % of annual electricity generation in the Nordic countries, but variations between
wet and dry years are significant. For Norway, the variations can be almost 60 – 70 TWh between a dry and
wet year. Consumption in the Nordic countries is characterised by a high amount of electrical heating and
energy intensive industry. The power balance in the region is positive in a normal year but varies significantly
between wet/warm and dry/cold years. Sweden and Norway have an energy surplus, whereas Finland has an
energy deficit and is dependent on imports. The development of generation and demand in the Baltic Sea
region is shown in Figure 3-5.
ENTSO-E | Rue de Spa, 8 | 1000 Brussels | info@entsoe.eu | www.entsoe.eu | @entso_e Page 16 of 71Regional Investment Plan 2020 – Baltic Sea
Figure 3-5 – Annual generation by fuel type and annual consumption in the Baltic Sea region in 2010 and
2018
Power production in the continental part of the Baltic Sea region and the Baltic States area is dominated by
thermal power except in the Danish power system, which is dominated by wind and other renewable energy
sources (RES) already being above 60 % share of consumption. Consumption in the area is less temperature-
dependent compared with Nordic countries. Denmark, Poland, Estonia and Latvia have a neutral annual power
balance during an average year, whereas Germany has a yearly surplus. Lithuania, on the other hand, is
currently operating with a large energy deficit. The massive increase in RES generation in Germany has
replaced nuclear production but has only slightly decreased fossil fuel-based generation while significantly
increasing exports.
The cross-border flows in 2018 are shown in Figure 3-6 and the development in cross-border exchanges from
2010 to 2018 is presented in Figure 3-7. The largest exchanges are from Norway, Sweden and Germany to
neighbouring countries, while the largest increase in power flow from 2010 to 2018 is seen from Sweden to
Finland and from Germany to the Netherlands. In the Nordic countries, the flow pattern varies a lot from year
to year as a result of variations in hydrological inflow (both 2010 and 2018 were dry years, but 2010 was drier).
In wet years, exports from Sweden and Norway are typically much larger than during dry years. In addition,
Finnish imports from Russia have decreased as a result of a new market design in Russia, which significantly
increases the price of exports during peak hours. In practice, this has limited Finnish imports to nights and
weekends.
ENTSO-E | Rue de Spa, 8 | 1000 Brussels | info@entsoe.eu | www.entsoe.eu | @entso_e Page 17 of 71Regional Investment Plan 2020 – Baltic Sea
Figure 3-6 – Cross-border physical energy flows (GWh) in the Baltic Sea region in 2018
Figure 3-7 – Cross-border physical energy flows (GWh) in the Baltic Sea region in 2010 and 2018
ENTSO-E | Rue de Spa, 8 | 1000 Brussels | info@entsoe.eu | www.entsoe.eu | @entso_e Page 18 of 71Regional Investment Plan 2020 – Baltic Sea
3.1.3 Grid constraints in the Baltic Sea region
Figure 3-8 illustrates the price differences between market areas in the Baltic Sea region during 2019 and
2020. The Figure shows two cases when the price difference is 2 EUR/MWh and 5 EUR/MWh. The average
amount of bottleneck hours between price areas is dependent on the weather conditions during the period
under observation. 2019-2020 was a normal year throughout the whole Nordic region, which indicate the
normal average flow of electricity from the northern hydro reservoir areas to the south. A normal year means
that the annual amount of precipitation is in between dry and wet (normal) and no very high-water inflow on
hydro generation observed. During the wet years the increased power flow resulting in the increased amount
of bottleneck hours, for example, between northern Norway and Sweden.
Figure 3-8 – Percentage of hours with different market prices per market area border and direction
Some of the typical situations that can occur due to grid constraints today, which are also visible in Figure 3-
8, are:
• Bottlenecks between Sweden and Finland, in the direction towards Finland;
• Bottleneck on the cross-border Lithuania – Poland, resulting in the higher prices for Poland and week
connection between Baltic States and Continental Europe;
• Bottlenecks around Poland and Germany, that can't reduce the price in Continental European
countries.
• Limitations on transmission capacities between Germany and Denmark, Germany and Sweden,
Germany and Poland
• Internal bottlenecks in Norway and Sweden, which can lead to lower prices or even hydropower
spillage in cases of high reservoir levels and high inflows, such as during a wet year in Norway.
ENTSO-E | Rue de Spa, 8 | 1000 Brussels | info@entsoe.eu | www.entsoe.eu | @entso_e Page 19 of 71Regional Investment Plan 2020 – Baltic Sea
3.2 Description of the scenarios
The scenarios in which the studies in this report have been performed are presented in this chapter. First, the
expected changes in the generation portfolio of the region are explained, followed by a description of the
pan-European TYNDP scenarios as well as the regional scenarios. The regional scenarios are created and used
in the studies to highlight the regional specifics.
The TYNDP2020 Scenario edition published in June 2020 represents the first step to quantify the long-term
challenges of the energy transition on the European electricity and gas infrastructure.
The joint work of ENTSO-E and ENTSOG, stakeholders and over 80 TSOs covering more than 35 countries
provided a basis to allow assessment for the European Commission’s Projects of Common Interest (PCI) list
for energy, as ENTSO-E and ENTSOG progress to develop their respective TYNDPs.
We strongly recommend the reader familiarises themselves with the content included in the Scenario Report
and visualisation platform, as these will provide full transparency on the development and outcomes of the
scenarios mentioned in this report.
Scenario Storylines
The joint scenario building process presents three storylines for TYNDP 2020:
• National Trends (NT), the central policy scenario, based on the Member States National Energy and
Climate Plans (NECPs) as well as on EU climate targets. NT is further compliant with the EU’s 2030
Climate and Energy Framework (32 % renewables, 32.5 % energy efficiency) and EC 2050 Long-Term
Strategy with an agreed climate target of 80 – 95 % CO2-reduction compared to 1990 levels.
• Global Ambition (GA), a full energy scenario in line with the 1,5°C target of the Paris Agreement,
envisions a future characterised by economic development in centralised generation. Hence,
significant cost reductions in emerging technologies such as offshore wind and Power-to-X are led
by economies of scale.
• Distributed Energy (DE), a full energy scenario as well compliant with the 1,5°C target of the Paris
Agreement, presents a decentralised approach to the energy transition. On this ground, prosumers
actively participate in a society driven by small scale decentralised solutions and circular approaches.
Both Distributed Energy and Global Ambition reach carbon neutrality by 2050.
ENTSO-E | Rue de Spa, 8 | 1000 Brussels | info@entsoe.eu | www.entsoe.eu | @entso_e Page 20 of 71Regional Investment Plan 2020 – Baltic Sea
Figure 3-9 – Key parameters for the scenario storylines.
Bottom-Up: This approach of the scenario building process collects supply and demand data from gas and
electricity TSOs.
Top-Down: The “Top-Down Carbon Budget” scenario building process is an approach that uses the “bottom-
up” model information gathered from the Gas and Electricity TSOs. The methodologies are developed in line
with a Carbon Budget approach.
Full energy scenario: a full energy scenario employs a holistic view of the European energy system, thus
capturing all fuel and sectors as well as a full picture of primary energy demand.
ENTSO-E | Rue de Spa, 8 | 1000 Brussels | info@entsoe.eu | www.entsoe.eu | @entso_e Page 21 of 71Regional Investment Plan 2020 – Baltic Sea
Figure 1-10 – Key drivers of scenario storylines
3.2.1 Selective description of electricity results
To comply with the 1.5° C targets of the Paris Agreement, carbon neutrality must be achieved by 2040
in the electricity sector and by 2050 in all sectors.
Distributed Energy and Global Ambition (also referred to as “COP21 Scenarios”) scenarios are meant to assess
sensible pathways to reach the target set by the Paris Agreement for the COP 21: 1.5° C or at least well below
2° C by the end of the century. For the purpose of the TYNDP scenarios, this target has been translated by
ENTSO-E and ENTSOG into a carbon budget to stay below +1.5° C at the end of the century with a 66.7 %
probability.
Figure 3-11 – GHG Emissions in ENTSOs’ Scenarios
To optimise conversions, the direct use of electricity is an important option resulting in progressive
electrification throughout all scenarios.
ENTSO-E | Rue de Spa, 8 | 1000 Brussels | info@entsoe.eu | www.entsoe.eu | @entso_e Page 22 of 71Regional Investment Plan 2020 – Baltic Sea
The scenarios show that higher direct electrification of final use demand across all sectors results in increase
in the need for electricity generation.
Distributed Energy is the scenario storyline with the highest annual electricity demand hitting around 4300
TWh by 2040. The results for scenarios show that there is the potential for year on year growth for EU 28
direct electricity demand. Figure 5 provides annual EU-28 electricity demand volumes and the associated
growth rate for the specified periods.
The growth rates for the storylines show that by 2040 National Trends is centrally positioned in terms of
growth between the two more-ambitious top-down scenarios Distributed Energy and Global Ambition. The
main reason for the switch in growth rates is due to the fact that Global Ambition has the strongest levels of
energy efficiency, whereas for Distributed Energy strong electricity demand growth is linked to high
electrification from high uptake of electric vehicles and heat pumps, dominating electrical energy efficiency
gains.
Figure 3-12 – Direct Electricity Demand per Scenario
(EU28)
In the COP21 Scenarios, the electricity mix becomes carbon neutral by 2040.
In EU-28, electricity from renewable sources meets up to 64 % of power demand in 2030 and 83 % in 2040.
Variable renewables (wind and solar) play a key role in this transition, as their share in the electricity mix grows
to over 40 % by 2030 and over 60 % by 2040.
The remaining renewable capacity consists of biofuels and hydro. All figures stated above exclude power
dedicated for P2X use, which is assumed to be entirely from curtailed RES, and newly build renewables that
are not grid-connected, and therefore not considered in this representation.
To move towards a low carbon energy system, significant investment in gas and electricity renewable
technologies is required.
ENTSO-E | Rue de Spa, 8 | 1000 Brussels | info@entsoe.eu | www.entsoe.eu | @entso_e Page 23 of 71Regional Investment Plan 2020 – Baltic Sea
Distributed Energy is the scenario with the highest investment in generation capacity, driven mainly by the
highest level of electrical demand. Distributed Energy mainly focuses on the development of Solar PV, this
technology has the lowest load factor, as result Solar PV installed capacity will be higher compared to offshore
or onshore wind, to meet the same energy requirement. The scenario shows a larger growth in Onshore Wind
after 2030. In 2030, 14 % of electricity is produced from Solar and 30 % from wind, 44 % in total. In 2040 18
% of the electricity is generated from solar and 42 % from wind 60 % in total. The scenario also sees the least
amount of electricity produced from nuclear out of the three scenarios, providing 16 % of electricity in 2030
and 10 % in 2040.
Figure 3-13 – Percentage share of electricity demand covered by RES
Global Ambition has a lower electricity demand, with a general trend of higher nuclear and reduced prices
for offshore wind. Consequently, the capacity required for this scenario is the lowest as more energy is
produced per MW of installed capacity in offshore wind, and nuclear is used as base load technology
providing 19 % of energy in 2030 and reducing to 12 % in 2040. In 2030, 10 % of electricity is produced from
Solar and 32 % from wind, 42 % in total. In 2040 13 % of the electricity is generated from solar and 45 % from
wind 58 % in total.
National Trends is the policy-based scenario. The variable renewable generation is somewhere between the
two to down scenarios. In 2030, 12 % of electricity is produced from solar and 30 % from wind, 42 % in total.
In 2040 14 % of the electricity is generated from solar and 42 % from wind 56 % in total. A lot of electricity is
still produced from nuclear in 2030 17 % reducing to 12 % in 2040.
Shares of coal for electricity generation decrease across all scenarios.
This is due to national policies on coal phase-out, such as stated by UK and Italy or planned by Germany. Coal
generation moves from 10 % in 2025, to 4 % - 6 % in 2030 and negligible amounts in 2040 which represents
an almost complete phase out of coal.
ENTSO-E | Rue de Spa, 8 | 1000 Brussels | info@entsoe.eu | www.entsoe.eu | @entso_e Page 24 of 71Regional Investment Plan 2020 – Baltic Sea
Considerations on Other Non-Renewables (mainly smaller scale CHPs) source are important for
decarbonisation.
As it stands, carbon-based fuels are still widely used in CHP plants throughout Europe. This includes oil, lignite,
coal and gas. In order to follow the thermal phaseout storylines, oil, coal and lignite should be phased out by
2040 and replaced with cleaner energy sources. Gas will contribute to decarbonisation by increasing shares
of renewable and decarbonised gas.
Figure 3-14 – Electricity Capacity mix
Sector Coupling – an enabler for (full) decarbonisation.
For ENTSO-E and ENTSOG, sector coupling describes interlinkages between gas and electricity production
and infrastructure. Major processes in this regard are gas-fired power generation, Power-to-Gas (P2G) and
hybrid demand technologies. TYNDP 2020 scenarios rely on further development of sector coupling, without
these interlinkages a high or even full decarbonisation in the energy sector will not be reached.
Assuming a switch from carbon-intensive coal to natural gas in 2025, 150 MtCO2 could be avoided in the
power generation. With increasing shares of renewable and decarbonised gases, gas-fired power plants
become the main “back-up” for variable RES in the long-term. Distributed Energy even shows a further need
for CCS for gas power plants to reach its ambitious target of full decarbonisation in power generation by
2040.
On the other hand, P2G becomes an enabler for the integration of variable RES and an option to decarbonise
the gas supply. Hydrogen and synthetic methane allow for carbon-neutral energy use in the final sectors.
Distributed Energy is the scenario with the highest need for P2G, requiring about 1500 TWh of power
generation per year with 493 GW of capacities for wind and solar in 2040 to produce renewable gas. Sector
coupling in National Trends, with the assumption that P2G generation is limited to “curtailed electricity”,
considers 12 TWh of power generation with 22 GW of P2G to produce renewable gas.
ENTSO-E | Rue de Spa, 8 | 1000 Brussels | info@entsoe.eu | www.entsoe.eu | @entso_e Page 25 of 71Regional Investment Plan 2020 – Baltic Sea
Figure 3-15 – Capacities for hydrogen production
Figure 3-16 – Power to Gas generation mix
3.2.2 Key findings of the scenarios for the Baltic Sea region.
The main changes and drivers for the changes in the regional generation portfolio are explained in this
chapter as a basis for the regional scenarios. The challenges expected due to these changes are then
elaborated on in Chapter 3.2.3. The main drivers of the changes in the Baltic Sea region relate to climate
policy, which stimulates the development of more RES and a common European framework for the operation
and planning of the electricity market. The main structural changes in the Baltic Sea region power system in
the future relate to the following.
• Strong increase in RES generation:
o The increased share of wind power (onshore and offshore) and solar PV in the power system
is shown in all scenarios;
ENTSO-E | Rue de Spa, 8 | 1000 Brussels | info@entsoe.eu | www.entsoe.eu | @entso_e Page 26 of 71Regional Investment Plan 2020 – Baltic Sea
o Additional wind power generation mainly located in the northern and middle part of the
region, which is located farther away from the load centres with large amounts planned for
construction in the middle and southern part of the region
o PV capacity to be mainly increased in the middle and southern part of the region.
• Reduction of thermal power capacity:
o Decommissioning of old lignite, hard coal and oil-fired power plants;
o Full decommissioning of all nuclear power plants in Germany by the end of 2023;
o Decommissioning of four nuclear units in Sweden, with a total capacity of 2,900 MW being
decommissioned in the period 2015 -2020. The remaining six units is expected to reach the
end of their technical lifetime around 2040.
• New large generating units
o New nuclear capacity is being built in Finland, with one unit of 1,600 MW, which is planned
to be commissioned in 2020 and another plant of 1,200 MW, which is planned for
commissioning in 2028.
o Large wind power generation units are planned in the whole BS region.
• Slight increase of storage technologies (hydro-pump storages, battery) in all scenarios to integrate
the flexible RES power generation.
• Remarkable increase of capacities for hydrogen production, mainly in the scenarios DE 2030/2040
and GA 2040.
• Visible increase of capacities for Power to gas generation, also mainly in the scenarios DE.
Growing share of variable renewable generation
The historical development of renewable generation is based on subsidies. Lower development costs,
gradually improved solar cell efficiency and increasingly larger wind turbines with a higher number of full-
load hours will reduce the overall costs per MWh for both solar and wind power. Today, solar power and wind
power, if located favourably, can be profitable without the need for subsidies. This results in changes in
geographical distribution, as it is more profitable to develop solar and wind power in the locations with the
best conditions and the lowest costs. For example, there is much interest in greater development in the Nordic
and Baltic regions, which have some of the best wind resources in Europe. Development can proceed very
rapidly, with some market participants already planning to build new wind turbines without subsidies.
Nuclear phase-out continues in Sweden, while Finland builds new capacity
Nuclear power in Sweden and Finland plays a key role in the Nordic power system. Annually, it represents 25
% of the overall power generation in the Nordic countries. Nuclear power delivers a stable and predictable
baseload near consumption centres and their contribution during dry years is important. Moreover, the power
plants contribute stability to the Nordic grid, and many of the power plants are also strategically located in
areas where they can fully support the capacity of the power grid.
ENTSO-E | Rue de Spa, 8 | 1000 Brussels | info@entsoe.eu | www.entsoe.eu | @entso_e Page 27 of 71Regional Investment Plan 2020 – Baltic Sea
Figure 3-17 – Expected developments in Nordic nuclear power capacity from 2020 to 2050 used in the
scenario building based on an expected lifetime of 50 to 60 years
The further development of the nuclear power in Sweden and Finland is a key uncertainty in the Nordic power
system and the market. All of the current active reactors started operating between 1972 and 1985, with a
planned lifetime of 50 to 60 years. Swedish nuclear power plants have been under financial strain in recent
years due to low power prices, increased taxes and high capital costs from earlier investments in maintenance
and capacity extension. As a result, four reactors with a total capacity of 2,900 MW could be shut down as
early as 2020. This means that energy generation will decline from 65 TWh a year today to approximately 50
TWh. Furthermore, the Swedish energy policy from the summer of 2016 includes the decision to remove the
special tax on output, which had a severe impact on nuclear power.
In Finland, however, there is political support for further investment in nuclear power. In 2014, the authorities
granted a licence to Fennovoima for the construction of a new nuclear plant in northern Finland called
Hanhikivi 1. This means that overall installed capacity for Finnish nuclear power will increase from about 2,700
MW today to a peak of almost 5,500 MW after 2025. In Finland, Olkiluoto 3 will be in operation before any
older nuclear plants are decommissioned. Realisation of the Hanhikivi 1 NPP would keep nuclear production
in Finland at the pre-decommissioning level, but it will require extra grid investments, as it is planned to be
built at a different location to the existing NPPs.
Reduced utilization hours for thermal capacity and flexibility needs
The Continental and Nordic markets currently have sufficient thermal production capacity to cover demand
during periods of low production from variable renewable sources, or during dry years with low hydro
production. The increasing share of variable renewables reduces both the usage and profitability of thermal
plants, and a significant share of the thermal capacity will probably be shut down. This will, in turn, reduce the
capacity margin (the difference between the available generation capacity and consumption) in the day-ahead
market and will give tighter margins. This type of situation is particularly observed in Poland, where the
capacity margin decreases drastically with the increase in the installed RES in the country's system.
The high percentage of hydro production with reservoirs in the Nordic region provides large volumes of
relatively cheap flexibility, both in the day-ahead market and during operational hours. In addition to
ENTSO-E | Rue de Spa, 8 | 1000 Brussels | info@entsoe.eu | www.entsoe.eu | @entso_e Page 28 of 71You can also read