Petroleum Supply and Use in Washington State - An Overview of Recent Developments in the Petroleum Market
←
→
Page content transcription
If your browser does not render page correctly, please read the page content below
Petroleum Supply and Use in
                                      Washington State
                      An Overview of Recent Developments in the Petroleum Market

October 2013
Brian Bonlender, Director
Acknowledgements
Washington State Department of Commerce
Tony Usibelli, Director, State Energy Office
Greg Nothstein, Energy Program Specialist, Project Manager
Roel Hammerschlag, Senior Energy Program Specialist

This document is an update of a 2006 petroleum white paper authored by the
State Energy Office.

Greg Nothstein
Washington State Department of Commerce
State Energy Office
1011 Plum St. SE
P.O. Box 42525
Olympia, WA 98504-2525
www.commerce.wa.gov

For people with disabilities, this report is available on request in other formats. To submit a
request, please call 360-725-4000 (TTY 360-586-0772).

Petroleum Supply and Use in Washington State
Table of Contents

Executive Summary........................................................................................................................ 1

Introduction..................................................................................................................................... 3

Historical and Forecast Primary Energy and Petroleum Consumption ..................................... 4

Petroleum Resources, Domestic Production and Imports........................................................ 14

Transport and Refining of Crude Oil and Distribution of Refined Products............................ 25

Crude Oil and Refined Petroleum Product Prices and Expenditures ...................................... 32

Causes of Price Volatility in the Petroleum Market ................................................................... 39

Greenhouse Gas Emissions Associated with Petroleum Consumption.................................. 46

Alternative Fuels and Technology to Replace Petroleum Products ........................................ 50

Recent Policy Directions.............................................................................................................. 53

Appendix A: Common energy units ............................................................................................ 55

Appendix B: Brief overview of ‘Peak Oil’.................................................................................... 56

Appendix C: U.S. Liquid Fuel Prodcution Forecast. .................................................................. 59

Appendix D: Challenges Forecasting Petroleum Resources, Supply, Demand and Prices... 60

Appendix E: Crude Oil Price Differentials. ................................................................................. 64

Appendix F: Electric vehicle competitiveness battery cost vs. gasoline price ....................... 65

Petroleum Supply and Use in Washington State
Executive Summary
Global Petroleum Demand and Production

Global demand for petroleum products has grown at 1.3 percent per year over the last decade.
Over the next two decades demand for coal, natural gas, nuclear, and renewable energy is
expected to grow rapidly, and petroleum’s share of the global energy pie is expected to decline
from 33 percent today to about 28 percent by 2030. Global petroleum demand growth is being
driven by developing nations such as China, India, Brazil, and Indonesia. Developed nations such
as the U.S., Germany, and Japan have stable or decreasing demand, caused primarily by a
combination of slow growing populations, static demand for more vehicles, and increasing fuel
economy standards. Currently, developed and developing nations consume approximately 45
million barrels per day, but in coming decades developing nations will dominate petroleum
consumption.

Canada, Brazil, the U.S., Saudi Arabia, and a few other nations are increasing production of
petroleum and other liquid fuels (synthetic liquids and biofuels) to meet demand. Norway, the
United Kingdom, and Mexico have declining production, while China, Venezuela, Mexico, Iraq,
and Iran have the potential to increase production but face technological or political hurdles to
do so. The Organization of Petroleum Exporting Countries (OPEC) is a petroleum cartel which
controls about 40 percent of global production. It has some control over petroleum prices.
OPEC also controls most of the world’s petroleum reserves. These reserves have lower
production costs than the oil sands, heavy oil, offshore, and tight oil being developed in non-
OPEC nations. Static demand in the developed world and increasing production from
unconventional resources outside of OPEC will shift trade balances, with North America
becoming more energy self-sufficient and less concerned about political developments in OPEC
countries. In contrast, China and India are increasing their petroleum imports and will become
more concerned or involved in political developments in petroleum exporting countries.

U.S. Petroleum Demand and Production

U.S. demand for petroleum and its refined products reached a peak in 2005, but declined 13
percent by 2012. Several factors contributed to the decline, including the 2007-09 recession,
persistent high fuel prices, and increasing vehicle fuel economy standards. U.S. demand is
forecast to decline for a few more years but begin slowly increasing in the next decade. U.S.
production of petroleum and other liquid fuels has rebounded strongly after reaching a low in
2005. The increase is being driven by expansion of tight oil, natural gas liquids, and biofuels
production. Total liquids production has increased from 8.1 million barrels per day in 2005 to 10.7
million barrels per day in 2012. The share of imported petroleum has declined from 61 percent in
2005 to 41 percent in 2012. Production is forecast to continue increasing until about 2020, after
which production will slowly decline. Canadian petroleum production is also growing rapidly and
Canada is by far the largest source of U.S. imported oil, supplying 1.1 million barrels per day in
2012. Canadian production growth has come primarily from oil sands development, more costly

Petroleum Supply and Use in Washington State                                               1
and energy intensive than conventional reserves. In 2012 Canadian oil sands production stood at
1.8 million barrels per day and is forecast to reach 4.7 million barrels per day by 2030. Much of
the imported Canadian oil is just passing through the U.S., being refined into gasoline and diesel
at Gulf coast refineries and then exported to central and South America markets. There is limited
pipeline capacity for transporting oil from the newly developed midcontinent oil sands and tight
oil fields, so the midcontinent is experiencing a glut of supply and lower oil prices. In response,
the capacity to transport oil by rail tanker is growing rapidly. Rail tanker deliveries of
midcontinent crude oil to Washington state refineries have recently started.

The U.S. is still a net importer of petroleum, but in 2011 the U.S. transitioned from net importer
to net exporter of refined petroleum products. The expansion of U.S. petroleum extraction and
refining industries, besides reducing imports and boosting exports of refined products, has
contributed significantly to job growth over the last several years. A PricewaterhouseCoopers
study reported the U.S. petroleum and natural gas industry added 600,000 jobs during 2010
and 2011.

Petroleum and refined product prices

While the prospects for higher petroleum production in North America appear good over the
next dozen years, most of the conventional reserves lie in OPEC nations. The oil sand reserves in
Canada are large, but long development times and high extraction costs mean that only sustained
high world crude oil prices can spur production. Even with increasing North American production,
petroleum is an internationally traded commodity and the North American price will continue to
be set by international markets. Consequently, petroleum prices will likely remain above 100
dollars per barrel so Washington consumers should not expect to see significant reductions in
gasoline and diesel prices. Unpredictable events, like a global financial crisis or political turmoil in
a major OPEC exporting nation, could cause petroleum prices to swing above or below the
standard price forecast. In addition, refinery or pipeline accidents can contribute to regional fuel
price spikes of relatively short duration. Increasing light duty vehicle fuel efficiency will act to
reduce the impact of higher petroleum and prices and price spikes on consumers.

Beyond Petroleum

Petroleum has been the largest source of fossil fuel energy in the U.S. since 1950, and the
primary transportation fuel for nearly a century. Increasing concerns over greenhouse gas
emissions, state and national trade balances, and energy security have combined with price
pressure to push the nation and states toward alternatives to petroleum. Electric generation
and home heating, for example, have become far less dependent on petroleum over the past
forty years as price has increased. In the transportation sector it has been much more difficult
to find replacements for petroleum. But now biofuels, such as cellulosic ethanol and biodiesel,
are slowly entering the transportation fuel market. New types of vehicles such as hybrids, plug-
in hybrids, pure electric vehicles, and advanced diesels use less or no petroleum; and as of 2013
their collective market share was 5 percent, and is likely to increase.

Petroleum Supply and Use in Washington State                                                    2
Introduction
Petroleum is the most common primary energy 1 source globally, in the United States, and
Washington State. It supplied 33 percent of world, 36 percent of U.S., 2 and 46 percent of
Washington’s primary energy needs in 2011. Refined products derived from petroleum are
primarily, but not exclusively, used for transportation purposes and are essential for our
modern, mobile way of life.

The word petroleum means “rock oil” or “oil from the earth.” In its unrefined state petroleum is
usually called crude oil. After refining it generally takes the name of a refined petroleum
product such as gasoline, diesel, fuel oil, and so forth, which are collectively referred to as
refined products. Recently, growing natural gas liquids, synthetic liquids and biofuels
production have added to the petroleum stream, and analysts are referring to the combination
as “petroleum and other liquids,” or sometimes “total liquid fuels.” In this paper the word
“petroleum” refers to combined crude oil and natural gas liquids3 but not biofuels.

This paper presents an overview of petroleum in the United States and Washington State,
including:
    •    Global, U.S., and Washington Historical and Forecast Primary Energy and Petroleum
         Consumption;
    •    U.S. and Washington Consumption of Refined Petroleum Products;
    •    Petroleum Resources, and Consumption;
    •    Refining, and Transport, of Petroleum and Refined Products;
    •    Price Volatility in the Petroleum and Refined Product Markets;
    •    Petroleum Product Prices and Expenditures;
    •    Greenhouse Gas Emissions Associated with Petroleum Consumption;
    •    Emerging Replacements for Petroleum Products; and
    •    Federal and State Policy Activities.

1
  “Primary energy” means energy in the form that it is first accounted for in a statistical energy balance before any
conversion to secondary or tertiary forms of energy. Coal, natural gas, uranium and solar radiation are examples of
primary energy. Electricity and hydrogen are typical examples of secondary energy.
2
  U.S. petroleum and other liquid fuels consumption represented 38.4 percent of total energy consumption, but
this includes non-petroleum products ethanol in gasoline, and biodiesel.
3
  These are the longer hydrocarbons, associated with natural gas extractions that are typically added to the crude
oil supply at the refinery level.

Petroleum Supply and Use in Washington State                                                                3
Historical and Forecast Primary Energy and Petroleum Consumption
To understand the current and future importance of petroleum as a primary energy source, it is
useful to examine its consumption at the global, national, and state levels. All figures for global
historical and forecast primary energy consumption are from British Petroleum’s (BP) Energy
Outlook 2030, unless noted otherwise. National historical and forecast data come from the U.S.
Department of Energy, Energy Information Administration’s (EIA) 2013 Annual Energy Outlook
(AEO2013), and the EIA State Energy Data System. Washington State does not produce an
energy forecast, but historical energy consumption is available from the EIA.

Petroleum in the Global Energy Picture
Globally, three fuels, petroleum, coal, and natural gas, currently4 provide 88 percent of primary
energy, with nuclear and renewable energy providing the remaining 12 percent.5 As shown in
Figure 1, these three fuels are projected to continue providing the majority of primary energy
over the next 20 years, with an estimated share of 86 percent in 2030.6

Worldwide consumption of petroleum reached a record 87.3 million barrels per day in 2011.7
The four largest consuming countries were:
    •    United States (18.8 million barrels per day)
    •    China             (9.8 million barrels per day)
    •    Japan             (4.5 million barrels per day)
    •    India             (3.3 million barrels per day)

Petroleum provided 33 percent of primary energy in 2011, but this is forecast to decrease to 28
percent by 2030. The coal share is forecast to decrease from 30 percent to 28 percent by 2030,
while the natural gas share increases from 24 percent to 25 percent. Nuclear power is forecast
to remain at about a 6 percent share over the next 20 years, while renewable energy (including
hydropower) is expected to increase its share from 6 percent to 12 percent. So while
petroleum’s share decreases by 2030 it will be essentially tied with coal as the number one
source of global primary energy. The units in Figure 1 are British thermal units (Btu), which is
the customary unit used in the U.S. See Appendix A for a brief presentation on units.

4
  2011 data.
5
  British Petroleum Energy Outlook 2030.
6
  Other world energy reviews forecast a lower share for fossil fuels. Exxon-Mobil’s 2013 Outlook for Energy: A view
to 2040 forecasts the fossil fuel share at 81 percent. The EIA 2011 International Energy Outlook forecasts the fossil
fuel share at 79 percent.
7
  This is equivalent to 31.9 billion barrels per year, or 1.34 trillion gallons per year.

Petroleum Supply and Use in Washington State                                                                4
Figure 1: Global Primary Energy Consumption by Fuel: Historical and Forecast, 1990-2030.

        Source: British Petroleum Outlook 2012. Units: British Thermal Units (Btu)

Petroleum consumption in developed countries has declined over the last decade, but has been
offset by a steady increase in consumption in developing countries. Figure 2 illustrates the
recent consumption trends for developed countries in the Organization for Economic
Cooperation and Development (OECD) and non-OECD developing countries. In early 2013 global
consumption was evenly split between developed and developing countries. In the future
global petroleum demand will be largely determined by the demand growth in developing
countries.

During the previous decade, when demand and prices for petroleum were rising rapidly there
was a lively discussion regarding the prospect of peak oil production. The complex and
contentious topic of peak oil is beyond the scope of this paper, but a brief overview is
presented in Appendix B.

Petroleum Supply and Use in Washington State                                               5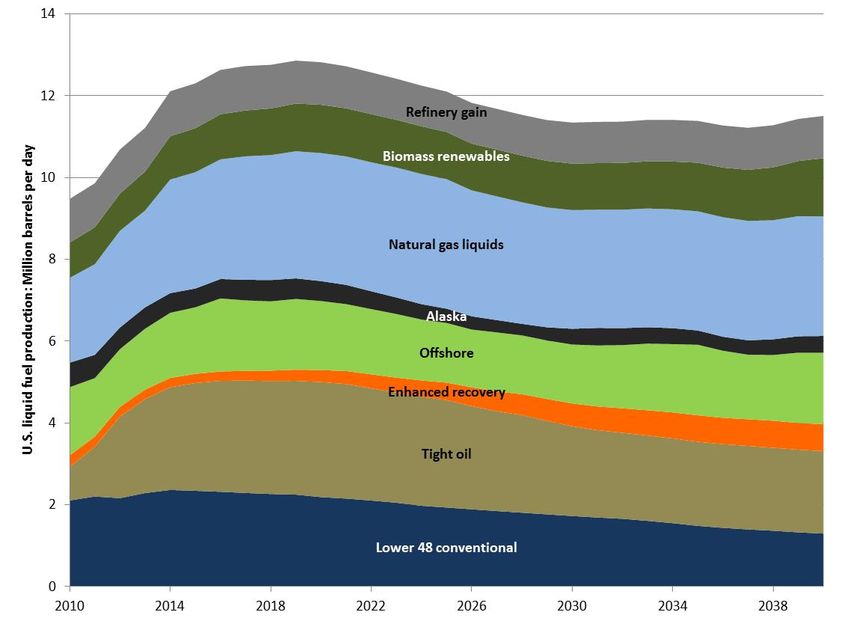
Figure 2: Total liquid fuels consumption, OECD and non-OECD.

This Week in Petroleum, June 12, 2013

Petroleum in the United States Energy Picture
The U.S. energy profile and forecast in Figure 3 is somewhat different than the global energy
profile and forecast. The three largest primary energy sources are the same: petroleum, coal
and natural gas, but in the U.S. natural gas consumption, on an energy basis, exceeds that of
coal. In 2011, total U.S. petroleum consumption was 18.8 million barrels per day, representing
36 percent of all the energy we consumed.

Both the U.S. and global energy projections see increasing natural gas consumption. In contrast
to the global primary energy forecast, the U.S. petroleum consumption, which peaked around
2007, is predicted to be flat to slightly declining while coal consumption is predicted to decline
over the next several years and then slowly increase through 2030.

Nuclear and renewable (including hydroelectric) energy consumption increases both globally
and in the U.S., but the rate of increase is more rapid at the global level. The primary message
from the U.S. forecast is that total energy consumption is flat and petroleum will remain the
largest source of primary energy. However, its share will decrease over the next 20 years from
38 percent of the total in 2011, to 35 percent in 2030. The primary driver of the decrease in U.S.

Petroleum Supply and Use in Washington State                                               6
petroleum consumption is the recently updated 8 Corporate Average Fuel Economy (CAFE)
standards for light and medium duty vehicles. Policies mandating increasing biofuel production
will also displace some petroleum consumption over the next 20 years.
Figure 3: United States Primary Energy Consumption by Fuel: Historical and Forecast,
1990-2030, 5-year increments.
Source: Energy Information Administration Annual Energy Outlook 2013
8
The Corporate Average Fuel Economy (CAFE) standards are regulations, first enacted by the U.S. Congress in
1975, intended to improve the average fuel economy of cars and light trucks (trucks, vans and sport utility
vehicles) sold in the U.S. After reaching 27.5 miles per gallon (mpg) for cars in 1986, the CAFE standards remained
relatively unchanged for twenty years. In 2007, the standards were set to increase to 35 mpg for cars by 2020. In
2011, CAFE standards were amended, with a target of 54.5 mpg by the 2025 model year. Coverage of medium duty
trucks was added in 2012, and heavy-duty commercial trucks in 2014. The mpg values required by the 2011 CAFE
standards are calculated using the original 1975 EPA testing methodology, which results in mpg values more than
20 percent higher than the current methodology used to produce the published fuel economy mpg numbers for
new vehicles.
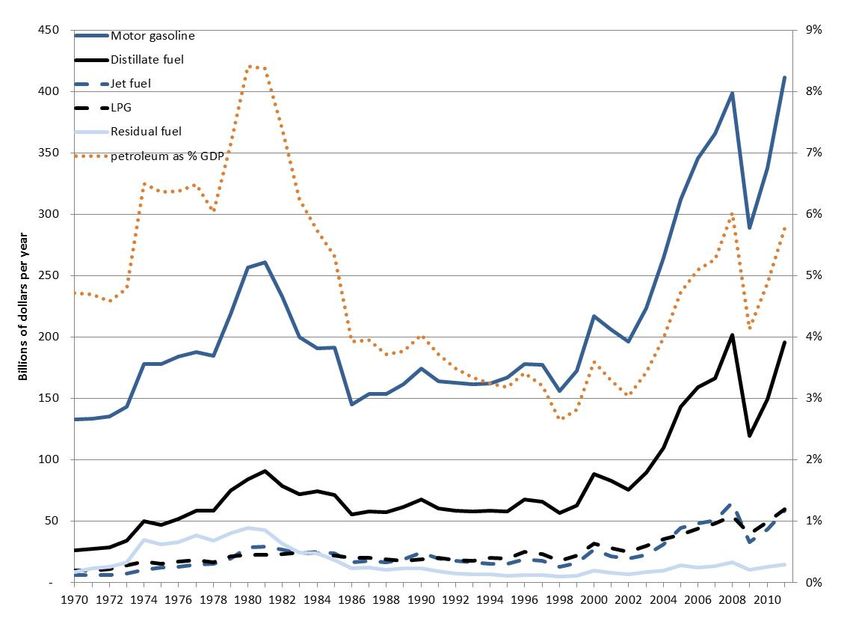
Petroleum Supply and Use in Washington State 7Consumption of refined petroleum products in the U.S.
Petroleum, or more broadly crude oil and other liquids, is not used directly but is converted into
a number of high value refined products. Motor gasoline, distillate fuels (diesel and heating oil),
jet fuel, liquefied petroleum gases (LPG), and residual fuel oil account for the vast majority of
refined petroleum products.
Figure 4: United States Consumption of Refined Petroleum Products 1981-2011.
Source: EIA, Product supplied
U.S. consumption statistics for 2011:
• In 2007, gasoline consumption reached a record high of 9.3 million barrels a day (or 391
million gallons per day), before declining to about 8.7 million barrels per day in 2011,
representing 46 percent of total petroleum consumption.
• Nearly 10 percent of the gasoline volume consumed in 2011 was actually ethanol (mixed
with gasoline). 9
9
In 2007, a Renewable Fuel Standard target of 36 billion gallons (2.35 million barrels per day) by 2022 was
established. Ethanol is one of the renewable fuels.
Petroleum Supply and Use in Washington State 8• Distillate fuel oil includes both diesel fuel and heating oil. Total distillate fuel oil
consumption in 2011 was over 3.8 million barrels per day, representing 20 percent of
total petroleum consumption. Biodiesel represented nearly 1 percent of distillate
consumption.
• Diesel fuel is used in the diesel engines of heavy construction equipment, trucks, buses,
tractors, boats, trains, and some automobiles. It accounts for about one-fifth of total
transportation fuel consumption and about 18 percent of total petroleum consumption
in 2011.
• Heating or fuel oil is used to heat homes and buildings, for industrial heating, and for
producing electricity.
• Liquefied petroleum gases (LPG) are mixtures of propane, ethane, butane, and other
gases produced at natural gas processing plants and oil refineries. LPG is used to heat
buildings, power non-road vehicles, and for cooking. Consumption in 2011 was 2.2
million barrels per day.
• Jet fuel, like gasoline, is nearly all used for transportation. Jet fuel consumption in 2011
was 1.4 million barrels per day.
• Still gas is a product of refining and is used as a source of heat at the refinery or as a
petrochemical feedstock. Approximately 0.68 million barrels per day were used in 2011.
• Residual fuel is used as an industrial and ship fuel, and 0.48 million barrels per day were
used in 2011.
U.S. consumption of refined petroleum products rose steadily from the early 1990’s until 2005-
07 when peak consumption was reached. A combination of high fuel prices, a severe recession,
and more recently increasing fuel economy standards resulted in declining gasoline and
distillate fuel consumption during 2008-12. Jet fuel consumption flattened out after the 911
terrorist attacks in 2001 and because of operational changes made by airlines. LPG is most
frequently used as a residential or commercial heating fuel and its use has continued to rise as
the U.S. population grows. Because of increasingly stringent emission standards, residual fuel
use has diminished in importance over the past 30 years. Consumption of still gas has remained
relatively stable over the past twenty years.
Petroleum in the Washington State Energy Picture
The profile of primary energy consumption for Washington State differs from the global and
national patterns (Figure 3). Petroleum is still the largest primary energy source, but the second
largest category is hydroelectric and renewable energy. 10 Washington has a uniquely 11 large
10
Renewable energy includes biomass much of which comes from the forest products industry.
11
The three other Pacific Northwest states also have large hydropower electric generation shares.
Petroleum Supply and Use in Washington State 9hydroelectric system that provides roughly 70 percent of the electricity consumed in the state.
This means in comparison to the global and national energy profiles, the state relies far less on
coal and natural gas to generate electricity, and consequently has lower greenhouse gas
emissions (GHGs) associated with its electric power sector. Washington’s per capita
consumption of petroleum products has historically been close to the national average.
Figure 5: Washington State Primary Energy Consumption by Fuel: 1990-2011.
Source: Energy Information Administration, State Energy Data System
The EIA has forecast energy production, consumption, and prices for the Pacific region 12 of the
U.S in the AEO2013 report. The Pacific region is dominated by California, but Washington does
share a similar petroleum consumption pattern with its larger neighbor to the south. The same
factors that are expected to drive Pacific region energy forecasts will drive Washington’s energy
future. Table 1 presents the forecast growth in Pacific region energy consumption by energy
category or fuel type for the 2011-40 periods. The third column describes the expected
relationship of Washington’s energy growth relative to the Pacific region forecast. Washington
petroleum consumption is expected to remain relatively flat, as increasing vehicle fuel
12
Alaska, California, Hawaii, Oregon, and Washington.
Petroleum Supply and Use in Washington State 10efficiency is offset by a growing population. As a share of total energy consumption, petroleum
is expected to decrease.
Table 1: Annual changes in energy consumption based on EIA AEO2013 Pacific region forecast.
Energy category Pacific region forecast Annual growth Major influences on long-term trends
or fuel annual change: 2011-2040 expectations for
(percent) Washington state
Natural gas 0.50 Similar Most growth for natural gas will be in electric
generation
Coal -0.10 Less Phase-out of Centralia operation by 2025.
Nuclear 0.50 Less Reactor shutdowns in CA lowered the initial
2011 starting value. Retirement of two CA
reactors will alter the next nuclear forecast
Hydro and 1.20 Less Large existing hydro base in WA reduces our
renewables apparent renewable growth rate.
Petroleum fuels 0.00 Similar National CAFE standards & biofuels
gasoline -0.60 Similar CAFE and biofuels
diesel 1.00 Slightly more Reflects increasing movement of freight
through WA ports.
It should be noted that the AEO2013 forecast is based on existing law and policy, some of which
contains expiration or end dates.13 Legislative changes could influence the petroleum
consumption for the nation, the Pacific region, and Washington State.
Consumption of refined petroleum products in the Washington State
In Washington state gasoline, diesel, and jet fuel represent the vast majority (83 percent in 2011)
of refined petroleum product consumed, and are used primarily for transportation purposes.
Other refined petroleum products include liquefied-petroleum-gas and residual fuel. The amount
of refined petroleum products used in the state, excluding residual fuel,14 grew steadily from the
13
For example, the renewable energy production tax credit expires at the end of 2013 and the CAFE standards for
light duty vehicles increase until 2025 and then hold steady. Both of these programs could be extended or
increased, but in the AEO reference case EIA assumes no renewal of the PTC or increases in the CAFE standard
after 2025. EIA includes a scenario that extends existing policies.
14
Residual fuel is primarily used to fuel ocean-going vessels. These vessels purchase fuel in Washington, but are
owned by other nations and spend only a short amount of time in state waters, so it is debatable as to whether
this fuel should be count as Washington state consumption. In addition, the accounting for residual fuel sales
seems to be erratic.
Petroleum Supply and Use in Washington State 11early 1980’s until 1999, then declined for several years following the 2000-02 recession. 15
Consumption began to grow again in 2004 and reached a new high in 2007, much like the nation
as a whole, and then began to decline. Since 2007 the amount of petroleum product consumed in
the state has declined nearly 12 percent, despite an 5 percent increase in population.
Consequently, the decline in per capita consumption of refined petroleum products has dropped
even more over the past five years. Factors that have contributed to this decline are:
• An economy operating at reduced output and employment,
• Higher fuel prices, and
• Increased fuel economy standards for light duty vehicles.
Figure 6 illustrates the trend in Washington state consumption of refined petroleum products
during 1970-2011.
Figure 6: Washington State Consumption of Refined Petroleum Products 1970-2011.
Source: EIA State Energy Data System.
15
The 911 terrorist attacks contributed to a sharp drop in jet fuel consumption nationally and in Washington state.
Since the early 2000’s, when jet fuel price began to increase, airlines have replaced older less efficient planes with
modern aircraft such as the 777 and 787.
Petroleum Supply and Use in Washington State 12Per capita petroleum consumption: Washington and United States
Another way to look at energy consumption over time is to express the consumption on a per
capita basis (average consumption per person). Expressing consumption on a per capita basis
removes the effect of population growth and allows us to look at how efficiently we are using
energy. While Figure 6 shows overall state consumption of petroleum is increasing from 1970
to 2005, Figure 7 shows that on a per capita basis petroleum consumption has declined. The
figure also shows U.S. per capita consumption, which declined, but less dramatically in recent
years. 16
Figure 7: Per capita petroleum consumption: Washington and United States
Factors contributing to the decline in per capita petroleum consumption include:
• Adoption of vehicle fuel economy standards in 1976 and updates in 2007 and 2011,
• A move away from oil heating in homes,
• Continued improvements in passenger aircraft efficiency,
• High petroleum prices during 1979-85, 2006-08 and 2011 onward, and
• Deep recessions during 1981-83 and 2007-09.
16
There may be reporting problems for Washington State, as residual fuel consumption is quite variable on an
annual basis. The U.S. reported residual consumption is much less variable and the per capita trend is smoother
and probably more representative, especially between 1980 and 2000.
Petroleum Supply and Use in Washington State 13Petroleum Resources, Domestic Production and Imports Global Petroleum Resources and Production Crude oil resources are commonly placed in two categories: proven, and unproven. The unproven category contains two sub-categories: probable and possible resources. Another term is technically recoverable reserves, which is the total of proven and unproven resources. There have been many instances when these terms are used incorrectly. In general, the numbers increase when moving from proven to probable to potential reserves. Proven reserves are the most frequently referenced term. It denotes the quantity of a known resource that is well supported by geological and engineering data and has a 90 percent certainty of being extracted under existing economic and technological conditions. Probable reserves are resource projections derived from the data used to support the proven reserves. Probable resources included proven reserves and additional reserves, such as those thought to be available by means of infill drilling or field extensions and are attributed with a 50 percent confidence of being recovered. Possible reserves are attributed to known accumulations that have a less likely chance of being recovered than probable reserves. This term is often used for reserves, which at a particular moment in time are believed to have at least a 10 percent certainty of being produced. In general, most early estimates of the reserves of an oil field are conservative and tend to grow with time. This is called “reserve growth.” Another term occasionally used in the literature is “oil in place,” which refers to the total amount of crude oil in an accumulation; only a portion of the oil in place is technically or economically recoverable. 17 While prospects for crude oil and liquids production in North America appear good over the next dozen years, most of the global crude oil and other liquid resources lie elsewhere. Table 2 reveals the proven crude oil reserves for several regions and the Organization of Petroleum Exporting Countries (OPEC). The oil sand reserves in Canada are large, but project and infrastructure development times are long and extraction costs high, so production growth will require sustained high world crude oil prices. Crude oil production costs tend to be much lower in OPEC countries, particularly in the Middle east. The EIA and other energy forecasting agencies expect OPEC, and especially Saudi Arabia, to act as the swing producer over the next twenty years, throttling back or increasing production to keep the price of crude oil high, but lower than competing forms of energy. 18 So even though North American liquids production will increase significantly over the next decade, the price of crude oil, and consequentially refined products like gasoline and diesel, will continue to be set by international markets. Consequently crude oil prices will likely remain above 100 dollars per barrel and Washington 17 Typically, 35 to 45 percent of oil in place can be recovered by primary and secondary techniques. Tertiary or Enhanced Oil Recovery can allow another 5 to 15 percent to be extracted, but is not always applied because of cost. E. Tzimas, (2005). Enhanced Oil Recovery using Carbon Dioxide in the European Energy System 18 Alternatives such as natural gas, GTL, CTL, biofuels, electricity, and others. Petroleum Supply and Use in Washington State 14
consumers should not expect to see significant reductions in gasoline and diesel prices anytime
soon.

Table 2: Proven Oil Reserves
     Country or region                                      Proven oil reserves (billion   Share of global reserves
                                                            barrels)
                                       19
     OECD Americas (Canada and U.S.)                                    207                          14%
     Rest of Americas (both OPEC and non-OPEC)                          237                          16%
     Africa                                                             124                          8.4%
     OECD Europe                                                         11                          0.7%
     Non-OECD Europe/Eurasia (former Soviet                             100                          6.8%
     Union)
     OPEC                                                              1050                           71%
     World                                                             1471                          100%
Source: EIA International Energy Outlook 2011 (Figure 39)

Global liquids production (crude oil, natural gas liquids, biofuels and other liquids) averaged
89.1 million barrels per day in 2012. Production from Non-OPEC and OPEC nations averaged
52.7 and 36.4 million barrels per day respectively. The EIA forecasts that in 2030 global liquids
production will increase to 104.4 million barrels per day, of which 61.9 and 42.5 million barrels
per day will be supplied by Non-OPEC and OPEC producers respectively. As a cartel OPEC plays a
key role in balancing global supply and demand, and can influence oil price, but by 2030 its
share of global liquids production is unchanged suggesting that the cartels ability to control oil
markets will largely remain the same. 20

The primary reason that OPEC is not expected to appreciably increase its global production
share is that several sources of new liquids production are predicted to significantly expand
during the period from 2012 through 2030. Tight oil and oil sands are expected to add 6.2
million barrels per day of new capacity. Brazil will add 4.4 million barrels per day of new
capacity, and natural gas liquid production will contribute 2.8 million barrels per day of new
capacity by 2030. The combined 2030 addition from biofuels and other liquid production
techniques are expected to be 2.4 million barrels per day of new capacity. These additions
more than make up for declines in conventional crude oil production.

North American Resources and Production
This section focuses primarily on crude oil, which is largest component of the petroleum or
liquid supply stream. North America has a sizable number of crude oil producing basins,
including but not limited to basins in Alaska, Texas, Louisiana, California, Alberta, North Dakota

19
     The EIA reports U.S. reserves for crude and NGLs in 2010 as 22.3 billion barrels.
20
     The International Energy Association forecasts a significantly higher market share for OPEC by 2030.

Petroleum Supply and Use in Washington State                                                                     15
and the Gulf of Mexico. Figure 8 shows the major fossil fuel basins in the United States. Crude
oil has been commercially extracted in North America since the mid-19th century. Even though
the initial resource base was sizable, the U.S. experienced declining crude oil production after
1970, and North America as a whole after 1985. Imports, particularly to the United States,
increased steadily after the mid 1980’s.
Figure 8: United States fossil fuel energy basins.
In the last ten to twenty years the steady development of three emergent North American
crude oil resources have combined to reverse the long-term stagnation in overall North
American production. The first and most prominent emergent resource are the oil sands in
Alberta, centered in the three large sub-basins of Cold Lake, Peace River, and Athabasca (Fort
McMurray). Total Canadian proved reserves, primarily oil sands, are currently estimated at
approximately 170 billion barrels. 21 The oil sands produce a very heavy oil, commonly referred
to as bitumen, an almost tar-like substance that cannot be recovered by conventional oil
extraction technology.
Approximately 20 to 25 percent of the oil sands resource are in shallow formations (less than
200 feet deep) and can be extracted by strip mining, while the remaining resource must be
extracted in situ by a technique known as Steam Assist Gravity Drainage (SAGD). 22 SAGD
consumes large amounts of natural gas to generate steam which is used to warm the bitumen
21
Of which approximately 5 billion barrels are conventional reserves.
22
Currently Canadian oil sands production is evenly split between surface mining and the SAGD method.
Petroleum Supply and Use in Washington State 16so it can flow and be pumped to the surface. Once extracted the bitumen must be cleaned and may then be extensively upgraded, which requires additional energy input. The upgraded product is referred to as syncrude. Alternatively, bitumen can be blended with 25 to 30 percent light conventional crude oil or natural gas liquids, creating a product referred to as dilbit, before being sent to refineries. Oil sands production in Alberta reached 1.8 million barrels per day in 2012. In the 2011 International Energy Outlook the EIA projects that total Canadian liquids production would increase from 3.8 million barrels per day in 2011 to 6.6 million barrels per day in 2035. 23 Most of the increase is expected to be from expanded oil sands production. The second emerging petroleum resource is offshore Gulf of Mexico production, which in 2011 was responsible for 1.3 million barrels per day or 23 percent of U.S. crude oil production and 1.9 million barrels per day of Mexican production. The federal offshore resource is currently listed as 5 billion barrels of proven reserves. It was first tapped decades ago, but was limited to depths of less than 1000 feet. More recent technological development has enabled production to occur at water depths of more than 3000 feet, thereby allowing the development of new offshore resources. AEO2013 forecasts approximately a 20 percent increase in U.S. offshore production by 2019, before production begins to decline. Mexico also has the potential for increased offshore oil production. The third emerging resource is “tight oil”, which is sometimes referred to as shale oil. Tight oil is usually of higher quality, being both “light” and “sweet”, 24 but is trapped primarily in low permeability shale, sandstone, or carbonate rock, which prevents the oil from flowing easily. Advances in staged hydraulic fracturing, 3D imaging, and horizontal drilling have allowed exploration and extraction companies to locate and extract tight oil. Technically recoverable U.S. reserves of tight oil are estimated at 48-56 billion barrels. In 2013, for the first time, EIA released a proved reserve number for U.S. tight oil resources: 3.6 billion barrels as of 2011. The most well-known tight oil resource is the Williston Basin (encompassing the Bakken formation) that covers parts of North Dakota, Montana, and Saskatchewan. Texas is also seeing a significant increase in tight oil production in the Eagle Ford formation For 2012, the EIA reported annual U.S. crude oil production increased by 0.8 million barrels per day 25 relative to 2011, most of the increase attributable to increasing tight oil production.26 In AEO2013 the EIA forecasts that by 2020 tight oil production will increase total U.S. petroleum production by 20 percent, after which a slow decline will begin. Tight oil production from the 23 Production forecasts are highly dependent on whether strong climate change measures are enacted in the U.S. and Canada. 24 Light refers to specific gravity and means the crude is of lower viscosity and flows more easily. Sweet refers to crude oil that is low in sulfur content; sour refers to crude that is high in sulfur. Removing sulfur creates an expense for refiners, usually offset by lower prices for sour (high sulfur) crude oil. 25 February 2013 Energy Information Administration STEO report: U.S. production averaged 6.5 million barrels per day in 2012, and is projected to average 7.4 and 8.2 million barrels per day in 2013 and 2014 respectively. 26 Increasing oil and natural gas production was credited with creating 150,000 new jobs in 2011: America’s Fossil Fuel Jobs Boom, Economix, March 12, 2012, New York Times. Petroleum Supply and Use in Washington State 17
Bakken and Eagle Ford formation has developed rapidly over the past four years as illustrated in
Figure 9. The development has outpaced pipeline infrastructure resulting in a shift to transport
of oil by rail.

Figure 9: Lower 48 state crude oil production 2010 through early 2013

The EIA recently released the 2011 estimates of proved reserves for crude oil and natural gas in
the U.S. For 2011, proved crude oil reserves were estimated to be 29 billion barrels, a 15
percent increase relative to 2010, and the highest level since 1985. Crude oil reserves have
been increasing for several years and appear to be mirroring the trend for natural gas reserves
which have been increasing for about a decade.

In addition to growing North American petroleum resources, several petroleum substitutes are
also growing in promise. The most successful petroleum substitute is from biofuel production.
The two primary biofuels today are ethanol and biodiesel which can be blended easily with
gasoline and diesel respectively. About 10 percent of current retail gasoline is actually ethanol
while biodiesel makes up about 1 percent of diesel fuel. Biofuel production and consumption is
primarily driven by the Renewable Fuel Standard (RFS) requirements of the Energy
Independence and Security Act (EISA) of 2007. The annual volumes of renewable fuel required
were significantly increased by EISA – to 36 billion gallons per year by 2022, of which 21 billion
gallons are to be advanced biofuel.27 There have been numerous technical and economic
challenges in the development of advanced biofuels and the EIA expects the RFS 36 billion
gallon target will not be met in 2022.

27
     Advanced biofuels excludes cornstarch derived ethanol.

Petroleum Supply and Use in Washington State                                               18
Two emerging petroleum substitutes are the gas-to-liquids (GTL) and coal-to-liquids (CTL) conversion processes. 28 GTL technology converts natural gas to longer chain hydrocarbons that are typically used as a substitute for diesel. The conversion process is very capital-intensive and somewhat energy-intensive. It is currently economic only in a few places in the world where natural gas exists in large readily available reserves and is very inexpensive. Qatar and Shell recently developed the Pearl GTL project, but budget overruns have hurt profitability. A U.S. GTL project is planned for Saint Charles, Louisiana. 29 The CTL process is even more capital and energy intensive than GTL, but the feedstock (coal) is typically inexpensive. The Shenhua CTL project is a small facility that has been operating for several years in northern China. Energy security and not cost may be the primary reason that China is pursuing CTL. The EIA foresees modest development of GTL and CTL in certain countries, but only limited development in the U.S. over the next twenty years. The EIA forecasts that total U.S. liquids production will increase until about 2020 when it reaches 12.8 million barrels per day and then begin to slowly decline. See Appendix C for U.S. liquids production forecast. Canadian crude oil production, because of the vast size of the oil sands resource, is forecast to continue increasing for at least twenty years, possibly reaching 6.5 million barrels per day in 2035. Mexico has begun the complicated political process of opening its state oil monopoly to foreign investment which may eventually increase its production capacity. Overall, North American production is expected to increase rapidly for the next 5 years, and then more slowly through 2025. Figure 10 illustrates the trend in total U.S. liquids production (crude oil, natural gas liquids, and biofuels) from 2007-12, and forecasts production for 2013-14 (EIA March Short Term Energy Outlook (STEO)). The figure also shows total U.S. liquids consumption for the same period and the share of liquid fuels that are imported. Liquids production rises steadily from 2007 through 2014.30 Consumption, after peaking in 2007, declines during the recession of 2008-09, recovers a bit during 2010 and is then predicted to slowly decline during 2013-14 as the nation’s vehicle fleet continues to become more efficient. The share of liquid fuels covered by imports declines rapidly, starting at about 60 percent in early 2007 and forecast to decline to about 30 percent by the end of 2014. 28 SASOL is a South African company that in part specializes in making liquid fuels from coal or natural gas using the Fischer-Tropsch process. Many of the GTL or CTL projects around the world involve SASOL. 29 The Louisiana GTL project would produce more profitable diesel fuel. 30 The low point of U.S. crude oil production occurred in 2005. Petroleum Supply and Use in Washington State 19
Figure 10: U.S. Liquid Fuels Production and Consumption, 2007-14.

U.S. Crude oil imports
The U.S. has been a net importer of crude oil since the early 1950’s. The share of imported liquid
fuels (crude oil, refined product, and other liquids) peaked in 2005 at 60 percent (equivalent to
12.4 million barrels per day) and have been declining ever since. The import share of liquid fuels
was 45 percent in 2011 (equivalent to 8.5 million barrels per day), is about 40 percent as of early
2013, and is expected to be 37 percent in 2040 (equivalent to 6.8 million barrels per day).
Expenditures on imported crude oil and refined products reached a peak in 2007.

Five factors have contributed to the recent decline in import share:

    •   Increasing production of tight oil has displaced crude oil imports;

    •   Increasing biofuels production which has also displaced crude oil imports;
    •   Increasing production of shale gas has also increased the amount of natural gas liquids,
        some of which are used as inputs at refineries, displacing crude oil demand;
    •   Persistent high unemployment and wealth destruction following the 2007-09 recession
        has reduced demand for petroleum derived fuels; and
    •   Recent increases in light and medium duty fuel economy standards have reduced
        demand for gasoline and diesel.

Petroleum Supply and Use in Washington State                                                20
Figure 11 illustrates imports of crude oil and refined products over twenty years from 1993 to
2012. Net imports (solid blue line) represent crude oil imports (solid black line) plus the refined
(petroleum) product imports (dashed blue line) minus the refined product exports (dashed
black line). Total U.S. liquids production is shown in the figure. During 2011, the U.S. became a
net exporter of refined products. Prior to this, the U.S. was a net importer of both crude oil and
refined products. The combination of increasing U.S. liquids production (crude oil, natural gas
liquids, and biofuels), declining U.S. demand, and ample modern refining capacity has turned
the nation into an exporter of petroleum products. The refined product exports are primarily to
central and South America. The U.S. exports a small amount of crude oil and natural gas liquids,
but is overwhelmingly still a net importer of crude oil. 31 Because the nation still imports large
quantities of crude oil (3.1 billion barrels in 2012), and because oil and refined products are
internationally trade commodities, the price of imported and domestic oil will remain linked to
the global price structure.
Figure 11: U.S. international trade in crude oil and refined products.
Source: EIA, US Imports and Exports.
31
Crude oil exports require a special export license, while petroleum products do not.
Petroleum Supply and Use in Washington State 21As noted, the past five years have seen an increase in U.S. liquids production and declining
crude oil and refined products imports. Over roughly this period there has also been a dramatic
shift in the sources of U.S. imported crude oil, as shown below. Canadian crude oil production
and exports to the U.S. have surged, while Mexican exports to the U.S. after plateauing during
2004-06 have declined sharply as Mexico’s overall crude production has fallen. Imports from
Venezuela peaked in 1997 and have declined as production and political relations with the U.S.
have deteriorated. U.S. imports from West Africa nations began to rise about ten years ago, but
have declined over the last several years. Imports from Saudi Arabia, while somewhat volatile,
appear to have declined slightly over the past decade.
Figure 12: Select U.S. crude oil imports by country: 1993-2012.
Source: EIA Annual Energy Review
Figure 13 represents a one year snapshot (2011) of domestic liquids production and crude oil
imports. The domestic share has increased significantly from 2005 when it reached a low of 40
percent of total liquids production. The Canadian share of imports has risen rapidly over the
past decade. Since much of the imports from Canada is a heavier synthetic or blended crude oil
derived from the oil sands, some U.S. refineries have had to make significant investments to
alter their refinery processes.
Petroleum Supply and Use in Washington State 22Figure 13: U.S. Petroleum Supply 2011.
Source: EIA Annual Energy Review.
Washington State Petroleum Resources and Imports
Washington State has no oil producing basins, but did have a small production site during the
early part of the twentieth century. 32 As illustrated in Figure 14, most crude oil delivered to
Washington refineries originate from North American basins. 33 The majority still comes from
Alaska, but the production basins there have been declining for more than twenty years and
refiners have had to look for new sources of supply. Crude oil from the Canadian oil sands has
made up for most of the decline in supply from Alaska, but imports from Russia, Africa, and
OPEC countries have also been tapped. More recently, crude oil from North Dakota has begun
to arrive at Washington refineries via railcar.
32
Oil City located on the Pacific coast produced approximately 12,000 barrels of crude oil during 1957-1960.
33
The majority of Washington’s domestic crude oil and liquids supply is from Alaska. Smaller amounts are arriving
from North Dakota and perhaps Montana via railcar.
Petroleum Supply and Use in Washington State 23Figure 14: Washington crude oil supply 2012
Source: EIA, Company level imports 2012.
Petroleum Supply and Use in Washington State 24Transport and Refining of Crude Oil and Distribution of Refined Products
Transport of petroleum or crude oil in the U.S.
The primary means of transporting crude oil to refineries is by pipeline or by tanker (ship).
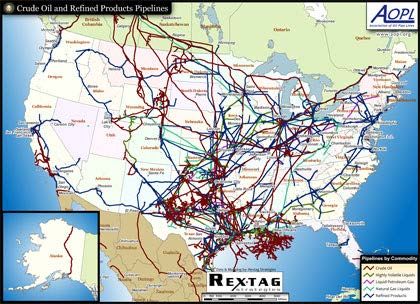
Figure 16 gives a sense of the extent of the crude oil and refined product pipeline network in
North America. The U.S. has approximately 50,000 miles of crude oil pipeline and 88,000 miles
of refined product pipeline. From 2005 to 2010, 96 percent of refinery crude oil receipts came
by pipeline and tanker, with roughly an even split between the two modes of transportation.
With relatively low costs and high capacity, pipelines have long been the delivery method of
choice for inland refineries.
Coastal refineries, on the other hand, have typically been served by tankers carrying
waterborne imports or offshore production. In 2011, this pattern began to change, and in 2012,
pipelines and tankers delivered only 93 percent of crude oil processed by U.S. refiners. The
percent of crude oil delivered to U.S. refineries by tanker has declined steadily since 2005, while
the percent delivered by pipeline has increased. The remaining 7 percent is made up primarily
of domestic crude supplies carried via barge, rail and truck, and though a relatively small share
it has been increasing rapidly since 2010. Truck transport of crude oil is more common near the
tight oil production fields in North Dakota and Texas, but because of the high cost of this form
of transport delivery distances are limited to a couple hundred miles.
Rail transport is also associated with these two producing regions, but because rail transport of
oil is lower cost than truck transport it can be delivered to refineries more than a thousand
miles from the producing area. Shipping oil by rail costs $10 to $15 per barrel; about twice as
much as the $5-7 per barrel it costs to move oil a similar distance by pipeline. 34 Despite the
higher cost, there are several factors currently in favor for using rail transport of crude oil from
the continental interior including:
• foremost is that pipeline development to move midcontinental oil is lagging from the
growing North American production,
• price discounts for continental interior oil are often large, 35 ranging from $20 to $50 per
barrel, which makes rail a viable alternative to pipelines,
• rail facilities (both at the refinery and in the producing region) can be developed very
quickly, and offer more delivery flexibility than pipelines,
• oil sands crude oil does not have to be mixed with as much lighter and expensive
hydrocarbon diluent when moved by rail which reduces cost.
34
http://www.eia.gov/todayinenergy/detail.cfm?id=7270. This is thought to be referring to transport from North
Dakota to the Gulf coast.
35
http://oilandgas-investments.com/2013/oil-prices/shipping-crude-rail/
Petroleum Supply and Use in Washington State 25Figure 15: North American crude oil and refined product pipelines. Figure 16: U.S. crude oil refinery receipts by pipeline and tanker. Petroleum Supply and Use in Washington State 26
Figure 17: U.S. crude oil refinery receipts by rail, truck and barge.

Petroleum/Crude Oil Refining in the U.S.
In 2013 the EIA reported the U.S. had 143 operable refineries with a total capacity of 17.8
million barrels per day. 36 Figure 18 shows the refinery count and capacity trend from 2000 to
2013. The long-term trend in the U.S. has been towards fewer, larger and more complex
refineries. In 1982 the U.S. had 301 operable refineries with capacity of 17.9 million barrels per
day. During the intervening 30 years independent, smaller, and older regional refineries have
closed as facility emission, refining, and fuel requirements became more challenging, leaving a
smaller number of larger refineries that have continued to add refining capacity. A downside of
fewer but larger refineries is when one or two are shut down for planned maintenance or due
to accident, regional fuel shortages can occur and prices can spike.

36
     Atmospheric crude oil distillation capacity, which is the “front end” of a refinery.

Petroleum Supply and Use in Washington State                                                27
Figure 18: Number and capacity of U.S. refineries, 2000 through 2013.
Transport of petroleum or crude oil in Washington
Crude oil arrives at Washington refineries by tanker, barge, railcar, as well as from Canada via
the TransMountain pipeline which is owned by Kinder Morgan. In 2011, 71 percent of crude oil
arrived by ship, 26 percent by pipeline and 4 percent by rail.
As noted before, tight oil production, because of its remote location and rapid expansion, has
limited transportation opportunities to reach west coast refineries. This caused several
refineries in the Pacific Northwest to contract for rail tanker transportation and to invest in
additional rail handling facilities at their sites. Two Washington refineries, U.S. Oil in Tacoma,
and Tesoro in Anacortes have developed facilities for quickly offloading crude oil delivered by
train from mid-continent producing regions. Each oil train transports up to 50,000 barrels of oil.
The two refineries located near Ferndale, BP Cherry Point and Phillips 66, are developing plans
to build facilities to accommodate oil delivered by train. The Shell refinery near Anacortes is in
the process of developing plans for delivery of oil by train. An oil shipment receiving terminal at
Hoquiam on the Washington coast is in the early development stage. It would be capable of
receiving one train carrying midcontinent oil every two days.
The largest announced project, in the early development stage, is a receiving terminal proposed
by Tesoro and Savage at the Port of Vancouver, which could handle 300,000 barrels per day of
oil delivered by train. 37 The Hoquiam and Vancouver projects are different as they would take
the midcontinent oil from the Bakken region or Canadian oil sands projects, and send the oil by
tanker to other west coast refineries, Alaska and Hawaii. While transporting oil by rail has the
37
http://www.komonews.com/news/local/Vancouver-port-deciding-on-oil-train-terminal-216591201.html
Petroleum Supply and Use in Washington State 28advantage of lower initial cost and flexibility, the long-term cost is higher than transport by
pipeline and potentially riskier as oil spills are more common with rail transport.38 However,
crude oil transported by rail is not assessed the five cent per barrel state fee 39 that is placed on
crude oil delivered by tanker or barge.
Petroleum/Crude Oil Refining in Washington State
Refineries are large, complicated production facilities that rely on chemical and physical
processes to separate and convert crude oil and other liquids into refined petroleum products.
The U.S. has 144 operating refineries with a combined refining capacity of 18.6 million barrels
per day. In 2012, Washington state refineries had a combined refining capacity of 657,000
barrels per day, which represents about 3.5 percent of the nation’s total capacity. 40
The five Washington refineries are:
• BP West Coast Products LLC: Built 1971 at Ferndale, 234,000 Barrels per day.
• Shell Oil Products US: Built 1957 at Anacortes, 149,000 Barrels per day.
• Phillips 66 Co. : Built mid 1950’s at Ferndale @ 107,500 Barrels per day.
• Tesoro West Coast: Built 1955 at Anacortes @ 125,000 Barrels per day.
• U.S. Oil & Refining Co.: Built 1957 at Tacoma @ 42,000 Barrels per day.
These refineries produce more refined product than is needed by Washington State. In 2011
approximately 35 percent of the combined refinery output was sent to domestic consumers,
mainly in Oregon and California. Approximately 14 percent was shipped to foreign consumers,
mostly to British Columbia. 41 The Chevron and Yellowstone pipelines deliver about 12 percent
of the state’s refined product, serving mainly eastern Washington.
A barrel of crude oil contains 42 gallons and nationally, on average, is converted into 20.3
gallons of gasoline, 13.3. gallons of diesel, 4.3 gallons of jet fuel, 1.8 gallons of liquefied
petroleum gas (LPG), and 1.3 gallons of residual fuel. The remaining 4 gallons are made up of
petrochemical feedstock, asphalt, and petroleum coke. The quantities of the fuels vary by
refinery and the crude oil that is processed by the refinery. Because refining alters the
molecular make-up and density of the crude oil feedstock, after refining there is usually about 6
38
http://www.bloomberg.com/news/2013-04-08/killing-keystone-seen-as-risking-more-oil-spills-by-rail.html
39
The fee is comprised of four cents per barrel oil spill administration fee to fund oil spill preparedness programs,
and a one-cent per barrel oil spill response tax, which as of April 1 2013 has been temporarily suspended.
40
Refining capacity is measured in barrels per stream day or barrels per calendar. The numbers are barrels per
stream day, which is the larger number.
41
Oregon does not have any oil refineries and is supplied primarily by refineries located in Washington and
California. British Columbia has two small refineries but also has to import refined product.
Petroleum Supply and Use in Washington State 29You can also read


