Review of Swiss Electricity Scenarios 2050
←
→
Page content transcription
If your browser does not render page correctly, please read the page content below
Review of Swiss Electricity Scenarios 2050
Report prepared for the Group Energy Perspectives and the Swiss Competence
              Center for Energy Research “Supply of Electricity“ (SCCER SoE)

                                            Martin Densing, Stefan Hirschberg, Hal Turton

                                                                    PSI Bericht Nr. 14-05
                                                                         December 2014
                                                                        ISSN 1019-0643
Review of Swiss Electricity Scenarios 2050

Report prepared for the Group Energy Perspectives and the Swiss Competence
              Center for Energy Research “Supply of Electricity“ (SCCER SoE)

                                            Martin Densing, Stefan Hirschberg, Hal Turton

                                                          Energy Economics Group (EEG)
                                             Laboratory for Energy Systems Analysis (LEA)
                                                                The Energy Departments
                                                               Paul Scherrer Institut (PSI)
                                                           5232 Villigen PSI, Switzerland
                                                                    Tel. +41 56 310 2361
                                                                    Fax +41 56 310 4411
                                                                              www.psi.ch

                                                                    PSI Bericht Nr. 14-05
                                                                         December 2014
                                                                         ISSN 1019-0643
Abstract
We review recent scenario studies of the Swiss electricity system. Input assumptions and results of
eight studies are compared. On the input side, potentials and costs of technologies, and the assumed
socio-economic environments of the scenarios are evaluated; on the result side, we consider the elec-
tricity demand, the supply mix and its costs, carbon emissions, and the flexibility of supply. We report
also on the modelling frameworks of the studies with their assumptions.
If the assumptions in the postulated scenarios are considered as feasible, then the resulting pathways
of the electricity system are indeed plausible; for example, the low electricity demand in some scenar-
ios is a consequence of assumptions on aggressive efficiency gains in all energy demand sectors, or
even due to additionally assumed behavioural changes, which are not analysed in full detail in the
studies.
As a general result on the supply side, if nuclear power is phased-out, then net import or gas-powered
generation is very likely needed at least in the mid-term (around year 2035), that is, before 2050
where—according to some studies and depending on the demand level—renewables could be suffi-
ciently deployed. In most of the scenarios, the electricity prices will maximally double, which is partial-
ly due to the higher costs of intermittent renewables, for example solar photovoltaic and wind. Some
studies use models with hourly time resolution; those models show that power storage and especially
the pumped-storage hydropower plants must be used more intensively in the future because of inter-
mittent supply.
Hence, more advanced, future studies should analyse in more detail the link between electricity gen-
eration, storage, and demand. The uncertainty in future market regulations and in energy-policy inter-
ventions, as well as uncertainty in future cost and unknown decisions of competitors induce invest-
ment risks for suppliers. Therefore, it is of interest to evaluate in the future studies also the profitability
for different types of market participants.
1 Introduction
We review selected scenario studies for the Swiss electricity system. The considered studies were
published in the years 2011–2013, that is, after the severe accident in the nuclear power plant Fuku-
shima in Japan of March 2011 and the subsequent decision of the Swiss Federal Council to gradually
phase-out nuclear power of May 2011. Currently, the electricity generation in Switzerland relies heavi-
ly on nuclear power; see Table 1 with the current supply mixes of Switzerland and neighbouring coun-
tries. The principal goal of the Energy Strategy 2050 of the Swiss Federal Council is an energy supply
that allows affordable prices and a level of security of supply as of today, as well as less CO2-
emission than today [7]. Relative to the neighbouring countries, Switzerland has the lowest share of
electricity generation from fossil fuels and from other renewable sources than hydropower (i.e., photo-
voltaic, wind, biomass, geothermal); see Table 1. Consequently, a main focus in the considered stud-
ies is on the supply side for these two largely unexplored options to achieve—at least partially—the
goals of the Energiewende (energy transition).
The reviewed studies are listed in Table 2; the major focus of the studies is the electricity system.
Hence, studies that focus on the wider economy and the entire energy system of Switzerland are not
considered ([10], [18], [31]).The review aims to support decision-makers in assessing the range of
Table 1: Electricity supply in year 2012 of Switzerland and neighbouring countries (in % and in TWh/y)
Other Re-
newables
Country Fossil Nuclear Hydro Net import Demand
(biomass,
PV, wind)
TWh/y TWh/y TWh/y TWh/y TWh/y TWh/y
Switzerland [5] 3% 2 37% 24 61% 40 3% 2 -3% -2 100% 66
Austria [19] 23% 17 - - 63% 48 10% 7 4% 3 100% 75
Italy [43] 55% 181 - - 12% 41 19% 63 13% 43 100% 328
France [37] 10% 48 81% 405 13% 64 5% 25 -9% -44 100% 497
Germany [17] 60% 361 16% 100 4% 22 24% 147 -4% -23 100% 607
all countries 39% 610 34% 528 14% 214 16% 244 -1% -23 100% 1573
2 of 48options exhibited by the different scenarios of electricity supply and demand, and it aims to help in-
dustry experts and researchers to improve scenario development and model transparency.
For each scenario, the assumed socio-economic boundary conditions and the reported key drivers
are reviewed. We compare input parameters, for example technology potentials and costs, and as-
sumed efficiency gains (if reported). We report on details of the used modelling frameworks, their
scope and implicit assumptions (in case such information is publically available). The following major
groups of results are compared: electricity demand, electricity supply mix, levelized generation costs,
retail prices (if reported), and CO2-emissions.
The review tries also to evaluate the robustness of scenario results with respect to the inherent op-
tionality and the exogenous variability of the future electricity system. A related issue is the share of
imports in the seasonal supply mix with its implications on energy security. We also evaluate how
decision-making under uncertainty is taken into account; for example by deterministic (wait-and-see)
decisions or by including the optionality of future decisions.
In the next section (Sect. 2), we provide for each study a short description of the scenario assump-
tions, and we explain the modelling framework. In Section 3, the assumptions on electricity demand
are compared. In Section 4, we report on the assumed potentials of renewable power generation. In
Section 5, the annual electricity mixes over time are compared. In Section 6, we consider costs; for
comparison, we focus mainly on technology costs and levelized production cost of the mix. The result-
ing CO2-emissions from the generation mix are shown in Section 7. The variability and the flexibility of
the supply in the scenarios are considered in Section 8. Some additional statistical charts are provid-
ed in Section 9; a forthcoming research paper will elaborate more on statistical decomposition. In the
conclusions and outlook (Sect. 10), we comment—among others—on the transparency of the studies,
which is relevant for impartial energy policy decisions. In this regard, we extracted all the reviewed
information from the published studies itself (or from clearly indicated supplementary sources that
were publically available). Importantly, this review tries not to be biased towards a desirable future
scenario outcome of a particular study.
Table 2: The reviewed studies and their namings in this report
Acronym Title (short) Authors Title (full) Year
BFE Energieperspektiven Swiss Federal Office of Die Energieperspektiven für die 2012
Energy (BFE) / Prognos Schweiz bis 2050 [33]
AG
VSE Stromzukunft Verband Schweizerischer Wege in die neue Stromzukunft – 2012
Elektrizitätsunternehmen Gesamtbericht [46]
(VSE)
ETH / ESC Energiezukunft ETH Zürich / Energy Sci- Energiezukunft Schweiz [1] 2011
ence Centre
Green- energy [r]evolution Greenpeace Switzerland energy [r]evolution – Eine nachhalti- 2013
peace ge Energieversorgung für die
Schweiz [44]
Cleantech Energiestrategie Swisscleantech Business Cleantech Energiestrategie – Richtig 2013
Associtation rechnen und wirtschaftlich profitie-
ren, auf CO2-Zielkurs [2]
SCS SCS-Energiemodell Super Computing Sys- SCS-Energiemodell – Simulation 2013
tems AG (SCS) der elektrischen Energieversorgung
der Schweiz anhand von konfigu-
rierbaren Szenarien [40]
PSI-sys PSI energy system Nicolas Weidmann, PhD- Transformation strategies towards a 2013
model Thesis (PSI/ETHZ) sustainable Swiss energy system –
an energy-economic scenario anal-
ysis [48]
PSI-elc PSI electricity model Paul Scherrer Institute (i) Energie-Spiegel Nr. 21 [36] 2012
(PSI) (ii) Swiss Electricity Supply Options:
A supplementary paper for PSI's
Energie-Spiegel Nr. 21 [28],
(iii) The Swiss TIMES Electricity
Model (STEM-E): Updates to the
model input data [27]
3 of 482 Summary of Scenario Assumptions and Modelling frameworks
In this section, we summarize for each study (Table 2) its scope, the general scenario assumptions,
and the used modelling framework; major quantitative assumptions, for example technology costs,
potentials, and demand, are presented in subsequent sections. Usually the studies consider several
scenarios, which allow exploring different socio-economic and political boundary conditions (see Ta-
ble 4 for a list of all scenarios).
2.1 Common Assumptions
Some assumptions and model restrictions are common to most of the scenarios of the studies as
follows.
Nuclear phase-out
This review considers only scenarios that were published after the decision of the Swiss Federal
Council to phase-out nuclear power. Hence, most of the scenarios assume that nuclear is gradually
phased-out. For comparison and for purpose of research, the SCS study and the PSI-elc study in-
clude scenarios with new nuclear plants; similarly, for comparison, the study ETH/ESC evaluates the
economic impact of the phase-out.
Separate models of demand and of supply
In most of the studies, the used modelling framework separates modelling of electricity demand from
modelling of electricity supply as follows. In a first step, the demand over time in a scenario is calcu-
lated by a demand-side model. Then, a supply-side model matches the demand with currently availa-
ble production capacity, with trade of electricity, and with new production capacity that is built accord-
ing to a set of rules or an objective, for example by minimizing electricity system costs.
By contrast, a fully integrated model allows for changes in demand that are triggered by a price-signal
from within the model (elastic demand model). Such an integrated model is used as a supplementary
model in the ETH/ESC study; this economy-wide equilibrium model has endogenous (aggregated)
energy prices. In this study, this model is used to verify qualitatively the cost-results of a supply-side
model ([1], p. 42). Currently, the drawback of such models is the low detail in technology. A less inte-
grated approach (but allowing more details) is the energy-system model of the PSI-sys study [48] (see
also [47]): The model simultaneously optimizes the technology and fuel choices for the supply of en-
ergy, for the conversion of energy, and for the end-use technologies; the energy-service demands are
given as inputs. Such energy system models can evaluate the optimal substitution between energy
carriers across demand sectors (e.g. fuel substitutions in the residential, commercial, and transport
sector). In contrast, a (simple) demand-side-only model simulates each demand sector separately.
Indeed, several studies mention that more integrated analyses could be beneficial ([46], p. 94; [33],
p. 49).
Models of electricity grid
The electricity grid is not properly modelled; the most detailed approach is in the SCS study, where
the grid is represented simply by in- and out-feeds at several voltage levels; the representation can
account for lower grid costs for decentralized generation. Nevertheless, a proper model of the grid
would be a so-called power flow model (either AC flow or the more simple DC flow approximation).
Consequently, reported costs for grid refurbishment and for grid expansion are almost entirely based
on the two studies on the transmission and the distribution grid by the consulting company Consentec
on behalf of BFE ([13], [14]); for example, the BFE and the VSE study refer to those studies. Indeed,
the analysis of integrating decentralized generation (e.g. PV) into the distribution grid is an ongoing
research topic in the current SCCERs (Swiss Competence Centers of Energy Research).
Models of energy markets
Most of the models take the view of a central, socio-economic planner for Switzerland. The models do
not consider future market designs which would satisfy stakeholders on the demand- or supply-side.
For example, the BFE study mentions that “questions of the required and efficient market design are a
next step” [33] (p. 799); the Cleantech study states that markets for renewables would be efficient if
prices included all external costs, for example total social or life-cycle costs [2] (p. 33); though, a
quantification for any technology is not given in this study.
4 of 48The previous common assumptions, that is, (i) nuclear phase-out, (ii) separate modelling of demand
and of supply, (iii) no grid and market model, are taken for granted in the in the following summary of
each study and are generally not mentioned anymore.
2.2 BFE (Energieperspektiven)
The author of the study is the consulting company Prognos AG on behalf of the BFE. The compre-
hensive study has more than 900 pages and was published in September 2012 [33]. The scope of the
study is the entire Swiss energy system until year 2050. The study considers three energy-demand
scenarios and four electricity-supply scenarios.
General Assumptions
Three demand scenarios are considered: Weiter Wie Bisher (WWB), Neue Energiepolitik (NEP) and
Politische Massnahmen (POM). The demand scenarios are assumed to have the same overall socio-
economic drivers as follows. The population is assumed to follow a single scenario, that is, the medi-
um scenario A-00-2010 of the Federal Institute of Statistics (BfE), which has approximately 9 mio.
inhabitants in 2050 [5]. The assumed averaged GDP growth rate between 2000 and 2050 is 1.1%
(p.a., real), and is based on an estimate of SECO [41]. The historical structural changes of the econ-
omy are assumed to continue: Energy-intensive primary industry and low-tech consumer industry are
declining, whereas high-tech industry, e.g. chemistry and electronics, as well as the construction and
2
the commercial service sector are expanding. The heated floor area is expanding from 709 million m
2
in year 2010 to 938 million m in 2050, with the largest part in the housing sector, which floor area is
2
increasing because of increasing population and of an increasing heated floor area of 74 m per per-
2
son in 2050 (62 m per person in 2010) [33] (p. 52, p. 60).
While the general socio-economic drivers are the same in the scenarios, the low-demand NEP sce-
nario assumes some future social activity changes, for example in the transport sector, where the total
person-kilometres-per-year in Switzerland is lower in the NEP scenario than in WWB and POM, and
transport mode is shifted to rail transport; see Table 5, and [33] (p. 67).
The discount rate is 2.5% p.a.; the discount (capital) rate is the rate to convert investment costs into
yearly amortized costs by using the lifespan of a technology [33] (p. 41).
Imports are assumed to be available at requested amounts at (generally) constant pric-
es [33] (p. 202); the prices are taken from other European energy studies [33] (p. 227).
Scenario Assumptions
In the scenario WWB, today’s political laws and incentives will stay in place and there will be no ac-
celerated energy policy and no major additional policy measures until 2050. The rate of efficiency
increases until 2050 by continuing historical trends (dynamics-as-usual); the political guidelines for
increased efficiency are following correspondingly. The deployment rate of electric vehicles is small
(Table 5). The CO2 price increases to a moderate 56 USD(2010)/tCO2 in year 2050 (same price as in
POM scenario).
The scenario NEP is a target scenario: The target is a range of 1 to 1.5 ton of CO2-emissions per
person in year 2050; the NEP scenario fulfils the target of 20% CO2-reduction in year 2020 with re-
spect to 2000 values. The scenario assumes strong international collaboration in technology devel-
opment and in climate policy; for example, the CO2-price is assumed to be 137 USD2010/tCO2 in
2050 [33] (p. 69). In this scenario, energy service demands are assumed to be reduced by strong
policy measures.
The scenario POM envisages an increased rate of energy policy measures until 2050 than today.
The policy measures have a wide range, with the primary goal to achieve large efficiency gains in all
energy sectors (commercial, residential, industrial, and transport sector). The envisaged measures
include guidelines for increased efficiency in space heating, appliances and vehicle drivetrains.
An example of the assumed efficiency increase of appliances is shown in Figure 4 and Figure 5.
The assumptions of the electricity-supply scenarios (so-called variants) are as follows.
In variant C, the nuclear power plants are replaced by combined-cycle gas turbine (CCGT) plants
that are centrally installed and fuelled by fossil natural gas. The electricity net import over a year is
assumed to be zero. Renewables are supported according to today’s policy assumptions. The de-
5 of 48ployment of decentralized CHP plants is market-driven and as well as under today’s policy assump-
tions. The KEV (Kostendeckende Einspeisevergütung), that is, the tax on retail electricity prices to
subsidise renewables, stays at its 2013 level of 0.9 Rp./kWh [33] (p. 201).
In variant E, the nuclear power plants are replaced by renewable generation according to ambitious
deployment paths, whereas the deployment of CHP is market-driven as in variant C. The KEV in-
creases to maximally 2.1 Rp./kWh [33] (p. 202). Despite the large deployment of renewables, the
obtained results of the study show supply gaps, especially in the years 2022, 2035–2045 [33] (p. 6);
the gaps are filled with imports.
In variant C+E, renewables and decentralized CHP are deployed as in variant E (the potentials are
also the same). The KEV is maximally 2 Rp./kWh. In contrast to variant E, the supply gap is now filled
by CCGT plants.
In variant C+D+E, the renewables are deployed as in variant E (renewables have also the same po-
tentials as in E). The supply gap is filled by CCGT plants and in addition by an increased deployment
of decentralized CHP plants. This scenario was added to the main study in an appendix.
Modelling Framework
The projections on the demand-side (electricity consumption) and on the supply-side (electricity gen-
eration) are calculated by bottom-up simulation models; bottom-up models are technology detailed
models. Generally, the models are developed by the consulting company Prognos AG; the demand-
side model for the mobility sector is originally from Infras AG.
Demand-side models: Each demand sectors of the energy systems, that is, residential, commercial,
industry and transport sector, has a simulation model to project energy demands. For example, de-
mand for household appliances is calculated as follows. The set of appliances is partitioned in detail,
for example in different cooling, heating, electronic media, and lighting devices with own input as-
sumptions. The time series that are input to the model are: the number of households, the devices’
efficiency, their size per household (includes an assumed substitution by other devices) and lifetime of
the devices. The current demand is simply obtained by dividing the number of devices by its assumed
efficiency, and summing over the devices. Some of the input parameters depend on policy assump-
tions, for example the efficiency and size; see Figure 4, Figure 5, and [33] (p. 15).
The supply-side model of electricity generation is a simulation model with yearly time steps; each
year is split additionally in a winter and summer interval. The input is the electricity demand and the
potentials per technology, and the output is the generation mix and the imports. The growth rates of
technologies are determined by scenario assumption. Costs have apparently no influence on deploy-
ment [33] (p. 34–35, Fig. 2-9). Hence, costs are calculated after the generation mix is determined.
The deployment rates of renewables, of CHP and hydropower plants are independent of the gap be-
tween existing production and future demand, and are given by scenario assumptions; the only varia-
bles are the amounts of import and of CCGT (p. 35). Those amounts seems actually also to be pre-
determined because imports and CCGT are mutually exclusive in the scenarios (at least in the final
year 2050).
The aforementioned supply-side model is a production planning model with winter and summer sea-
sons; to ensure that the calculated generation capacity is sufficient also on an hourly time-scale, a
dispatch-model is used in an ex-post analysis [33] (p. 7, pp. 790–830, Appendix II.3). This model has
hourly time-steps with a yearly time-horizon; it is confined to Switzerland. The link to the production
planning model is by the condition that the hourly electricity demand and supply add up over time to
the previously determined yearly totals. The hourly demand, which is an input to the model, is a de-
trended time series based on data of the years 2007–2011 [33] (p. 792). The assumed hourly genera-
tion of wind power and of PV is a synthesized, “typical” profile based on data from the years 2004–
2011. The production of hydro-storage plants is assumed to be the long-term seasonal average gen-
eration amount [33] (p. 797). Hydro pumped-storage plants are assumed to have a maximal produc-
tion of 200 GWh per year. Hence, storage options are not (yet) modelled in every detail. The dispatch
model is a simulation model: The dispatch of the flexible part of generation is triggered in a fixed prior-
ity order: The (pumped-) storage plants are dispatched first, and then plants as the CCGT plants that
have more CO2-emissions [33] (p. 797). Results are reported in the study for the two scenarios
WWB+C and NEP+C+E, which have no net-imports of electricity over the year (that is, the modelling
of trade seems to be neglected).
6 of 482.3 VSE (Stromzukunft)
The report is published by the industry organisation Verband Schweizerischer Elektrizitätsunter-
nehmen (VSE) in 2012; it has 126 pages [46]. The scope of the study is the Swiss electricity system
until 2050; hence, this study (as well as the SCS and the PSI-elc study) do not consider the other
sectors of the energy system and can therefore focus in more details on electricity. The study consid-
ers three scenarios. The modelling partner, the consulting company Pöyry, published also a comple-
mentary report [32] (currently not officially linked on VSE webpage).
General Assumptions
The study encompasses three scenarios, called Scenario 1, 2 and 3, which have an increasingly
stringent energy policy from 1 going to 3. All three scenarios allow annual net-imports and new, cen-
trally installed CCGT plants. The CO2-price increases to 60 EUR/tCO2 in 2035 and stays flat thereaf-
ter for all scenarios [32] (p. 28); the increase of CO2-price is meant to reflect historically trends. The
required compensation of CO2-emissions is different in the scenarios; for example, imported electricity
needs a renewable certificate in Scenario 3. The influence of a different discount factor (5% or 10%)
on annualized investment costs are commented in detail [46] (e.g., Fig. 6.3); nevertheless, the actual
factors used in the modelling seems not to be reported in the main report [46], but only in the com-
plementary report with varying factors across technologies from 8–13% [32] (Appendix A.1, p. 1.,
“Required return”).
Scenario Assumptions
In Scenario 1, energy efficiency grows moderately. Similarly, the growth of renewables and of decen-
tralized generation is moderately more than the historical trend. The increased growths are enabled
by a moderately more stringent energy policy than today; hence, the policy is (slightly) more stringent
that in the scenario WWB of the BFE study [46] (p. 27). The efficiency measures, for example in light-
ing and heating, help to lower the growth of electricity demand. Nevertheless, the demand is assumed
to increase almost linearly until 2050 by population and economic growth, by increased electric road
mobility and by increased use of heat pumps, which substitute fossil fuels. Annual net-imports of elec-
tricity and new CCGT plants are allowed; indeed, the model results show that both options are in-
creasingly deployed until 2050. An additional scenario variant with restricted amounts of imports is
used to explore the issue of energy security. The CO2-emission from CCGT plants are allowed to be
compensated non-domestically within the European emission trading system [46] (p. 27). Because
electricity and heat demands are relatively high, the potential for demand-side load-shifting is the
largest in this high-demand and low-efficiency scenario [46] (p. 43).
In Scenario 2, the authors assume an internationally coordinated climate policy, and renewable gen-
eration is assumed to be widely deployed in Europe. Stringent efficiency guidelines are in place in
Switzerland and in line with those in Europe (e.g., Germany is assumed to have 62% renewable pow-
er in 2050 [46] (p. 27). The demand increases until 2035 because of population and economic growth,
of more electric road mobility, more heat pumps, and the lifetime of existing, less-efficient installations.
The increase of demand is stopped after 2040. Imports and new CCGT plants are allowed and are
intended to be used transitorily (which is also reflected in the model results).
In Scenario 3, the electricity generation is assumed to be by 100% renewables on a yearly basis in
2050. In comparison to Scenario 2, the energy policy towards more efficiency and more renewables is
even more stringent in Switzerland and in Europe; for example, it is assumed that Germany’s produc-
tion in 2050 is 72% renewable [46] (p. 27), an energy-plus buildings become standard [46] (p. 38). In
Scenario 3, the society aims towards the 1-ton-CO2-per-person society, which implies changes in
personal behaviour to enable large energy savings with declining demands towards 2050. Electric
mobility increases more than in Scenario 2. Import of electricity and new CCGT plants are used transi-
torily (which is also reflected in the model results). The CO2-emissions from electricity import is com-
pensated fully with CO2-certificates (Grünstromzertifikate) [46] (p. 97, 98).
The CO2-price on these certificates is assumed to be 22 EUR/tCO2 in year 2015, and 60 EUR/tCO2 in
2050 [46] (p. 97), which is the common long-term CO2-price in the three scenarios.
Modelling Framework
In the demand-side model, the electricity demand is reported to be split into 23 demand sectors
[46] (p. 42). In each sector, the number of devices and the energy consumption per device is as-
7 of 48sumed to follow a specific future scenario path. The assumed flexibility of demand and the win-
ter/summer-share is reported to be also evaluated per sector.
The supply-side model was developed by the consulting company Pöyry AG. The cost-optimization
model comprises the electricity supply sector of Switzerland as well as that of the surrounding Cen-
tral-European countries. Among the input parameters are the electricity demands of Switzerland and
of these European countries, which are given by the three different scenario assumptions. The de-
ployment paths over time of the different renewable generation types (i.e. the yearly production by
water, biomass, PV, wind, and geothermal power) are given exogenously by the scenario assump-
tions. Hence, the (linear) model optimises the costs of the electricity system by choosing an optimal
solution mix of new gas plants (CCGT and CHP) and import volumes. The used model with name
“Zephyr” seems to be a dispatch-planning as well as a capacity-planning model (although the ability of
endogenous capacity-planning seems currently not to be advertised on Pöyry’s webpage). The pro-
duction mix of the surrounding countries, especially the share of renewables, is chosen to be in-line
with the scenario assumption for Switzerland.
The model has hourly time steps with time horizon at year 2050. For each year, the electricity supply
has to satisfy the demand in each hour for 6 different yearly weather-profiles. The profiles, which are
time series of wind, of water-availability and of solar radiation, are from the years 2005 to 2010. The 6
time series can be considered as the 6 scenarios of a (simple) stochastic programming model; hence,
the model solution is robust against at least some parts of uncertainty. The hourly historical data en-
sures correct (auto-) correlations. The hourly time-scale allows for example to model the curtailment
of wind power in order to avoid ramping costs of other, inflexible production technologies [46] (p. 79).
Minimal out-of-service times and minimal operation times of large-scale plants are also modelled. It
seems that CO2-costs (especially the certificates used for imports in Scenario 3 ([46], p. 97) are not
included in the objective of the optimization model.
2.4 ETH/ESC (Energiezukunft)
The report from the ETH Zürich has the lead author from its Energy Science Center (ESC) and was
published in November 2011; the report has 48 pages [1]. The scope of the report is the entire Swiss
energy system until year 2050.
General Assumptions
The three considered scenarios are called Hoch, Mittel, and Niedrig. They correspond mainly to dif-
ferent demand scenarios, which are related to the population scenarios of the Swiss Federal Office for
Statistics [8]: Hoch, Mittel, Tief [1] (p. 18).
Scenario Assumptions
The scenarios are normative: The goal is 1 ton of CO2-emission per person and year in the year 2100,
which translates to 1.6 ton in 2050 [1] (p. 6, p. 11). It seems that these emissions exclude CO2-
emissions from imports.
Modelling framework
All models are maintained by the ETH.
A demand-side model determines the energy demands based on assumed pathways of population
and of GDP, as well as by assumptions on structural changes, electricity prices and “technological
innovations” [1] (p. 9). The model seems to be a simulation (or accounting) model; unfortunately,
many more details are not disclosed in the study itself.
The supply-side model is a technologically detailed, bottom-up model; the main output per scenario
is the supply mix of the generation technologies per year until the time horizon 2050; in addition, for
the Scenario Mittel, the winter/summer share for the year 2050 is reported. The amounts of renewa-
bles are determined in each scenario by the assumed socio-economic potential and by assumed de-
ployment rates. The gap between the renewable generation and the given demand is assumed to be
either filled by CCGT plants or by import (the share between the two options is not provided).
Complementary to the demand- and the supply-side model, an economy-wide model “top-down”
model called CITE (Computable Induced Technology and Energy) is used to evaluate the response of
the whole Swiss economy on the phase-out of nuclear power. The model belongs to the class of com-
putable general equilibrium (CGE) models; the economic growth is endogenous in the model and
8 of 48determined by decisions of the different agents [1] (p. 37). The production factors of the CGE model
are energy, labour and capital; the factors are substitutable in the major economic sectors to different
degrees. There are currently three electricity generation technologies in the model: nuclear, hydro and
other renewables generation [1] (Fig. 16, p. 38); a more detailed model is in preparation [1] (p. 38).
The major outputs of the model are the growth of GDP and energy prices (which include as an aggre-
gate the electricity prices).
2.5 Greenpeace (energy [r]evolution)
The study was published in November 2013 by Greenpeace Switzerland and Greenpeace Interna-
tional and has 80 pages [44]. The scope is the entire Swiss energy system. A single scenario of the
future energy system is considered.
Scenario Assumptions
The single scenario is a target scenario with a reduction of 95% energy-related CO2-emissions in year
2050 with respect to 1990 [44] (p. 16). The GDP and population assumptions are from the BFE study
[44] (p. 21). The electricity mix is based on the “100PRO-Strommix” of the organisation Umweltallianz
[44] (p. 10, p. 21); see also [45]. This mix aims at a share of renewable production of at least 90% in
2050. The potential of geothermal power is according to the BFE study [44] (p. 10). The CO2-price is
assumed to be an internationally valid price of 30 EUR(2010)/tCO2 in 2030 and 57 EUR/tCO2 in 2050
[44] (p. 67). The scenario has a variant Sufficiency, which is used for selected results. In this variant,
behavioural changes in the society towards less use of energy-services are assumed: for example,
the private floor area and the mobility demands in year 2050 stays on the level of 2010 [44] (p. 19).
The scenario assumes a relatively large amount of (stochastic) solar and wind generation; excess
generation is assumed to be partially converted to storable energy carriers by power-to-gas technolo-
gies; for example, 10 TWh per year in year 2050 of electricity are assumed to be converted into hy-
drogen by electrolysis [44] (p. 77); though, the study does not report the corresponding production
costs. Annual electricity imports are limited to maximal 8 TWh (this amount is actually used in inter-
mediate years). We acknowledge that the presented scenario is extensively compared with the sce-
nario POM from the BFE study.
Modelling Framework
Greenpeace partnered with the group of Systems Analysis and Technology Assessment of the Insti-
tute of Technical Thermodynamics at the DLR in Germany and used their model Mesap/PlaNet [44]
(p. 21). Inputs to the model are the future shares of energy carriers and the energy demand. The en-
ergy demand is based on assumptions of population, GDP, demand for mobility, floor area, and of
energy intensities per economic sector. The simulation model PlaNet is representing the energy sys-
tem. Hence, it incorporates the network of different energy flows and energy conversion technologies.
It is a target-oriented simulation model (and seems not to be an optimization model). The model
PlaNet belongs to the company Seven2One; the original version is described in [39].
To model the dispatch on an hourly time scale over a single year, the dispatch-model of the SCS
study [40] is used [44] (p. 24, footnote 31). Input data is the hourly time series of weather and demand
of year 2010. In a sensitivity analysis, weather data also from years 2003 to 2012 was used to test the
robustness of the solution [44] (p. 29, p. 32).
2.6 Cleantech (Energiestrategie)
The study has publication date January 2013 and encompasses 39 pages [2]. The scope is the entire
energy system in Switzerland. The report is a summary; members of the business association Clean-
tech are entitled to get more information [2] (p. 39). A single scenario is considered.
General Assumptions
A major and most distinguishing assumption to other studies is that all costs in the scenario are ac-
counted on their full cost basis (“Vollkostenrechnung”) [2] (Table 5, p. 33; p. 37). The authors argue
that currently some (indirect) costs are neglected in evaluating energy production technologies and
market prices should include all costs, which include life-cycle costs, external costs and accident risk
premiums.
9 of 48Scenario Assumptions
The study considers a scenario that tries to balance between efficiency measures and expansion of
renewable generation by an economically feasible pathway [2] (p. 16). The scenario is goal-oriented;
the two main goals related to the electricity sector are: (i) production and import of electricity are
100% renewable in 2050 (this satisfies the related goal of 1 ton CO2 per person and per
year) [2] (p. 13); and (ii) electricity production should be eventually cost-effective [2] (p. 15). The as-
sumed potentials are such that their availability is proven as of today except for the speculative poten-
tial for geothermal [2] (p. 15). On the demand side, it is assumed that most of the buildings are heated
with heat pumps in year 2050 with an average efficiency of 500% [2] (Table 1, p. 18). The amount of
electricity demand in 2050 is ambiguous: 70 TWh/y or 80 TWh/y [2] (p. 24, p. 35). To assess the mac-
ro-economic impact of the scenario with the nuclear phase-out, the authors refers to the ETH/ESC
study; the reduced growth of GDP is considered negligible.
Modelling Framework
The model has 50 fixed parameters and 50 other parameters that are adjustable to scenario assump-
tions [2] (p. 16); examples of adjustable parameters are efficiencies and potentials. More details may
be disclosed to members of Cleantech.
2.7 SCS (SCS Energiemodell)
The model SCS-Energiemodell of the study with the same name is developed by the consulting com-
pany SCS Supercomputing Systems AG. The published information of the study so far is a slide-
presentation (version 1.2, June 2013; model version 1.4 of May 2013) having 131 slides [40]. The
scope of the study and of the model is the electricity dispatch in a single future year, that is, genera-
tion capacities are an input to the model (capacity expansion planning is not considered). The scenar-
ios encompass an example scenario and eight other scenarios, including two scenarios with demand
and capacity data from the BFE study (scenarios NEP+E and WWB+C+E).
In contrast to the other studies, this study presents not a broad scenario analysis for explicit policy
recommendations. Instead, the study reports examples of inputs and corresponding outputs of the
proposed simulation model. One of the major goals of the model is “to be transparent and a basis for
consensus” [40] (p. 5). The model “is as simple as possible and as complicated as needed” [40] (p. 6,
p. 26) and “open to allow expert reviews” [40] (p. 6); though the model is not (yet) downloadable from
the web site. The study mentions that the model is work-in-progress with various possible model ex-
tensions, for example to calculate an optimized dispatch instead of using the current, fixed merit order
[40] (p. 27).
General Assumptions
In the modelling framework, the discount rate and lifetime can be chosen separately for each technol-
ogy and is explicitly reported, for example nuclear power has 6% p.a. and PV has 3% p.a. [40] (e.g.,
p. 41).
Scenario Assumptions
Two of the considered scenarios correspond to the scenarios NEP+E and WWB+C+E of the BFE
study. The input parameters taken from BFE study are based on the yearly demands and the yearly
generation capacity (or amount) per technology; unfortunately, the assumed electricity demand after
losses seems to be the demand before losses in the BFE study [34]. The other scenarios are named:
Neue Kernkraftwerke, Massiver Solarausbau, Solar- und Windausbau, Erneuerbar A – Mischszenario,
Erneuerbar B – Mischszenario, and Lastverschiebung. We will compare the scenarios (i.e., the input
parameterizations) corresponding to the BFE study and Neue Kernkraftwerke.
Modelling Framework
The electricity system model is a simulation model and focused on supply. The model is a dispatch
planning model; capacity expansion planning is not considered inside the model. The model has a
time horizon of one year with minutely time steps. The supply-side of the model consists of the differ-
ent generation technologies and the possibility of import/export; Wind and PV power production are a
function of weather, which is modelled geographically different and time-dependent. The model con-
siders hydro pumped-storage plants as well as short-term storage options in form of decentralized
batteries. The electricity demand is split into a flexible and an inflexible part to model demand side
10 of 48management. An aggregated grid is represented by four different grid levels (together with an option
for a direct at-production-site consumption). The different production technologies and demands feed-
in and feed-out at the different grid levels, respectively. Hence, a simplified impact on the grid of de-
centralized production is captured [40] (p. 23); explicit grid expansion costs are not evaluated. To ac-
count for the different hydrological and weather data from year to year, the model-runs are simply
repeated with different data [40] (p. 30).
In the current modelling approach, the dispatch decisions for the different types of power plants and
for storage are exogenously given; more precisely, the functional form of the dispatch control, which
has as argument the state of the system, is fixed [40] (p. 13). In the case when production exceeds
the demand, the dispatch is according to the following scheduling order: (i) store surplus in batteries,
(ii) pump remaining surplus into-hydro reservoirs, and –finally-- (iii) export residual surplus. In the case
when an unexpected intraday solar variation occurs, then the imbalance is buffered in the flexible part
of the demand. The merit order of production is fixed by a “Prioritätenliste” [40] (p. 11) as follows:
(i) inflexible production, (ii) PV and wind power, (iii) batteries, (iv) pumped-storage hydropower,
(v) CCGT plants, and (vi) hydro-storage plants. The import and export is determined by a trading
strategy that is determined based on results after a simulation run. The strategy is then iteratively
improved by new runs [40] (p. 130). The production costs are also calculated after the simulation run
(i.e. are not part of the dispatch decision).
2.8 PSI-sys (PSI energy system model)
This study is a PhD-thesis from the ETH Zurich of year 2013 and was supervised at the Paul Scherrer
Institute (PSI); the thesis encompasses 146 pages [48]. The scope is the entire energy system of
Switzerland. The study considers 8 major scenario storylines; in addition, the study also includes
4 scenarios with 2012/2013-updates of energy demand assumptions, which are related to the new
BFE estimates.
General Assumptions
The growth of GDP from 2010 to 2050 is assumed to be 1% on average [48] (p. 106). Population
growth is approximately that of BfS’ scenario Mittel [8], that is, 9 million in 2050 [48] (p. 106). The as-
sumptions on the sectorial energy demands for the updated scenarios draw heavily from the BFE
study [33], and they are augmented by own analysis [48] (p. 105–114). For example, the residential
floor area per person is assumed to increase from 62m2 in 2010 to 74m2 in 2050 (cf. [33], p. 60), and
the total vehicle-kilometres of passenger cars in Switzerland increase by 26%, which correspond to
the scenarios WWB+POM of the BFE study [48] (p. 114) (cf. [33], p. 68). In all scenarios, yearly elec-
tricity imports and exports are balanced; imports of other energy carriers are generally unlimited. Geo-
thermal energy is not considered. The discount rate is 3%.
Scenario Assumptions
The study considers 8 major scenario storylines. We focus on the two additional scenarios with the
updated demand assumptions [48] (pp. 115).
In scenario noClimPol, there is no new climate policy in addition to today’s policy.
In scenario 50%, the CO2-emissions from the energy sector are limited in year 2050 to be 50% of
those in year 1990.
Modelling Framework
On the demand side, the useful-energy demands (energy services) of the end-use sectors are ob-
tained by a simulation model [48] (p. 107, p. 109). The time series of the sectorial demands are driven
by several factors, for example: population and GDP growth, floor area, number of appliances, heat-
ing reduction by climate change, efficiency of end-use technologies, and assumed behavioural
changes.
The supply-side model, called SMM (Swiss MARKAL Model), is developed by the Paul Scherrer
Institute. It is an energy-system model from the family of MARKAL models, which are technology de-
tailed, bottom-up models. The model is a capacity planning models of the energy system which de-
termines the cost-optimal mix of technologies. Hence, SMM is mainly a supply-side model with some
demand-side aspects (see below). The model considers the entire Swiss energy system, including the
network consisting of energy imports, energy conversions, and different end-use demand sectors. The
11 of 48SMM identifies the least-cost combination of fuels and technologies to satisfy energy service de-
mands in Switzerland. It is used for deterministic scenario evaluations (perfect foresight).
As an example of the technology detail of SMM in the end-use sectors, the service sector is split into
cooling, cooking, space heating, hot water, lighting, office, and refrigeration; each subsector can be
satisfied by different end-use technologies. The time horizon is year 2050 with 5 year time steps. The
period of each time step is divided into different typical profiles having different demand and supply
assumption (time slice). Each time slice corresponds to a season (winter, summer, intermediate) and
is either peak or off-peak. Hence, the model has 6 time slices.
The final energy (demand) consumptions are determined by the optimization model itself, while the
energy service demands, for example, the amount of kinetic energy or the heated floor area, are giv-
en as input to the model. Nevertheless, insulation is modelled also as an end-use technology to allow
heat reductions by more insulation. Because the entire energy system is modelled, optimal system-
wide effects can be quantified, for example energy substitutions between the electricity sector and the
different heating sectors. The system-wide energy model has some simplifications: For example, hy-
dropower is modelled as an aggregated single technology.
Complementary to the thesis [48], an analysis of the Swiss energy system is provided also in [47]; in
that scenario analysis, the electricity sector is modelled by the more detailed model of the PSI-elc
study (Sect. 2.9).
2.9 PSI-elc (PSI electricity model)
A summary of results of the study is published by the Paul Scherrer Institute (PSI) on November 2012
in form of PSI’s periodical Energie-Spiegel No. 21, which is a 6-page leaflet [36]; the full study is a
122-page report [28], and more data assumptions are in [27]. The scope is the electricity system in
Switzerland (and not the entire energy system). Nine different scenarios are considered.
General Assumptions
Common assumptions across the scenarios are the technology costs over time, and the potentials of
renewable generation technologies. Across the scenarios, the cost-optimization methodology is used
to determine the supply mixes. The discount rate is 2.5%.
Scenario Assumptions
The study reports results for three demand variants and three supply variants, which are combined
to 9 scenarios. The three demand variants have the electricity demands of the scenarios WWB, NEP,
and POM of the BFE study [33]. The assumed CO2-prices are also according to these scenarios.
The supply variant Gas is a nuclear phase-out scenario. New, centrally installed gas plants, as well
as gas-fired CHP plants can be deployed (gas plants having 550 MW unit size). Annual net-imports
are constrained (approximately) to be zero.
The supply variant Import is also a nuclear phase-out scenario, but new gas and new CHP plants
are not allowed. In demand variant POM, maximally 1/5th of yearly demand is allowed to be satisfied
rd
by imports [36] (p. 3); in variant WWB, imports are maximally 1/3 of demand.
In the supply variant Nuclear, new nuclear plants are allowed to be build (1 GW unit size).
Modelling Framework
The used model, called STEM-E (Swiss TIMES Electricity model), is developed by PSI. It is an ener-
gy-system model from the family of TIMES energy-system models. TIMES models are technology
detailed, bottom-up cost-optimization models. The time horizon is year 2100. The model allows ca-
pacity planning as well as (simplified) hourly dispatch optimization; the optimization identifies the
least-cost combination of fuels and technologies to satisfy electricity demands. The model is a deter-
ministic model (Indeed, the perfect-foresight planning assumption is used in all models of the other
studies except of the VSE study, which applies some simple form of robustness analysis). For capaci-
ty expansion, the time step is 5 years until 2025, and then 11, 14, and 15 years. At each time step, the
yearly interval is divided into different demand and supply profiles, which are called time slices (typical
days with hourly profiles). Each profile is a combination of a season (winter, spring, summer, fall), day
(workdays, Saturday, Sunday), and hours; hence, the model has 4*3*24=288 time slices.
12 of 48The cost parameters of technologies encompass the investment costs, fixed and variable operation &
maintenance costs; those costs can vary over time. The CHP plants receive a cost-credit for heat
production. CO2-costs from domestic production are included in the cost-optimization [28] (p. 12).
Some detailed characteristics of technologies are included, for example, the model considers the
storage and pumping in hydropower, and individual wind and solar generation per time slice. Electrici-
ty imports are also limited by an (aggregated) interconnector capacity.
More details on input data, including the used weather and hourly demand variation, is published in
[27]. As an example, the wind data is from the year 2011 from the Jurassic mountains. The model is
currently extended into two directions. The first is to extend the model into a multi-regional model to
allow realistic trading with the surrounding countries. The second extension is widening the model into
an energy-system model for Switzerland, similarly to the approach of the PSI-sys study (Sect. 2.8),
but having more time slices than six.
2.10 List of Models and Scenarios
In the previous section, a synopsis of the studies and their scenarios was presented. To provide an
overview, the modelling approaches are summarized in Table 3, and the scenarios are listed in Ta-
ble 4.
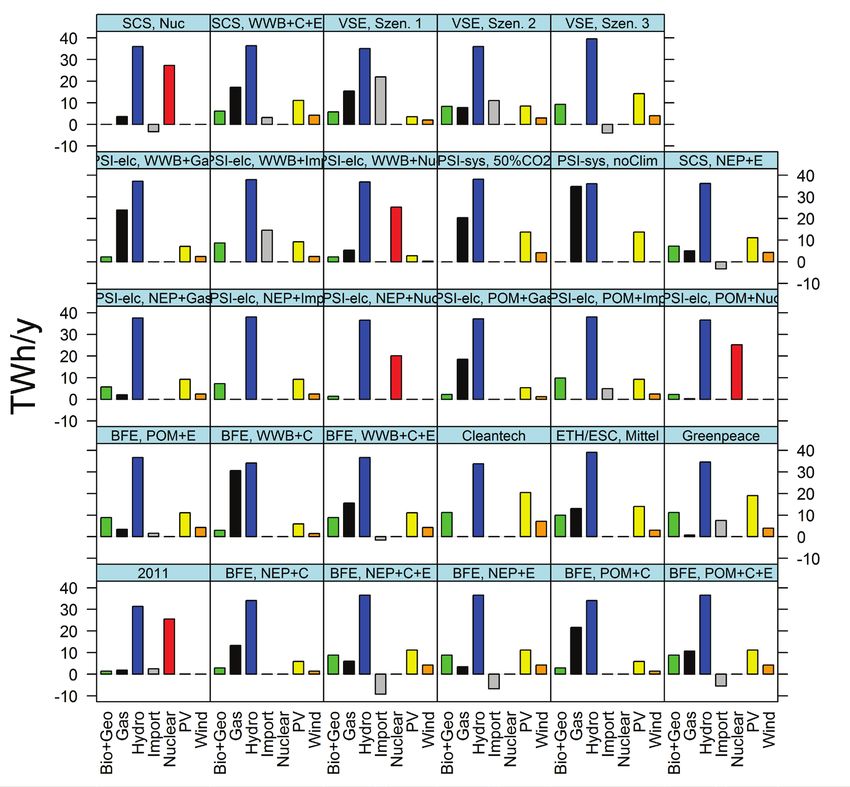
As indicated in Table 4, most of the scenarios are included in the comparison in the following sections;
excluded are some of the various scenarios of the SCS study, which are primarily re-parametrizations
of the model input, and BFE’s scenario variant D with the larger deployment of CHP plants. We ex-
cluded this BFE variant because (i) it was added later on to the BFE study in an appendix, (ii) all the
studies (apart from this scenario variant) do not model in detail the difference between a centralized
(large) and a decentralized (small) CHP plant, (iii) results specifically for CHP plants are only scarcely
reported separately in the studies (apart from results for generic fossil or biomass plants), and (iv) the
difference in terms of cost, of security of supply and of emissions between a CHP plant and the alter-
native of having a CCGT plant plus a heat pump (plus optionally a boiler to yield high water tempera-
tures) may be small; see the exhaustive discussion in the VSE study [46] (p. 58, p. 80).
Table 3: Summary of the modelling approaches of the studies
Study (elec- Demand Capacity Dispatch Modelling Speciality
tricity sector model (if no planning planning of energy
only) model: data model model system
from) network
BFE Simulation Simulation Simulation na
Cap./Disp. planning model also
VSE (elc) Simulation Optimization na
for neighbouring countries
A 3rd model is used for the
ETH/ESC Simulation Simulation na na whole economy (labour, capital,
energy)
SCS (elc) (from BFE) na Simulation na Model is only for year 2050
Electricity demand is endoge-
Greenpeace Simulation Simulation (from SCS) yes
nous
Cleantech Simulation Simulation na na no costs (not even ex-post)
Electricity demand is endoge-
PSI-sys Optimization na yes
nous
PSI-elc (from BFE) Optimization na «Typical hour» for dispatch
13 of 48Table 4: The scenarios of the studies (and indication whether they are compared in this review)
Study Scenario Description Compared
BFE WWB+C no increased energy policy; central CCGT Yes
WWB+C+E no increased energy policy; central CCGT, and increased Yes
renewable incentives / potentials
POM+C strong efficiency measures; central CCGT Yes
POM+C+E strong efficiency measures; central CCGT and increased Yes
renewable incentives / potentials
POM+E strong efficiency measures; imports and increased re- Yes
newable incentives / potentials
NEP+C strong CO2-target; central CCGT Yes
NEP+C+E strong CO2-target; central CCGT and increased renewa- Yes
ble incentives / potentials
NEP+E strong CO2-target; imports and increased renewable in- Yes
centives / potentials
X+C+E+D “X” is either WWB, POM, or NEP scenario; in addition: No
increased CHP incentives / potentials
VSE Szenario 1 high demand, low efficiency Yes
Szenario 2 medium demand, more efficiency Yes
Szenario 3 low demand, stringent efficiency, behavioural changes Yes
ETH / ESC Hoch high demand, high population Yes
Mittel medium demand, medium population Yes
Niedrig low demand, low population Yes
Greenpeace - strong move to renewables and energy alternatives (e.g. Yes
hydrogen production/storage)
Cleantech - market-oriented deployments; full-cost accounting (life- Yes
cycle, external and insurance costs)
SCS NEP+E parameterization from NEP+E Yes
WWB+C+E parameterization from WWB+C+E Yes
Neue Kernkraftwerke moderate demand; new nuclear plants Yes
other scenarios Scenarios: „Solarausbau“, „Solar- und Windausbau“, No
“Erneuerbare A“ und „B“, „Lastverschiebung“
PSI-sys noClimPol no additional climate policy; annual net-import is zero Yes
50% -50% CO2-emission of entire energy sector; annual net- Yes
import is zero
other scenarios scenarios with older demand assumptions No
PSI-elc X + Gas “X” means that demands and CO2-price are as in WWB, Yes
POM or NEP; central CCGT; annual net-import is zero
X + Import “X” means that demands and CO2-price are as in WWB, Yes
POM, or NEP; no central CCGT; annual net-import possi-
ble
X + Nuclear “X” means that demands and CO2-price are as in WWB, Yes
POM, or NEP; new nuclear plants possible; annual net-
import is zero
14 of 483 Electricity Demand
The historical growth of electricity demand in Switzerland is shown in Figure 1; for example, in abso-
lute numbers, the demand in the year 1970 was 25 TWh (after losses) and increased to 59 TWh in
year 2012. Historically, the electricity demand growth rate is comparable to that of GDP, whereas it
was higher than the population growth rate (Figure 1). Figure 1 shows also that demand seems to
decouple from GDP starting in year 2005 to today; but drawing conclusions based on this short-term
observation may not be valid.
Apart from the historical corre-
lation with the macro-economic
drivers of population and of
GDP, more electricity demand
is clearly needed by additional
end-use devices, for example
by more installations of heat
pumps and more personal elec-
tric mobility. Demand is re-
duced by higher efficiency; a
predominant example is elec-
tricity for heating, where re-
sistance heating can be substi-
tuted in principle by heat
pumps (heat-pump space heat-
ing, heat-pump washing ma-
chine); other areas for large
efficiency gains are illumination
(e.g. using LED) and applianc-
es (e.g., using zero stand-by Figure 1: Historical growth of GDP, electricity demand and of popu-
mode). The electricity demand lation in Switzerland. Demand: after losses, no heating-days cor-
for a device (of standard size) rection. Sources: BFE (energy), BFS (pop), SECO (GDP)
is simply the number of devices
in Switzerland multiplied by its inverse efficiency. The number and the kind of devices may be difficult
to predict in year 2050, that is, for a time span of 36 years; for example, the notion of a smartphone or
of a personal computer was not widely known 36 years ago. For each economic sector, the BFE study
[33] tries a detailed accounting to estimate the number/sizes of devices and their assumed future
energy consumption; the study VSE [46] considers also 23 economical subsectors with their efficiency
and growth potentials (see also Sect. 2.2 and 2.3). The other studies that have an explicit demand-
side model seem to apply a more generic approach with more aggregated assumptions on efficiency
gains.
Despite the fact that (in all studies that have a demand-side model) assumptions on the split of elec-
tricity consumption into the determining factors, which consist of efficiency, usage time, structural shift,
and of installation size, were made at least implicitly, the quantitative split into those factors for each
economic subsector are not reported in most studies. Hence, a proper assessment of the feasibility of
the demand for Switzerland is difficult. An exception is the BFE study that tries to report the decompo-
sition in more detail (see below); consequently, the studies that build on those assumptions can bene-
fit, for example the PSI-sys study. In summary, the electricity demand scenarios are shown in Fig-
ure 2.
Scenarios that have relatively low demands are BFE’s NEP and POM scenario, VSE’s Scenario 3 and
Greenpeace (Figure 2). To yield the very low demands of BFE’s NEP and of VSE’s Scenario 3, ag-
gressive efficiency measures are not enough; these scenarios explicitly assume behavioural changes
in society for energy use (cf. Sect. 2.2, Sect. 2.3). In these low demand scenarios, demand is usually
assumed to be declining already in the coming years. An exception is VSE’s Scenario 3, which as-
sumes more inertia in the energy system; in fact, in all VSE scenarios, the demand (and the genera-
tion mix) is assumed not to change drastically before the year 2035 [46] (p. 98).
A special case is the electricity demand of the PSI-sys study [48]: The demand is determined endoge-
nously by the cost-optimal solution of the whole energy system. The result is that even in the stringent
climate policy scenario of 50% CO2-reduction, more electricity is needed (see Figure 2) to increase
efficiency in the energy system and to substitute combusted oil products by the less CO2-intensive
15 of 48You can also read


