Liberalisation of the Danish power sector 1995-2020 - An international perspective on lessons learned
←
→
Page content transcription
If your browser does not render page correctly, please read the page content below
Liberalisation
of the Danish
power sector
 1995-2020

             An international
              perspective on
             lessons learned

   September 2020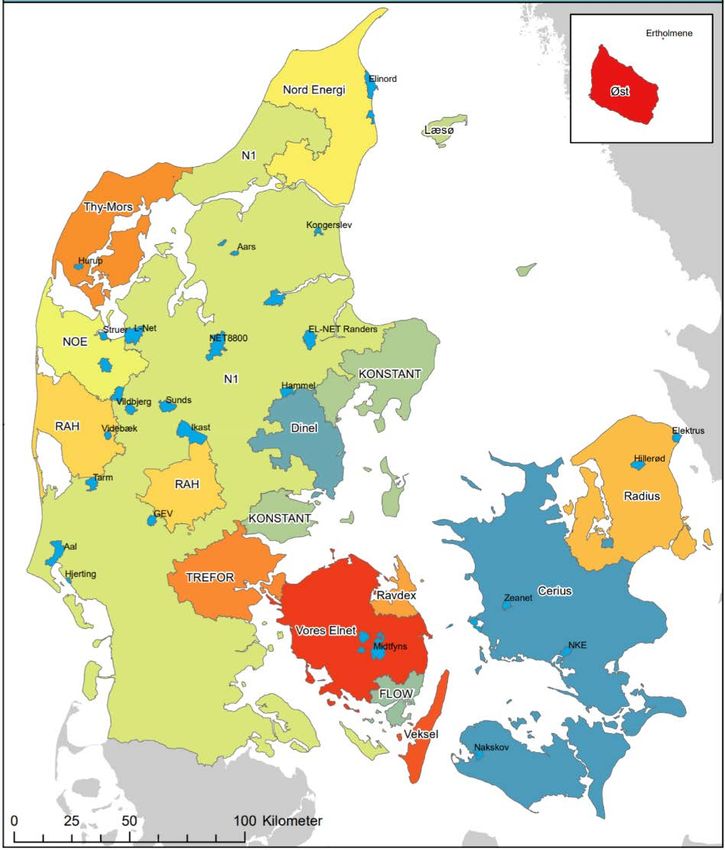
Copyright
Unless otherwise indicated, material in this publication may be used freely, shared or reprinted,
but acknowledgement is requested. This publication should be cited as: Danish Energy Agency
(2020): Liberalisation of the Danish power sector, 1995-2020. An international perspective on
lessons learned.

Contacts
Loui Algren, Danish Energy Agency, loa@ens.dk

Andrea Isidori, Danish Energy Agency, ani@ens.dk

Alex Newcombe, Danish Energy Agency, alcn@ens.dk

Mattia Baldini, Danish Energy Agency, mbal@ens.dk

Mikael Togeby, Ea Energy Analyses, mt@eaea.dk

Acknowledgements
A number of key experts have assisted in developing this report. Thanks to Hans-Henrik Clod-
Svensson, formerly director of operation Elkraft, Flemming G. Nielsen, formerly Danish Energy
Agency now Copenhagen University, Sigurd Lauge Pedersen, Danish Energy Agency, Knud
Pedersen, formerly Danish Energy Agency, now Radius, Jette Miller, The Free Energy Compa-
nies (De Frie Energiselskaber), Kristine Bak, formerly Danish Energy Agency, Jørgen Nielsen,
formerly Vattenfall, now TVIS (district heating transmission company), Henning Parbo, Peter
Jørgensen, Anette Ikast, all Energinet, Mads Lyndrup, Frederik Roose Øvlisen og Thorbjørn
Nejsum, Danish Utility Regulator and Kaare Sandholt, formerly Elkraft System, now China Na-
tional Renewable Energy Centre.

                                                                                                    2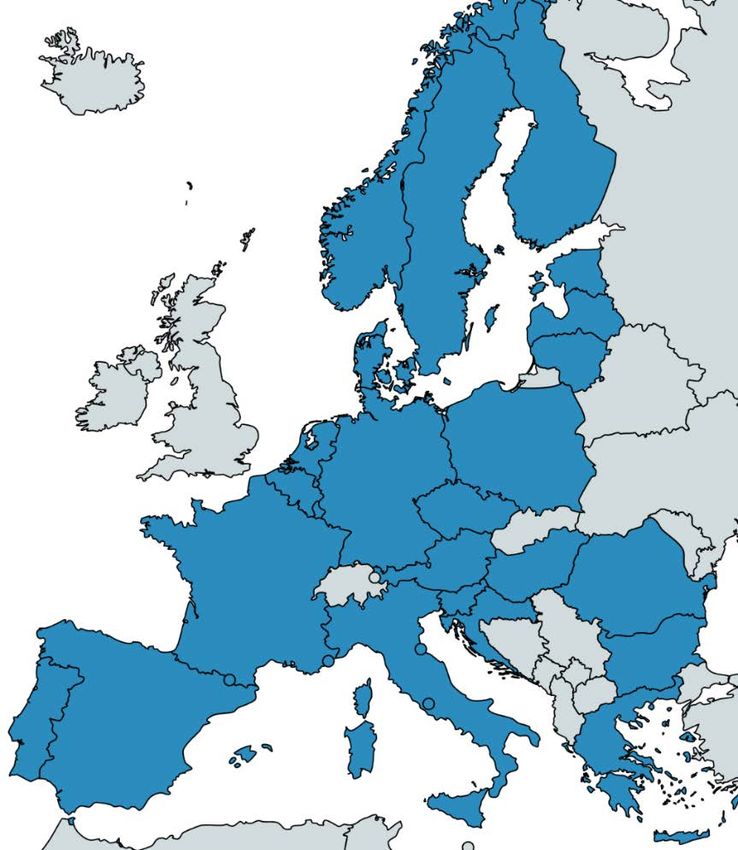
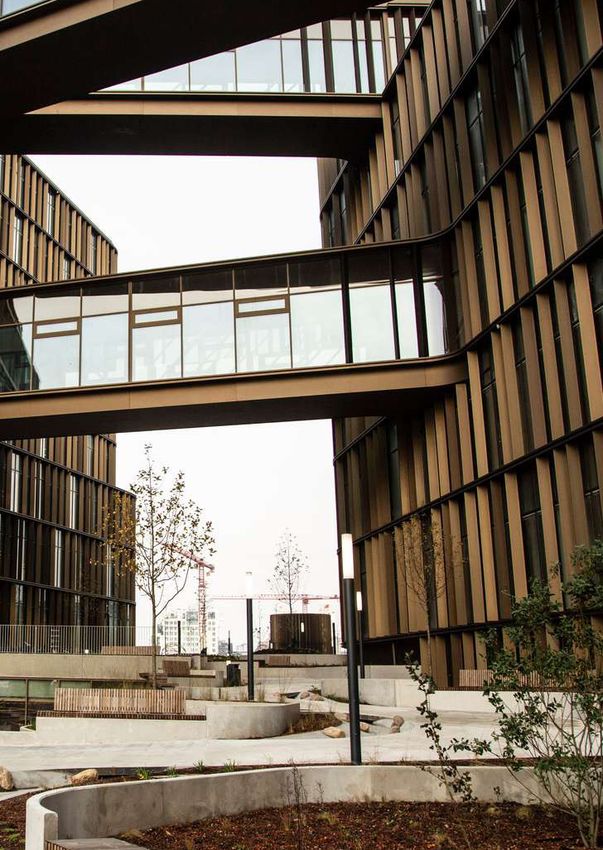
Foreword
The liberalisation of the Danish power sector, along with the unbundling of long-established ver-
tical integrated utilities, is one of the steps that led Denmark to be the forefront of renewable
energy. Today, Denmark is the country with the world´s highest share of variable renewable en-
ergy in electricity production (50% in 2019) and has been for many years. Wind and solar power,
in combination with flexible thermal power plants and international transmission networks, supply
the Danish electricity demand, providing low electricity prices and contributing to a world class
security of supply.

Building on these years of experience, the Danish Energy Agency has the mission of assisting
countries around the world in following the same path and decarbonise the power system in a
secure and affordable way.

These achievements could not have happened without a structural transformation of the electricity
sector, including the unbundling of generation from the natural monopolies of transmission and
distribution services. The liberalization of the Danish power sector, including equal access to the
grid for all generators, has created a healthy competition among the stakeholders, which has
served as a foundation for the development of the renewable energy industry in Denmark with
continuously decreasing costs of renewable technologies.

The Danish example can inspire the many countries around the world, which are considering or
commencing liberalisation of the electricity sector. Liberalisation and unbundling processes can
lead to many positive aspects, such as easing the integration of renewables, attracting foreign
financing and bringing down costs. Yet, the processes can be challenging, as they require funda-
mental changes and restructuring of the institutions, roles and responsibilities in the electricity
sector. The Danish experience shows that a consensus on the transformation of the electricity
sector has been challenging to reach, as the process is very complex and there is rarely a single
clear solution, as different institutions can bear different opinions on specific aspects of the pro-
cess.

This report highlights the key learning from the Danish liberalisation process, illustrating both the
positive outcomes and the challenges faced during and after the process. We hope it will spark
inspiration and provide guidance for our partners in the process, which led Denmark to sit
amongst the world´s leaders in the integration of renewables.

Kristoffer Böttzauw, Director General of the Danish Energy Agency

                                                                                                   3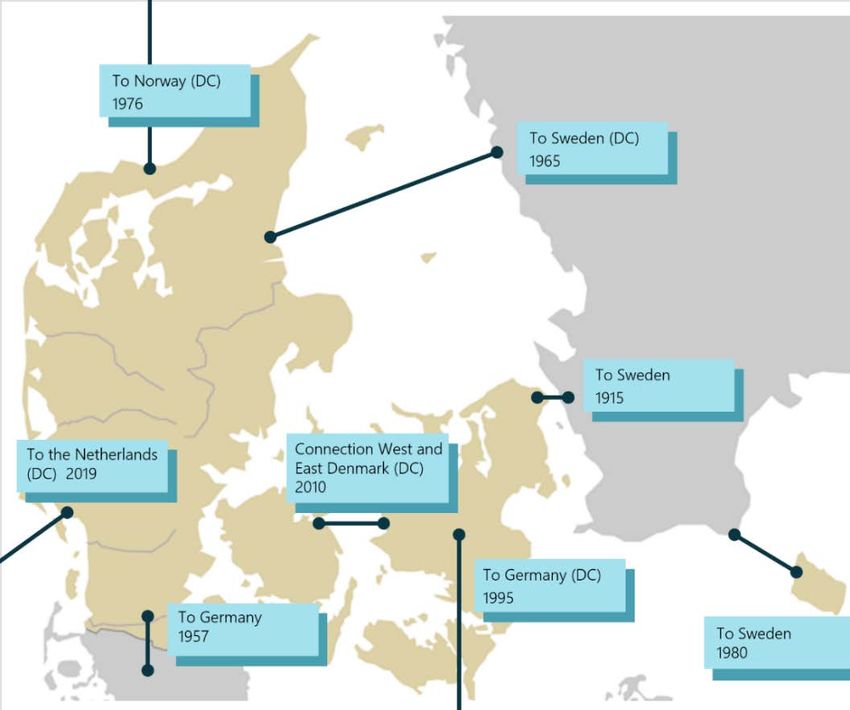
Table of Contents
Foreword ....................................................................................................................................... 3

Table of Contents .......................................................................................................................... 4

Abbreviations ................................................................................................................................. 6

Executive summary ....................................................................................................................... 7

       Summary of today’s electricity market ................................................................................... 7

       Key learnings from the liberalisation process, 1995-2020 ..................................................... 9

1.     Liberalisation process .......................................................................................................... 11

     1.1.      Starting point is 1995 ................................................................................................... 15

     1.2.      1995-1998: Third party access and unbundling .......................................................... 17

     1.3.      1999: Electricity sector reform and capital to generator companies ........................... 18

     1.4.      2000-2005: Separate arrangement for “prioritised” electricity ..................................... 21

     1.5.      2004: New ownership, TSO merger and new DSO regulation ................................... 21

     1.6.      2005-2010: Small CHP on the market and negative prices ........................................ 23

     1.7.      2010-2015: West and East Denmark interconnected and international coordination . 24

     1.8.      2014: Electricity Regulation Committee ...................................................................... 26

     1.9.      2016-2020: One bill, smart meters and tariffs ............................................................. 28

     1.10.     Current market and regulation ..................................................................................... 30

2.     Selected focus points ........................................................................................................... 34

     2.1.      Status 2020: Successful wholesale market ................................................................. 34

     2.2.      Slower transition in retail market ................................................................................. 37

     2.3.      Successful unbundling in production and transmission .............................................. 40

     2.4.      Outstanding issues for DSOs ...................................................................................... 40

     2.5.      Transfer of power plants to a market-based system ................................................... 41

     2.6.      Security of supply ........................................................................................................ 43

     2.7.      Integration of wind and solar power ............................................................................ 45

3.     Lessons learned ................................................................................................................... 47

     3.1.      Change of culture and vision ....................................................................................... 47

     3.2.      Political consensus ...................................................................................................... 48

     3.3.      Transitional arrangements ........................................................................................... 49

                                                                                                                                                4
3.4.       Thorough unbundling (TSO) ........................................................................................ 49

   3.5.       Strong Regulator ......................................................................................................... 50

   3.6.       Utilise new digital technologies ................................................................................... 51

   3.7.       New regulation for the green transition ....................................................................... 52

References .................................................................................................................................. 53

Appendix 1: Power companies .................................................................................................... 56

      DONG/Ørsted ....................................................................................................................... 56

      Vattenfall – Denmark ............................................................................................................ 58

Appendix 2: ENTSO-E system adequacy activities .................................................................... 59

      Short term adequacy outlook ............................................................................................... 59

      Medium term adequacy ........................................................................................................ 62

      References ........................................................................................................................... 63

                                                                                                                                              5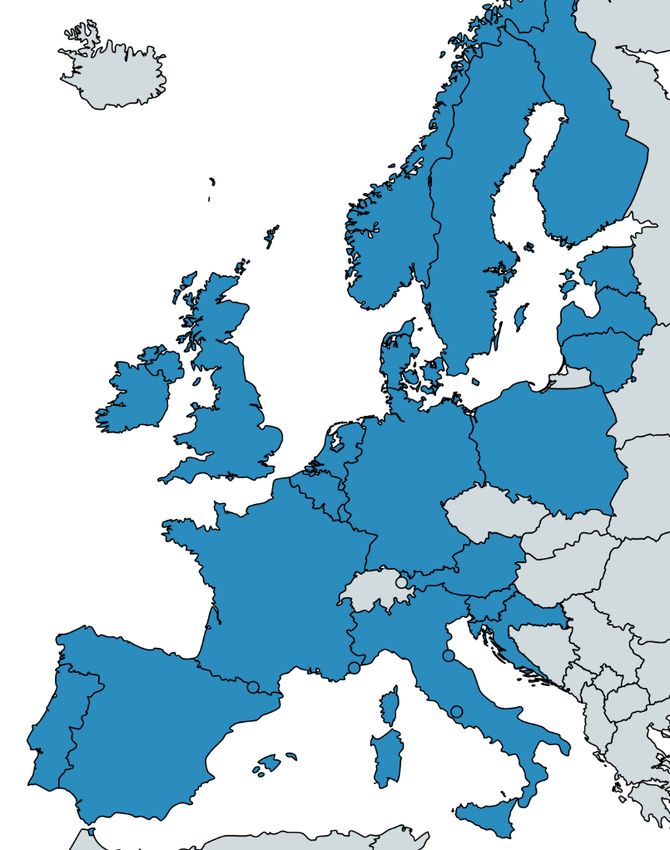
Abbreviations
ACER      Agency for Cooperation between Energy Regulators

CHP       Combined heat and power

DEF       Danske Elværkers Forening (Today Danish Energy)

DSO       Distribution System Operator

ENTSO-E   European Network of Transmission System Operators for Electricity

EPAD      Electricity Price Area Differentials

EU        European Union

PSO       Public Service Obligation

REMIT     Regulation on wholesale energy market integrity and transparency

SIDC      Single intraday coupling

ToU       Time-of-use

TPA       Third Party Access

TSO       Transmission System Operator

UMM       Urgent Market Messages

                                                                              6
Executive summary
”… Establishment of the internal market in electricity is particularly important in order to increase
efficiency in the production, transmission and distribution…” (EU, 1996)

“The purpose of the liberalisation was to create better conditions for competition, and thus to im-
prove utilisation of production resources as well as to provide gains from improved efficiency in
the operation of networks.” (NordReg, 2006)

Liberalisation of the electricity sector in Denmark was motivated by two parallel movements: the
development of the electricity market in Norway and Sweden, and the EU’s focus on the Euro-
pean internal market, where electricity was also seen as a commodity that should be traded
freely across borders. I.e. the purpose of the EU’s internal market is the free movement of
goods, persons, services and capital.

Today’s wholesale electricity markets – with the day-ahead market as the key market – is very
dynamic, liquid and has a high degree of competition. The efficient integration of 50% wind and
solar generation in Denmark is to a high degree dependent on the dynamic properties of the
wholesale market.

The retail market has developed more slowly, with related important infrastructure such as
smart meters, soon to be in place. Benefits of liberalisation have been less clear in the retail
market.

Security of electricity supply has been very high in Denmark. Liberalisation was introduced dur-
ing a period with excess electricity generation capacity in Denmark. This was linked to a previ-
ous policy of being self-sufficient, as well as favourable financing rules for investments during
monopoly times. Today, total dispatchable generation capacity (i.e. excluding wind and solar
power) is less than peak demand. As a result, during periods with little wind and solar genera-
tion, security of supply is now dependent on electricity import.

While liberalisation has been achieved in many aspects of the power sector, some areas still re-
quire attention. These include regulation of monopolies (DSOs and TSO), development of signif-
icant amounts of demand response, and opening reserve and ancillary service markets for com-
petition across EU borders and technologies. See Figure 1.

Summary of today’s electricity market
Today, all Danish consumers can choose their electricity supplier as well as select between dif-
ferent types of contracts, e.g. a fixed electricity price for a period of time, a variable price, or var-
ious combinations thereof. There are currently 38 suppliers, which in total have 295 contracts to
choose from. It is straightforward to change a supplier or type of contract, both of which can be
undertaken online. 43% of electricity is currently sold on contracts with a variable price linked to

                                                                                                       7
hourly wholesale market prices, while the remaining portion has a fixed price for a period of
three months or more. 1

An electricity supplier is the main interface to the consumer. All suppliers and generators are as-
sociated with a balance responsible party. The balance responsible party delivers plans to the
TSO for generation, demand and trade. Both suppliers and balance responsible parties are
commercial companies, and both can buy and sell electricity on the power exchange (day-
ahead and intra-day). Electricity suppliers and generators can reduce price uncertainty by enter-
ing financial contracts involving future electricity prices.

Figure 1. Overview of the Danish liberalisation process

DSOs are responsible for the distribution grid and for metering electricity demand (done via re-
mote metering) and sending this data to the Datahub. Electricity suppliers, balance responsible
entities and the TSO can extract relevant data from the Datahub.

See Figure 2 for a simplified representation of the key market participants.

1
    Forsyningstilsynet, 2019.

                                                                                                   8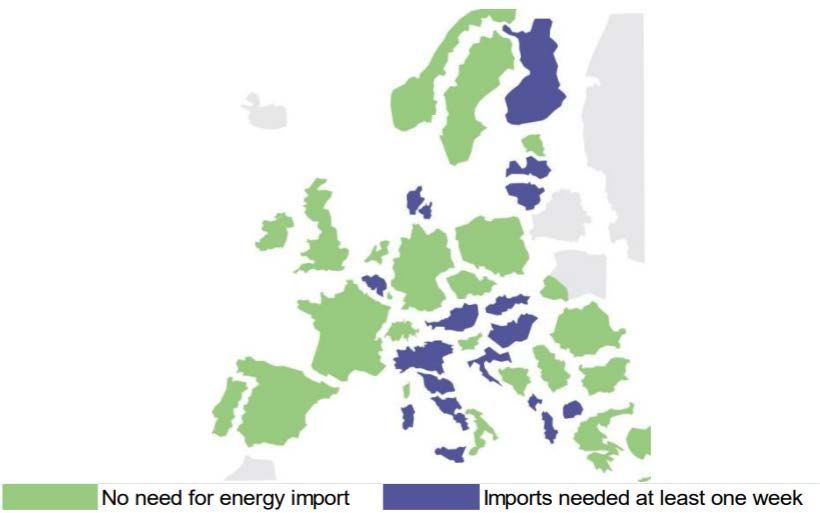
Figure 2. Key participants in today’s electricity system. The consumer has limited contact with the DSO.
The DSO is responsible for grid and meters.

Key learnings from the liberalisation process, 1995-2020
Chapter 1 of the current report details the liberalisation process of the Danish electricity sector,
while Chapter 2 presents selected learnings from this process. Key aspects include:

      • The 1999 establishment of a neutral TSO with ownership of the transmission system
         and the task of designing market rules was an important milestone. A key aspect here
         was the separation of generator companies and the TSO.
      • An agreement, also reached in 1999, that prepared electricity generators for the new
         commercial world. As part of the agreement, capital was transferred to the generators.
         This was a political process that was deemed necessary to ensure a good start under
         the new regulatory regime.
      • Competition from neighbouring countries, which has been critical for a well-functioning
         day-ahead market. This competition has been aided by the investment in several new
         cross-border transmission lines.
      • Many additional steps taken to further develop the market, such as:
               o Making revenue from the market the main income for distributed generation (i.e.
                  natural gas-based CHP units),
               o Transitioning from subsidy systems for wind power centred on fixed feed-in-tar-
                  iffs to a system based on market prices plus a premium premium awarded
                  through tendering mechanisms,
               o Allowing negative prices in the day-ahead market,
               o Coordination of 23 countries’ day-ahead markets, making electricity a true com-
                  modity in the EU internal market, and an

                                                                                                           9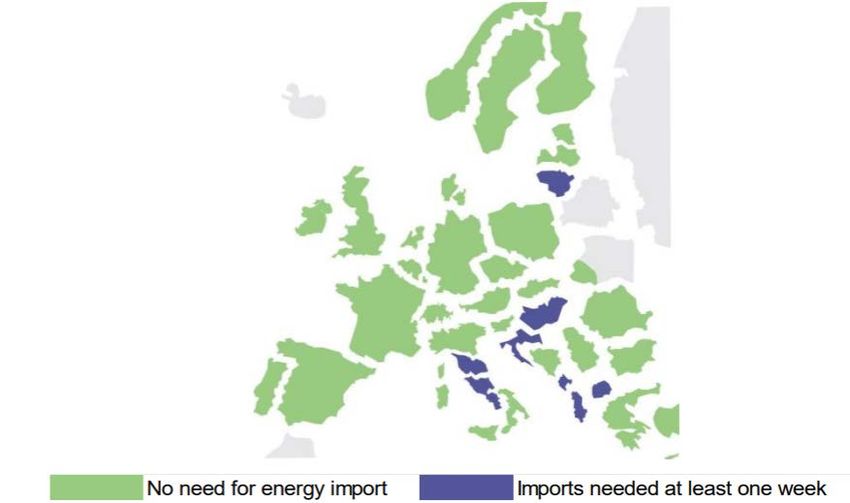
o   Full integration of the European intra-day markets and an ongoing harmoniza-
          tion of the markets for ancillary services is broadening the areas of cross-border
          competition.
• Investment in modern electricity meters with hourly measurements for all consumers.
  The process will be completed by the end of 2020.
• Regulation of the monopolies (mainly DSOs). This has been complicated and has
  changed several times.
• Consumers having a relatively passive role in the process. Household consumers have
  shown little interest in understanding the new possibilities and changing contract type or
  supplier. For nearly all consumers, demand response is still in a very early stage of de-
  velopment, but hourly settlement may create more interest.

                                                                                         10
1. Liberalisation process
In Europe, the idea of a market for electricity started in the UK during Margaret Thatcher’s ten-
ure in the 1980s. In Norway, economists had some of the same ideas to de-incentivise over-in-
vestment in local hydropower. In the EU, the EU Commission wanted to expand the union from
predominantly trade to other areas in order to further integration and economic prosperity.
These trends started the outward push for liberalisation in Denmark, and to this day EU regula-
tion to further integrate the European energy markets has been the dominant driver in Denmark.
Introducing competition in the power sector can be a way to increase the efficiency 2 of the sec-
tor as well as allowing access to private capital. Some key features of an ideal liberalised power
sector are:
• Unbundling, as this ensures that the transmission grid supports competition to the largest
extent possible. Owners of generator capacity must not be able to limit competition by
controlling the use of the transmission grid.
• Hourly dispatch according to marginal costs for all generation technologies.
• Competition, as this ensures an adequate generator fleet in terms of dispatchable capac-
ity, ability to deliver ancillary services, and compliance with environmental and climate
goals.
While these aspects are easy to understand, the process of implementing them can be com-
plex. Going from vertically integrated companies (generation, distribution, sales) to an unbun-
dled setup with commercial units (generation and sales) and regulated monopolies (transmis-
sion and distribution) can have winners and losers – and may require difficult compromises.
Strong interests may work against the changes.
In Denmark, the liberalisation process started in 1996 and development of regulation is still on-
going. In recent years, regulation of monopolies (DSOs and TSO) and developing the retail mar-
ket have been in focus.
During the beginning of the liberalisation, Denmark experienced low growth in electricity de-
mand (in the order of 1% p.a.) and over-capacity existed. The over-capacity was a result of fa-
vourable regulation of the generators (companies could collect 75% of investment costs from
consumers in advance), but also due to a policy with a clear national focus: Denmark should be
able to supply its peak electricity demand on its own.
Table 1 illustrates the key roles and, those responsible, before and after the liberalisation.
2
By “efficiency” we mean that the service is delivered at low costs, this include all parts of the power sector, including
choice of technology, number of staff etc.
11Electricity sector Pre 1996 Now 2020
Structure Price-regulation Structure Price-regulation
Production Local mo- Non-profit Commercial General antitrust regu-
nopoly Only necessary costs lation
Vertically in- included in prices EU regulation: REMIT
Transmission tegrated Monitored by Regula- Monopoly Non-profit.
tor Only necessary costs.
Distribution Monopoly Cost-caps
monitored by Regulator
Suppliers - - Commercial General antitrust regu-
lation
EU regulation: REMIT
Table 1. Overview of the Danish electricity sector – before and after liberalisation.
Step by step
Before the liberalisation process began in the 1990s, the Danish electricity sector was com-
prised of local monopoly companies. From 1977, these companies were regulated by the Elec-
tricity Act, which stipulated that the sector should be operated on a non-profit basis (only neces-
sary costs could be included in consumer prices). Prices and tariffs were monitored by a public
regulator. New transmission and production capacity could only be established with approval
from authorities, and companies could collect 75% of investment costs from consumers in ad-
vance.
For the generator companies during the monopoly times, priority was placed on security of sup-
ply, and for each company to supply “their” area and “their” consumers. Power exchange with
neighbouring areas/countries took place when there were mutual benefits, and this benefit was
shared between the two parties via mutual agreement.
Transition to a liberalised market-based system was/is a fundamental change, upending all the
well-known structures, as well as thinking and culture in the sector. Hence, it has been a decad-
es long, step by step, process with a number of milestones underway (see textbox below).
12Milestones in regulation of the electricity sector
1991: First proposal for EU Directive for the internal electricity market.
1993: Revised proposal for EU Directive for the internal electricity market.
1996: EU Directive for the internal electricity market is adopted: Gradual market opening (3 phases)
starting with consumers over 100 GWh/year
Market access for consumers over 100 GWh/year implemented in Danish law.
1999: Comprehensive law reform for the Danish electricity sector: New basic structure and regulation
of companies. Transmission and distribution of electricity will continue to be natural monopolies sepa-
rated from the new market-based activities (production, trade). Market access for consumers over 1
GWh/year by the end of 2000 and for all consumers by the end of 2002. Establishment of a new regu-
lator.
Political agreement on economy of power companies. Due to relatively low electricity prices it was con-
sidered necessary to bolster power producers financially when transitioning from a non-profit to market-
based system. In return, the power companies in East (Elkraft) and West Denmark (Elsam) agreed to
merge.
2000/01: Implementation of opening balances and revenue caps for transmission companies (2000)
and distribution companies (2001).
2003: New EU Directive for the internal electricity market. The directive establishes common rules for
production, transmission and distribution of electricity, rules on how the electricity sector should be or-
ganised and function, and on market access. It establishes criteria and procedures for procurement, for
licensing and for operating networks.
2004: Comprehensive Danish electricity law reform package based on a broad political agreement. It
implemented the new EU Directive and, importantly, allowed companies to dispose of equity that until
then had been tied up in the companies. In return, the companies transferred ownership of transmis-
sion networks and the TSO to the state. A new state-owned national TSO for electricity and gas (Ener-
ginet.dk) was established. The new regulation started a wave of sales and mergers that fundamentally
changed the ownership structure of the Danish energy sector.
2007: The EU Commission presents the 3rd Liberalisation Package - with proposals to improve condi-
tions for access to the grid in connection with cross-border electricity trade, separation of ownership of
production, transmission and trade-activities, as well as proposals for a new regulation establishing a
European Agency for Cooperation between Energy Regulators (ACER).
2010: Energinet is tasked to establish a Datahub - a central register from which market players can ob-
tain all relevant measurement data for billing purposes and to handle supplier changes.
2011: EU Regulation on wholesale energy market integrity and transparency (REMIT). This strength-
ens the role of regulators in order to prevent abuse and promote open and fair competition in the
wholesale energy markets, and to ensure consumer confidence in the integrity of the electricity and gas
markets. This is implemented into Danish law in 2013.
2014: Following recommendations from an external Electricity Regulation Committee “supplier of last
resort” (forsyningspligt) is abolished and replaced by a supply obligation, which obliges all electricity
trading companies to supply electricity to all household consumers for a fee.
2019: The regulator publishes a study about transparency and neutrality of DSOs.
13Denmark’s trade with its neighbours has been continuously increasing over the last decades
(see Figure 4 below). Transmission capacity between countries and market areas has increased
significantly during the period, while large annual variations have been motivated by wet and dry
years in hydropower-dominated Norway and Sweden. Also, before liberalisation, regional trade
between countries was largely based on bilateral trade between utilities.
30
25
20
TWh
15
10
5
0
1976
1978
1980
1982
1984
1986
1988
1990
1992
1994
1996
1998
2000
2002
2004
2006
2008
2010
2012
2014
2016
2018
Figure 3: Indicator for trade. Sum of all import and export. Source: Data from 1976- 2000 from: (Jakobsen,
2007). Data from 2001-2019 from Energinet
Unbundling
In a vertically integrated setup, one company generates, transmits, distributes, and sells elec-
tricity to a specific area. This can be part of a centrally planned system where rules are in
place to secure efficient operation. In such a system it may be challenging that the company
tends to prefer its own generation as opposed to import, or that new generation technology
may find it difficult to become connected to the system.
Like 3rd party access, “unbundling” is an important step in liberalising the power system.
Electricity transmission is separated from the generators, and it may also mean that distribu-
tion is separated from suppliers. The infrastructure (the grid) is therefore neutral and can be
used by any actor, such as new generation or generators from neighbouring countries.
In Denmark, the transmission grid is owned and operated by a state-owned Transmission
System Operator (TSO). In other countries (e.g. in the USA), the grid can be owned by pri-
vate companies, but the operation is controlled by an Independent System Operator (ISO).
Both setups secure open access to the grid, including competition across technologies, and
among local and foreign actors.
14Type of unbundling
Ownership unbundling Suppliers cannot be owned by a DSO or have ownership re-
lations to a DSO.
Legal and functional un- Separate companies, separate executive boards (board
bundling members can overlap)
Identity unbundling This was introduced in 2017. DSO and supplier must have
names and logos that cannot be confused
Example of identity unbundling (CEER, 2019):
Supplier (and incumbent Old DSO logo New DSO logo
company)
1.1. Starting point is 1995
The point of departure for this review is the state of the Danish electricity sector in 1995. Fea-
tures of the Danish system in 1995 included:
• Distribution companies were local monopolies and were either cooperatives owned by the
consumers or companies owned by municipalities. In 1995, there were more than 200
distribution companies (Copenhagen Economics, 2014). By 2019, this number was re-
duced to 43. Regulation has only created a moderate incentive for mergers.
• Distribution companies owned the generation companies, and these generators cooper-
ated in two regional companies to undertake the daily operation and planning: Elsam (in
West Denmark) and Elkraft (in East Denmark). This was a natural partition, as prior to
2010, West and East Denmark were not interconnected.
• Regulation had secured that the companies were well-consolidated. Generation compa-
nies could collect funds for future investments. The value of the electricity companies was
estimated to be between 15 and 20 billion USD, and their debt was roughly 1 billion USD
(Miljø og Energiministeriet, 1995).
Liberalisation of the Danish electricity sector has partly been motivated by developments in the
other Nordic countries. Major steps in the direction of open competition was taken by Norway in
1991, by Sweden in 1994, and by Finland in 1996.
15In 1995, the Energy Ministers from Denmark, Norway, Sweden and Finland 3 signed the Louisi-
ana declaration in Denmark indicating a future with free and open markets without borders. Co-
ordinated market development in the Nordic area was also considered a way to influence EU
regulation. Today, it can be concluded that EU regulation on day-ahead markets seems to be
highly inspired by the Nordic power exchange Nord Pool 4.
Nord Pool was established in 1996 by Norway and Sweden. Finland joined in 1998 and Den-
mark in 1999/2000. All transmission capacity between price zones is allocated to Nord Pool for
the day-ahead market. Bilateral trade can take place, but only within the same price area. 5 This
rule led to high liquidity in Nord Pool. Today, the day-ahead market is integrated across 23 EU
countries and the generation structure is much more complex with significant shares of wind
and solar powe. Operation of the current system would have been very challenging without the
international electricity market. In a large, interconnected system with a high number of variable
and only partly predictable generators an optimal dispatch can no longer be based on a phone
call or two 6.
Case: Trade between Sweden and Denmark East – before liberalisation
The Nordic cooperation, Nordel (cooperation of Nordic generators – which also owned trans-
mission), developed the rules for how power could be exchanged between countries. The
system was based on trust and each side should present their marginal costs for decreasing
or increasing their local generation.
In East Denmark, Elkraft supplied these prices based on a detailed model of the cost struc-
ture of the local thermal power plants. On the Swedish side, Vattenfall and Sydkraft supplied
marginal prices from their system. The Swedish system consisted of nuclear and hydro
(~50% of each) so the marginal price was dependent on the water values. The water value
indicates the minimum price where (the limited) water inflow should be used.
Trade took place continuously (hour by hour) when the two sides found it attractive. Nordel
rules were used to compute the price, which was the midway point between the marginal
prices of the two sides.
After Nord Pool was established in Sweden (in 1996), and until Nord Pool was opened in
East Denmark (2000), Elkraft traded as foreign trader on the Swedish market. The trade with
Sweden was quite dynamic (hour by hour) as in the liberalised system, however trade was
3
The Nordic Council of Energy Ministers
4
Peter Jørgensen, Energinet.
5
The Nordic day-ahead market is a zonal pricing system. See Danish Energy Agency (2020) for description of zonal
pricing and nodal pricing systems.
6
Peter Jørgensen, Energinet.
16limited to a few market actors. The trade was especially high in dry and wet years in the Nor-
wegian system.
The power exchange and the procedures dated back prior to the establishment of Elkraft in
1978. 7 Trade between West Denmark and Norway, Sweden and Germany were based on
similar principles.
1.2. 1995-1998: Third party access and unbundling
The first time the EU described liberalisation of the electricity sector was in the 1988 green pa-
per about the internal energy market. Key points introduced in this paper included:
• Open access to the transmission grids
• Removal of monopoly status for generator companies
• Unbundling into generation, transmission and distribution.
The green paper indicated that liberalisation could save up to 12% of total costs (Petersen &
Rüdinger, 2009).
In 1988, there was broad scepticism against liberalisation of the power sector. In many coun-
tries, as in Denmark, the scepticism existed until 1995/96. In a 1995 report from PA consulting,
initiated by Danish generator companies, unbundling was recommended, and this started a shift
away from the scepticism (Petersen & Rüdinger, 2009). The opportunity for a generator to sell
power across borders when the price was high was an incentive for generators to move from
bilateral contracts to selling via the market.
In 1995, a newly established trader, Dansk Kraftimport, asked for permission to import electricity
to East Denmark. At this time, Elkraft had the right to all import/export, and a long legal dispute
started. This process garnered political attention, and it was clear that the existing regulation
could not resolve the conflict.
During the 1990s, when most national electricity and natural gas markets were still monopo-
lised, the European Union and the Member States decided to open these markets gradually to
competition. The first liberalisation directives (First Energy Package) were adopted in 1996
(electricity) and 1998 (gas), to be transposed into Member States’ legal systems by 1998 (elec-
tricity) and 2000 (gas).
In 1996, the first law governing liberalisation of the electricity market was passed by the Danish
Parliament. This included a right to third party access to the grid and the idea of establishing a
7
Based on an interview with Hans-Henrik Clod-Svensson, who oversaw operation at Elkraft from 1978 to 2004.
17TSO. As mandated by the EU Liberalisation Directive, consumers with a demand above 100
GWh could now enter into electricity contracts with a supplier of their choice. However, at the
time only six Danish companies exceeded this threshold.
In 1997, the association of Danish power companies (DEF) published a report recommending
liberalisation and full competition. The report was a turning point for the power sector (Petersen
& Rüdinger, 2009). The general attitude in the power sector was now to go beyond the EU di-
rective and the Danish law - both from 1996. Generation companies saw the potential for less
government control in a market system.
1.3. 1999: Electricity sector reform and capital to generator
companies
In 1999, a broad political agreement was reached on a legislative reform of the electricity sector,
and later that year the agreement was implemented into law. The agreement aimed at a clear
separation between tasks relating to public obligations and commercial activities in the electric-
ity sector and built on the decentralised structure with municipal or consumer-owned electricity
companies. Two TSOs were established in West and East Denmark (Eltra and Elkraft System
respectively), which took over coordination, including dispatch and system planning, from the
generation companies.
The aim of the agreement was also to promote efficiency in the electricity sector through in-
creased competition and more efficient price regulation of the monopoly portions of the sector.
In order to do so, income cap regulation was introduced for the distribution companies. The
framework was established in such a fashion that the regulator determined the cap for each
company's revenue for each year, and this cap should reflect the company's efficiency potential.
As part of the agreement, more consumers could now choose their electricity supplier. I.e. in
2000 only consumers with an annual demand above 10 GWh could select their supplier, a figure
that was reduced to 1 GWh in 2001, and by 2003 all consumers were free to do so.
In 1999, an addition to the reform agreement made it possible to transfer capital from the TSOs
to the generation companies. The fundamental financial ambition for the TSOs was that TSO
costs should be financed by the transmission tariff paid by the consumers. But some additional
costs were imposed on the TSO to support the generation companies in the transition phase. In
principle, this could also have been funded by the state budget which would lead to the taxpay-
ers covering the costs instead of the electricity consumers. The taxpayers and the electricity
consumers are to a very large extent the same people and institutions although the bill is shared
differently in the two cases.
Under the reform agreement, the generation companies had to cover costs, including costs im-
posed on the companies during monopoly times. These costs included:
18• Stranded costs (take-or-pay gas purchase agreements, scrapping of old power plants,
pension liabilities),
• Fulfilment of supply obligations to district heating customers at reasonable prices. CHP
plants might have to produce (to meet heat demand) when it was not feasible in the
electricity market - without being able to raise heat prices
• Utilization of biomass and expansion with wind power since these technologies were
not competitive at the time but were required to be developed to fulfil the political goals.
During 1999 however, generation companies raised concerns that they would not be financially
able to meet these obligations without risking bankruptcy.
A group of experts from the generation sector, the Danish Energy Agency and the Ministries of
Economy and Finance was tasked with analysing the economy of the generator sector.
The experts ascertained that the power plants would start with a net debt of approx. €400 million
at the beginning of 2000. Since the power plants did not have savings or reserves to draw on, it
was crucial how revenues and expenses developed in the short run. Due to the low prices in the
electricity market at the time, there would be no significant profit margin at the power plants, as
the marginal cost of the plants was at the same level as the electricity sales price. If this contin-
ued for an extended period, the power plants would not be able to cover their fixed costs.
Thus - with the assumptions used – the generation sector would start with a negative earning
capacity, so that the net debt of approx. €400 million would grow initially - partly because of the
low electricity price and partly because of residual investment in plants under construction.
Around 2006, the net debt was estimated to be approx. €1.9 billion, after which the development
would reverse.
Based on the calculations of the group of experts, the Government and a majority of Parliament
agreed that the power plants would not be able to bear stranded costs and costs associated
with meeting environmental obligations without an enhanced earning ability to and a strength-
ened capital base.
Thus, it was agreed that generation plants should be compensated for extra costs for environ-
mentally friendly electricity generation and gas purchase agreements by:
• Existing RE plants owned by generation companies should be given green certificates
for their electricity generation.
• Existing RE and small-scale natural gas-fired CHP plants owned by generation compa-
nies would also receive a regulated subsidy (a supplement to the sales price) for a four-
year transition period.
19• The generator companies would be compensated for stranded costs of gas purchase
commitments.
In addition, the generation companies would have the opportunity to strengthen the capital base
by:
• The generation companies were allowed to keep unused deposits, whereas before the
liberalization the vertically integrated entities were obliged to return unused deposits to
the consumers.
• Revaluation of transmission networks (in the opening balances for transmission net-
works, etc. when transitioning from the non-profit price regulation to the new price regu-
lation) could be capitalized,
• The generation companies should receive payment for ancillary services from the TSOs
in connection with the TSOs taking over responsibility for the security of supply.
The TSOs and the transmission network companies were to finance this capital injection by
raising loans.
Generation companies received in total €1.2 billion to ensure that they would be able to operate
in the future market. The costs were collected by the TSOs during a ten-year period to reduce
the short-term impact on consumers.
In accordance with EU regulation, the funds were allocated for the purposes stated above, such
as subsidies to wind turbines and small natural gas-based CHPs, and an obligation of future
pension costs. Based on a Danish initiative, the EU Directive from 1996 stated that Service of
General Interest also included environmental concerns - later transferred to the current Public
Service Obligation (PSO). This has since driven the Danish green transition, e.g. subsidies to
wind turbines (see section 1.4 below).
In return for the capital transfer (and as part of the agreement), generator companies accepted
to merge into two companies, one on each side of the Great Belt (West and East Denmark).
Due to the economic situation at the time it was considered essential that possible efficiency
gains were realized as quickly as possible. In addition to this, some of the obligations imposed
during monopoly times were put on the two groups of generator companies (ELSAM and Elkraft
respectively) and by merging the companies within these groups it was not necessary to go
through a complicated split of the obligations between individual companies.
For the two TSOs, the task of designing the market was formidable. Many aspects were not de-
fined in the laws but were developed based on inspiration from Norway and Sweden. The TSOs
established the new role of balance responsible parties. A balance responsible must present a
plan for the hourly demand and generation the day before operation and is financially responsi-
ble for injections and withdrawals of electricity according to these plans. During the operating
20hour, the TSOs would buy regulating power to balance the system if needed. The cost of this
balancing power would then be distributed among the balance responsible parties based on
their actual imbalances. The distribution of costs in this fashion was designed to create incentive
“to be in balance”. A common Nordic market for regulating power, particularly access to low-
cost hydro-based regulating power in Sweden and Norway, has been key for enabling relatively
low costs of imbalances in Denmark.
1.4. 2000-2005: Separate arrangement for “prioritised” elec-
tricity
For a long period of time, electricity from small natural gas-based CHP units and wind turbines
was managed in a separate system. The amount generated by these prioritised sources was
computed and all consumers were obliged to buy a share of their electricity demand at a regu-
lated price.
In 2005, the system was simplified such that all electricity was sold on the free market, but a
special tariff was introduced to collect the subsidy for the prioritised generation, the Public Ser-
vice Obligation (PSO). However, in 2014 the EU deemed part of this set-up in violation of the
EU Treaty, and as a result the costs are to be transferred from the TSO tariff to the state
budget. This process started in 2017 and will gradually be implemented by 2022.
1.5. 2004: New ownership, TSO merger and new DSO regulation
In 2004, a major revision of the electricity law was passed by the Danish Parliament. The two
TSOs in Denmark: Eltra in West and Elkraft in East were merged into one TSO (Energinet). En-
erginet was formed as the TSO for both electricity and gas. The ownership of the transmission
grid was transferred to the state by the previous owners (cooperatives and municipalities). In re-
turn for this transfer of ownership, regulation that disincentivised selling of generator companies
was abolished, and new regulation was passed that allowed cooperatives and municipalities to
keep the proceeds in case they chose to sell their shares in the generator companies.
This resulted in a huge sell-off, initially to the dominant Danish and Swedish state-owned gener-
ator companies Dong Energy and Vattenfall. Today, Ørsted (previously Dong Energy) has con-
solidated its role as the largest Danish generation company. In 2014, a minority share of the
company was divested to private investors, and in 2016 Dong Energy was listed in the stock
market. The Danish government still owns a majority share.
21Case: Merger of two large generation companies – and the competition authority
In 2004, ELSAM and NESA was merged and the process was closely investigated by the
Competition Authority (today: Danish Competition and Consumer Authority). A number of ac-
tions were defined as part of the merger to secure that competition was not affected nega-
tively.
ELSAM was owned by 45 municipalities and DSOs from West Denmark. The company had
3,500 MW of large power plants, 400 MW of distributed CHPs and 400 MW of wind turbines.
The ELSAM owners also had shares in suppliers. NESA was a DSO in the Copenhagen area
(East Denmark) that also owned some generation (52 MW small CHP) as well as shares in
the large East Danish generation company E2, and supplier activities. NESA was a share-
holder company with two municipalities as the major shareholders.
In order to maintain competition after the merger, mandated actions included:
• The sale of all small CHP’s
• 600 MW of capacity would be offered as virtual power plants: Auctions were to be held
where other actors could control this capacity. This process can be seen as a way to
increase competition, and because the winner of the auction does not have to own or
operate the capacity more bidders can be expected.
• Shares in Elkraft (TSO for East Denmark) were sold to the state.
The authority studied the competition in the Nordic electricity market, e.g. hours with conges-
tion, and concluded that with the above actions undertaken, the merger could be allowed
(Konkurrencetilsynet, 2004).
As a result of the new financial freedom for the distribution companies, economic regulation was
revised. Since 2000, electricity distribution companies had been subject to income caps based
on necessary costs assuming an efficient operation of the company. Under the new regulation,
a company’s income could not increase based on tariffs per January 2004, calculated at real
prices and unchanged activity level and assuming efficient operation. Future income caps for
the grid companies were set based on the companies' 2004 revenues.
Case: From private transmission lines to full market operation
A well-functioning electricity market requires competition. In Denmark, cross-border trade and
thus competition from electricity generators and electricity traders in neighbouring countries
was an important element of market opening. Prior to the market opening, a large portion of
the transmission capacity on the international connections was reserved for long-term con-
tracts between the vertically integrated electricity companies. In connection with the market
22opening, the TSOs freed up capacity on the links between the countries so that it could be
made available for day-ahead trading. The transmission system operators thus allocated the
trading capacity for spot market exchanges between countries and price areas.
In 1991, Vattenfall and Energi E2 (Swedish and Danish generation companies) agreed on es-
tablishing the 600 MW DC cable between East Denmark and Germany, and the cable came
into operation in 1996. Under the agreement, Vattenfall had the right to transport 350 MW to
Germany. In 1999, Energi E2’s ownership was transferred to Elkraft (the TSO in East Den-
mark at the time), and Vattenfall’s right to transport was maintained.
When the day-ahead markets developed on both sides of the connection, it was agreed to
hand over the capacity to the market. This took place in three agreements from 2003, 2005
and 2006. For a period, Vattenfall received part of the congestion rents (price difference be-
tween the two sides) generated by the connection. Starting in 2003, direct auctions were held
by Energinet for use of the line, and from 2010 the day-ahead markets in Denmark and Ger-
many were fully integrated (referred to as implicit auction of the transmission capacity)
(Højesteret, 2013).
1.6. 2005-2010: Small CHP on the market and negative prices
Natural gas-based combined heat and power (CHP) had earlier been paid with a time-of-use
tariff (TOU). The tariff was developed to motivate environmental and distributed generation.
Hundreds of such units were installed in Denmark, supplying heat to local district heating sys-
tems, and the total capacity today is roughly 1,900 MW. A new system was then introduced
which combined a capacity payment with income from electricity sold on the market. In 2005,
units with greater than 10 MW of capacity were put on this market, and this limit was reduced to
5 MW in 2007. Starting in 2018, the sole source of income from electricity production for all CHP
units is from the market, while additional income is generated from the sale of heat to local dis-
trict heating systems.
In the day-ahead market, the price in a specific area during a specific hour represents the mar-
ginal cost. I.e. increasing demand with 1 kWh would result in additional generation from the low-
est cost unit with un-used capacity. Varying electricity prices illustrate the varying value of elec-
tricity.
Prior to 2009, spot prices could not be less than zero, which meant that in periods with excess
electricity generation (e.g. from wind power, which due to subsides could have a negative mar-
ginal cost), a market price could not be found directly. To solve this, all generation was asked to
reduce proportionally. With the introduction of negative prices, it becomes a competition of
23whom can reduce generation at the lowest cost. Start/stop costs may result in power plants hav-
ing to accept negative prices for a short period of time. Negative prices have led to improve-
ments in the dynamic operation of traditional generation. For example, some coal-based power
plants now have minimum generation as low as 10% of full load. Improvements in the dynamics
of existing power plants are described in: (DEA, 2015), (Agora-Energiewende, 2017) and (Clean
Energy Ministerial, 2018).
1.7. 2010-2015: West and East Denmark interconnected and
international coordination
In 2010, a 600 MW DC line across the Great Belt between West and East Denmark opened and
the two areas were directly connected for the first time (see Figure 4).
Figure 4. Internal and external transmission lines and the year of commission.
European integration of day-ahead markets developed during 2010-2015. Today, 23 countries
in the EU have a common day-ahead market, from Norway to Portugal and Poland to Ireland
(see Figure 5). A bid in one of the involved price areas will have impact in other areas, depend-
ing on the available transmission capacity. Because the large number of market participants and
the variation in generation technology, the large market is seen as a significant improvement in
terms of competition. Large investments are underway to increase the transmission capacity,
e.g. three DC lines are being established from the north of Germany (home to ample wind and
solar power capacity) to the demand centres in southern Germany.
24Figure 5: Countries with fully Integrated day-ahead markets. 23 countries, and an electricity demand of
2,900 TWh /year. (ENTSO-E)
Similar EU initiatives are underway, including making the intra-day and ancillary services mar-
kets coordinated over large areas. In June of 2018, single intraday coupling (SIDC) was
launched. SIDC creates a single EU cross-zonal intraday electricity market. In simple terms,
buyers and sellers of energy can work together across Europe to trade electricity continuously
on the day the energy is needed. Today, 14 countries are participating, the Nordic and Baltic
countries, Belgium, France, the Netherlands, Spain, Portugal, Germany and Austria. Seven
countries are expected to join soon (see Figure 6).
25Figure 6. Coordinated intra-day markets
With the increasing amount of variable renewable production, interest in trading in the intraday
markets is increasing, as it can become increasingly challenging for market participants to be in
balance after close of the day-ahead market. Maintaining balance on the network closer to deliv-
ery time is beneficial for market participants and for the power systems alike, due to for example
reducing the need for reserves and associated costs. In addition, the intraday market is an es-
sential tool that allows market participants to take unexpected changes in consumption and out-
ages into account. 8
1.8. 2014: Electricity Regulation Committee
As part of a political agreement in 2012 9, an independent Committee 10 tasked with analysing the
regulation of the Danish electricity sector was established. It was to, among other things, investi-
gate whether the current regulation supported effective competition in the electricity market,
8
See: en.energinet.dk/About-our-news/News/2019/06/13/xbid-first-anniversary-and-second-golive
9
Agreement 22 March 2012 between the Government and four opposition parties on Danish Energy Policy 2012-2020
10
Udvalg for el-reguleringseftersynet
26while ensuring the necessary consumer protection. In addition, it should investigate incentives
towards efficiency in the electricity sector, particularly whether the financial regulation of the mo-
nopolies (distribution companies and Energinet) provided sufficient incentives for efficiency im-
provements. The Minister appointed energy experts, sector representatives, consumer repre-
sentatives and green organisations as members of the Committee.
Since the 2004 revision of the income-cap regulation, it had been amended a number of times
(4 times between 2005 and 2011). In addition to the income cap, companies were also subject
to a rate of return ceiling and to benchmarking. Regardless of their income caps the companies
could not exceed the maximum stated rate of return on their grid assets (plus a turnover capital
of 2 per cent). Benchmarking determined the level of costs that, for each distribution company,
meant efficient operation. If the actual costs of the company were higher than this, the company
would be required to increase efficiency. The requirement was implemented as a permanent re-
duction in the income cap.
However, this regulation was deemed inflexible and lacking the proper incentives. The Commit-
tee therefore proposed a new set-up where income-caps shall consist of 1) cost framework, 2)
rate of return and 3) possibility of penalties for insufficient quality of delivery. Five-year regula-
tory periods were introduced, where the overall framework for the income caps is established
every five years. The cost framework is determined based on average, historical, total operating
costs and depreciations during the previous regulatory period. The cost framework is continu-
ously adjusted for efficiency requirements and exogenous factors including changed activities,
changed activity level, price development and grid losses. The companies are also subject to
individual efficiency requirements determined by benchmarking (see Figure 7).
In the new regulation, the rate of return ceiling is to be abolished and the rate of return must in-
stead be included as a component of the income cap. The return on the historical asset base
must be determined based on the historically possible rate of return for the distribution compa-
nies. The return on the future asset base must be determined based on a market-based
Weighted Average Cost of Capital (WACC) determined by the Regulator.
A main result of the Committee’s work was a 2014 law that abolished the system from 1999,
where consumers who did not select a supplier in the market were supplied by a “supplier of last
resort” (a supplier with a license to supply in a specific area) at regulated prices. This law was
replaced by a general obligation on trading companies to supply customers who requested it.
27Figure 7. Elements of proposed income regulation for distribution companies.
In 2016 the supplier-centric model was introduced (where all communication from customers
goes to the supplier and the DSO is less visible). It proved difficult in practice to develop the
data system technology needed, and the implementation had to be postponed several times be-
fore coming into effect. A central element of the supplier-centric model is the Datahub (see be-
low). All DSOs will send their measurements of demand to the Datahub and the suppliers can
access the data from the Datahub (and not the individual DSO). The consumer will pay the sup-
plier, including electricity taxes, while the supplier will forward money to the DSO (DSO tariffs
and taxes) and to the TSO. Finally, the DSO will send the taxes to the Ministry of Taxation.
Managing the flow of taxes is complicated and it required long negotiations to reach an agree-
ment. For households, taxes amount to more than 100% of the raw electricity price, so these
taxes represent significant amounts.
1.9. 2016-2020: One bill, smart meters and tariffs
Today, suppliers are still dominated by companies with a history based in the old distribution
companies. Some independent suppliers have entered the market, however their share of the
28You can also read