SA Power Networks 2020-2025 Draft Plan - Delivering better outcomes at a lower price - AWS
←
→
Page content transcription
If your browser does not render page correctly, please read the page content below
SA
Power
Networks
2020–2025
Draft Plan
Delivering better outcomes at a lower price
Acknowledgement of Country                          Disclaimer                                               Copyright
SA Power Networks acknowledges the Australian       This document is designed to promote early               This publication is copyright. SA Power Networks
Aboriginal and Torres Strait Islander peoples       engagement on our expenditure plans for                  reserves to itself all rights in relation to the
of this nation. We acknowledge the traditional      2020–2025, prior to our formal proposal being            material contained within this publication. You
custodians of the lands on which our company        lodged with the Australian Energy Regulator in           must not reproduce any content of this publication
is located and where we conduct our business.       early 2019. Unless otherwise stated, all monetary        by any process without first obtaining SA Power
We pay our respects to ancestors and elders, past   values are expressed in real 2020 dollars.               Networks’ permission, except as permitted under
and present. SA Power Networks is committed to                                                               the Copyright Act 1968 (Cth).
honouring Australian Aboriginal and Torres Strait   This document contains certain predictions,
Islander peoples’ unique cultural and spiritual     estimates and statements that reflect various            © All rights reserved.
relationships to the land, waters and seas and      assumptions concerning, amongst other things,
their rich contribution to society.                 economic growth and load growth forecasts
                                                    that, by their nature, may or may not prove to be
                                                    correct and are subject to ongoing change and
Company information                                 development.

SA Power Networks is the primary electricity        Whilst care was taken in the preparation of the
distribution network operator in South Australia.   information in this Draft Plan, and it is provided
For information about SA Power Networks visit       in good faith, SA Power Networks, its officers and
sapowernetworks.com.au                              shareholders accept no responsibility or liability for
                                                    any loss or damage that may be incurred by any
                                                    person acting in reliance on this information or
                                                    assumptions drawn from it for a different purpose
                                                    or in a different context.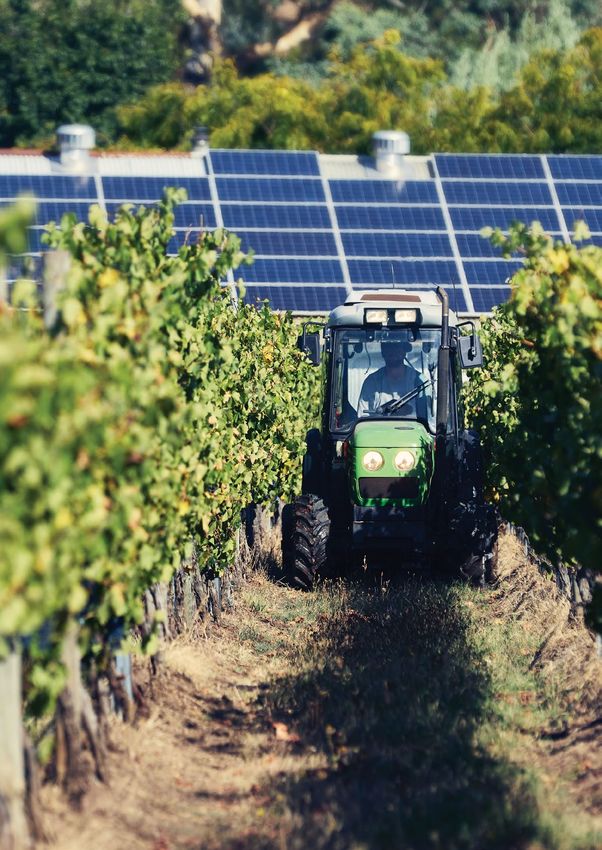
Delivering better outcomes at a lower price

                          I am pleased to present our 2020–2025 Draft Plan.
                          The Draft Plan outlines our expenditure and revenue
                          forecasts for delivering electricity services to 860,000
                          homes and businesses across South Australia.
                          We developed this plan with                       We know that the cost of living,
                          comprehensive input from our customers            including electricity bills, is a major
                          and stakeholders. The consultation                concern for many customers, and we
                          process began in early 2017 and three             have an important role to play in energy
                          key themes consistently emerged.                  affordability. Since privatisation in 1999/00
                          Our customers want us to:                         on average the increase in our prices
                                                                            has been in line with CPI resulting in
                          ›› do our part to keep a lid on prices,
                                                                            our component of residential bills
                             noting we represent approximately
                                                                            falling from 50% to 26%.
                             26% of a typical residential customer’s
                             electricity bill;                              This Draft Plan outlines how we will
                          ›› maintain electricity supply reliability        continue to keep the lid on prices
                             across the State; and                          below CPI for customers over the
                                                                            2020–2025 period.
                          ›› continue a managed transition
                             to the ‘network of the future’.                I am confident that our Draft Plan
                                                                            for 2020–2025 strikes the appropriate
                          As we engaged with our customers and
                                                                            balance between customer service,
Rob Stobbe                stakeholders, they consistently asked us
                                                                            network safety and price affordability.
Chief Executive Officer   to ‘do more for less’. We strongly believe
                                                                            I firmly believe it is in the long term
                          that this Draft Plan will achieve this; it will
                                                                            interests of our customers.
                          deliver better outcomes for our customers
                          at a lower price.                                 I am grateful for the time and
                                                                            contributions made by all of our customer
                          During 2020–2025 we will continue to
                                                                            representatives and stakeholders who
                          meet all of our regulatory obligations
                                                                            have helped us get the 2020–2025 Draft
                          for safety, supply reliability and customer
                                                                            Plan to this point.
                          service outcomes, as we have during
                          the current 2015–2020 period.                     I encourage you to review this document
                                                                            and send through your feedback so that
                          In addition, we will also deliver targeted
                                                                            we can further improve our Plan before
                          improvements in:
                                                                            it is lodged with the Australian Energy
                          ›› supply reliability for poorly-served           Regulator in early 2019.
                             customers;
                                                                            You will find more information on how
                          ›› bushfire risk reduction;                       to provide your feedback at the back of
                          ›› management of our ageing network               this document.
                             assets;
                                                                            I thank you for taking the time to review
                          ›› cyber security protections for customer        our 2020-2025 Draft Plan.
                             and business information; and
                          ›› enabling the transition to a distributed
                             energy future.
                          These better outcomes will be made
                          possible by:
                          ›› listening to our customers and                 Rob Stobbe
                             stakeholders;                                  Chief Executive Officer
                          ›› industry leading productivity
                             performance;
                          ›› innovative asset management
                             practices; and
                          ›› leading national thinking as we
                             transition to the network of the future.

                                                                                                                            i
Contents

Delivering better outcomes
at a lower price
Summary
1   Overview of 2020–2025 Draft Plan             1
2   Delivering services efficiently              8
3   Customer engagement                          16
4   Keeping prices down                          24

Detailed Content
5   Enabling the distributed energy transition   28
6   Capital expenditure                          34
7   Operating expenditure                        50
8   Revenue building blocks                      58
9   Tariff structure statement                   62
10 Alternative control services                  74
11 Feedback                                      78

                                                      iii
2020–2025
Draft Plan

Overview 1
2          SA POWER NETWORKS 2020–2025 DRAFT PLAN

    What this plan means for customers

    Delivering better outcomes at a lower price

    Keeping prices down                                     A safe and reliable
                                                            network
     $37       Reductions of $37                                  $726m
               in residential customer annual bills               to keep our ageing network performing well
               in 2020/21 and $148 for small to
               medium business customers’ bills

                                                                  $83m
               Delivered through                                  to continue safety programs and reduce
                                                                  bushfire start risk
               ›› reducing network capacity
                  investment by $106m
               ›› avoiding and deferring other
                  expenditure where possible
               ›› new technologies to keep spending
                  at sustainable levels
                                                                  $37m
                                                                  to maintain averagesupply reliability and

                                                                  $36m
               $280m total savings                                to improve supply reliability for 19,000
                                                                  regional customers and 73,000 customers
               to customers                                       in storm-prone areas

               through efficient reductions in investment

                                                                  Improved tree trimming through
                                                                  collaboration with councils and customers

               Remain the #1most                                 ✓ No additional cost

               efficient distribution
               business                                           Better information to customers during
                                                                  storms and other outages
               in Australia on a state-by-state basis
                                                                  ✓ No additional cost
Transitioning to
a new energy future

     $37m investment
     to ensure customers can continue
     to connect and export energy from
     their solar and batteries

     Supporting more
     renewable energy
     on the network

     Exploring alternatives
     to building network
      infrastructure
     $28m non-network opportunities

     $4m
     for trialling new technologies
     and innovative solutions

     Collaborating
     with government
     and industry
     to realise benefits to the community

                                            Overview   3
4             SA POWER NETWORKS 2020–2025 DRAFT PLAN

    1 Overview of 2020–2025 Draft Plan

    SA Power Networks is the                                   Keeping prices down
    primary electricity distribution
    network operator in South                                      $37
    Australia. We supply energy
                                                               This Draft Plan will deliver an average                    By the end of the current 2015–2020
    to more than 860,000 homes                                 annual price reduction of $37 for                          period we will have reduced capital
    and businesses.                                            residential customers in 2020/21
                                                               and a $148 saving for a typical small
                                                                                                                          expenditure by around $370 million
                                                                                                                          through prudent and efficient
    Our activities are regulated by the                        to medium business.                                        management— whilst still meeting
    Australian Energy Regulator (AER) and                                                                                 our obligations to connect customers,
                                                               These savings build on price reductions
    we are required to submit our expenditure                                                                             maintain reliability and meet service
                                                               in 2015/16, when distribution prices
    and revenue proposals to the AER every                                                                                standards.
                                                               were reduced by 25%. They are also
    five years for their review and approval.                  well in excess of the $13 savings in                       As a consequence, our regulated asset
    Our plans for 2020–2025 have been                          network (ie transmission and distribution)                 base (or RAB) will be smaller. This is
    informed by extensive engagement                           charges considered achievable by the                       good for customers, as a lower asset
    with customers, stakeholders and                           Australian Competition and Consumer                        base reduces the allowed return on
    other interested parties.                                  Commissions’ (ACCC’s) Inquiry into                         assets and helps keep a lid on future
    We have consulted with metropolitan and                    electricity retail prices.1                                distribution prices. Customers will save
    regional customers, the business sector                                                                               around $280 million in future network
    and various customer and stakeholder                                                                                  charges as a result of lower capital
    representatives. We also meet regularly                                                                               spending in the 2015–2020 period.
    with our Customer Consultative Panel
    as well as our business, renewables,
    community and arborist reference                           We are reducing prices by lowering
    groups. Feedback from these groups                         expenditure in some areas, particularly
    continues to shape our plans.                              in customer demand-driven investment
                                                               in the network (which will reduce by                       Since the AER’s Inaugural Annual
    Earlier this year we shared our preliminary
                                                               net $87 million). This is consistent with                  Benchmarking Report in 2014, SA Power
    plans and forecasts with customer
                                                               South Australia’s forecast economic                        Networks has consistently been ranked
    representatives and stakeholders through
                                                               conditions and associated network                          the most efficient electricity distributor
    a series of ‘deep dive’ workshops. We
                                                               growth requirements during 2020–2025.                      on a state-by-state basis when compared
    reviewed our plans after receiving their
                                                                                                                          to other Australian electricity distribution
    feedback and reduced capital expenditure                   We are also investing wisely in targeted
                                                                                                                          businesses. SA Power Networks continues
    (by $90 million) and operating expenditure                 areas such as Information Technology (IT)
                                                                                                                          to work hard to remain at the efficient
    (by $49 million). The revised forecasts                    systems and tools. These will increase our
                                                                                                                          frontier of Australian distributors and
    are presented in this Draft Plan, which                    field staff’s use of mobile technologies to
                                                                                                                          our Draft Plan reflects our ongoing
    achieves an appropriate balance of:                        better collect and process customer and
                                                                                                                          commitment to achieve this through
                                                               asset information as well as deliver work
    ›› keeping prices down;                                                                                               2020–2025.
                                                               programs efficiently.
    ›› maintaining a safe and reliable
       network; and
    ›› transitioning us to a new energy future.

    1   ACCC, Restoring electricity affordability and Australia’s competitive advantage Retail Electricity Pricing Inquiry – Final Report, June 2018 (Page XV)
A safe and reliable network
In September 2016, South Australia We propose $37 million to maintain To create a more sustainable environment
experienced a total loss of electricity supply reliability expenditure at current that minimises the need for tree trimming
supply (a ‘black system’ event) precipitated levels to meet our ongoing average over time, we are working to:
by extreme storm damage to ElectraNet’s reliability targets (which exclude the
›› reduce tree trimming costs over
transmission lines. This state-wide impact of major storm events) set by
the longer term;
blackout was a stark reminder to all the Essential Services Commission of
South Australians that reliable and South Australia (ESCoSA). We have also ›› improve visual outcomes through
secure electricity is essential for our included $36 million of expenditure to: partnering and collaborating with
modern lifestyle. councils; and
›› harden the network in the face of
›› improve public education/awareness.
SA Power Networks operates the oldest more frequent and increasingly severe
distribution network assets in the National weather events — improving reliability Key initiatives include:
Electricity Market (NEM) and the number for 73,000 customers in storm prone
of age related defects has been increasing areas; and ›› trials with councils to remove saplings
in recent years. During 2020–2025 we will and chemically regulate the growth of
›› improve reliability for 19,000 of our some tree species;
continue our 10-year asset management poorly-served customers — those that
program — agreed with State regulators experience excessively frequent or long ›› developing proposed amendments
in 2015 to maintain the standard of all power outages compared to other to the South Australian Vegetation
electricity assets to the legislated safety customers. Regulations to improve safety, reduce
and technical requirements. We are costs and deliver better community
developing new approaches to meet Our total reliability program is $20 million outcomes (with customer and
an increased workload, manage risk lower than we discussed with customers stakeholder support);
and keep the network performing well. and stakeholders earlier this year due to ›› developing processes to better assess
the removal of the Ceduna alternative the visual amenity, cost, and impact
This Draft Plan proposes $726 million power supply project, which is subject
to refurbish or replace aged and on tree health of different pruning or
to the ESCoSA service standards review. trimming techniques, in partnership
deteriorating assets to manage the
‘health’ of the network and ensure with our vegetation clearance
its safe and reliable performance contractor and a local council; and
well into the future. This forecast is ›› continuing a tree removal and
$49 million lower than that discussed replacement program to reduce
with customers and stakeholders the need for future tree trimming.
The 2018 St. Patrick’s Day bushfires in
earlier this year. This reduction follows
New South Wales and Victoria also remind These improvements will be delivered
further asset management modelling
us that extreme fire danger weather can at no additional cost to customers.
refinement and analysis.
have an impact on trees and powerlines
with catastrophic consequences.
The Draft Plan proposes to continue
our bushfire mitigation program with
$19 million expenditure planned for
2020–2025. This will help to maintain In 2020–2025 we will continue to refine
community safety by reducing the and enhance our capability to improve
probability that extreme fire danger how we communicate with customers,
weather will cause fires to start from particularly those affected during storms
our powerlines. The Safety program and other outages.
also includes expenditure to continue We will modify our systems to
ongoing programs to upgrade protection provide more personalised and localised
equipment ($24 million) and substation messaging to customers, including more
infrastructure ($40 million) to meet accurate supply restoration times for
current Australian standards. This is affected customers, at no additional
$24 million lower than discussed with cost to them.
customers and stakeholders earlier this
year due to extending the time period
of the program.
Overview 56 SA POWER NETWORKS 2020–2025 DRAFT PLAN
Transitioning to a new energy future
Customer expectations and technology- We are committed to supporting We are also committed to adopting all
driven changes are transforming the Government policy and the community’s viable alternatives to building network
way customers use electricity. South desire for more renewable energy on infrastructure to meet future network
Australia already has the highest per the network. challenges. Non-network solutions
capita take-up in Australia of domestic such as batteries and solar generation
We are working with:
rooftop solar. Retailers and other can defer or eliminate the need to build
‘aggregators’ are developing virtual power ›› the South Australian Government on traditional long-life network assets and
plants (VPPs) to aggregate customers’ its proposed program to support more result in lower prices for customers.
energy resources and centrally dispatch customers adopting battery storage;
During 2015–2020 we implemented
them into the electricity market. The ›› retailers who are considering VPPs that the following non-network solutions:
South Australian Government has plans will further increase the amount of solar
which could see 90,000 batteries connect and batteries connected to the network; ›› contracted third-party generation at
to our network in coming years, and Bordertown — deferring upgrade of
the take-up of electric vehicles is also ›› equipment manufacturers, to agree
a 33,000 volt powerline;
expected to increase. on appropriate standards for any new
equipment connecting to the network; ›› implemented the Salisbury residential
The existing electricity network was battery project which deferred the need
›› developers who are promoting new
designed and constructed over the past to build additional powerlines; and
‘greener’ residential developments; and
100 years to transport energy, from ›› connected a battery to the network
large coal and gas-fired power stations ›› industry participants around operation
at Cape Jervis, which helped defer the
connected to the transmission network, and management of third party energy
planned upgrade of the Cape Jervis
then through the distribution network services.
33,000/11,000 volt substation.
to customers. We expect that more than
50% of all electricity generated in the During 2020–2025 we will investigate
next five to 10 years will be generated non-network opportunities to:
by customer equipment that connects ›› use third party generation to avoid
into the electricity distribution network. a network upgrade at Robe;
This poses security and reliability
›› use systems and data to more actively
challenges for our network.
manage our low voltage network and
Customers also want to have more control avoid or defer the upgrade of network
over how and when they use energy. The assets;
network of the future will need to provide ›› use customer solar and battery systems
the platform for customers to access new to avoid network upgrades in the
energy products and services and have Aldinga area;
more choice in how they buy, use and
›› utilise customer resources to avoid
trade their energy.
replacing and upgrading long rural lines
During 2020–2025 we are proposing at Emu Bay on Kangaroo Island; and
‘no-regrets’ investment of $37 million ›› defer a new Gawler East zone
to continue to adapt the network to substation through customers in the
support increasing uptake of customers’ Gawler East area adopting solar and
distributed energy resources (DER) storage options.
like solar, battery storage and VPPs,
and enable further value release from
customer equipment under any of the
models described in the recently released
ENA/AEMO Open Energy Networks2
consultation paper. This is $20 million
lower than discussed with customers
and stakeholders earlier this year due
to a revision in the scope of a new low
voltage network operating model.
2 AEMO and Energy Networks Australia, Open Energy Networks, July 2018Additional solar and batteries on our The electricity industry will change Other customer-specific services
network, and the emergence of VPPs and profoundly over the next five to 10 years The AER will set prices for public lighting,
other new technologies, will drive further and we are currently working closely customer connection and other customer-
changes in the electricity industry. These with key stakeholders to adapt to these specific services for 2020–2025. These are
changes will present new opportunities changes and unlock value for customers discussed briefly in this Draft Plan.
for customers and will require new ways and stakeholders. Specifically, we are
for distribution businesses to operate working with: We do not expect any marked change
and manage their networks. in the price or delivery of these services.
›› technology providers (such as Tesla)
The AER will provide us with a demand to ensure we understand how the
management incentive allowance of market is changing;
around $4 million for 2020–2025 to ›› the South Australian Government
help fund research and development to support and enable its energy Feedback
of demand management projects. policy directions;
We expect to spend this allowance We now welcome feedback from
›› the Australian Energy Market all customers and stakeholders on
on a number of projects which will
Operator (AEMO) to ensure power this Draft Plan, to further improve
help us assess new technologies and
system security is not compromised; our plans before we lodge our full
their potential applications as well as
customers’ likely responses to these ›› the Australian Energy Market 2020–2025 Regulatory Proposal
technologies. Commission (AEMC) to make sure with the AER in early 2019.
that the rules under which we operate
We will explore: You can provide feedback in
continue to serve the long-term
various formats. Please refer
›› embedded networks with green interests of customers; and
to the end of this document
schemes which facilitate peer-to-peer ›› the AER to ensure our plans are the for more detail.
trading within the embedded network most efficient way to deliver on our
and reduce overall network demand; regulatory obligations and service
›› the potential impact of electric vehicle standards.
charging and opportunities for demand
management using smart vehicle
chargers;
›› integrating future VPP market
platforms; and
›› the impact and opportunities of
Tariffs
emerging smart hot water systems.
The AER will determine our total revenue
allowance for 2020–2025. We will then
recover this allowed revenue through
distribution tariffs, which are approved
by the AER each year.
This Draft Plan contains the tariff
structures and options that we are
proposing to include in our 2020–2025
Tariff Structure Statement. These tariffs
are designed to empower customers
to better manage their bills and keep
overall costs down.
Overview 7Delivering services efficiently SA Power Networks is ranked as the most efficient distributor on a state-by-state basis.
Delivering services efficiently 9
10         SA POWER NETWORKS 2020–2025 DRAFT PLAN

     About SA Power Networks

     Our performance

     #1 for efficiency                         Reliability and                        Industry leader
     in the National                           customer service                       in safety
     Electricity Market                        targets met

     What we do

         Operate the oldest           Provide network coverage    Deliver power to 99% of           Supply 860,000
       network in the National          over 178,000km²        South Australia’s population      homes and businesses
          Electricity Market

      Connect the most rooftop           Enable 25,000 new       Read more than 1 million         Maintain 240,000 street
        solar per capita in the         or altered connections    meters and provide data          lights for councils and
      NationalElectricity Market              each year                to retailers            South Australian Government
Our prices in line 26% of residential
with CPI since 1999 customers’ bills
How we do it
Employ 1,800 Located at 42 sites Deliver future-
South Australians across the state focused services that
customers value
What we manage
416 zone substations 77,800 647,000 Powerline route ≈ 20%
transformers stobie poles length: 8
2,000km underground
Delivering services efficiently 1112 SA POWER NETWORKS 2020–2025 DRAFT PLAN
2 Delivering services efficiently
Our performance $2,500
$37 $286 $271
$80
$84 $45
$2,000 $82
$45
$236 $188 $179
$181 $182 $164
$131 $175 $124 $138
$31 $155
$163 $165 $165
$151 $362 $294 $156
$150 $151 $186 $145
$1,500 $136 $167
The AER’s most recent $606 $793 $873 $805 $895
$939
$645 $649 $625
$699
$824
$1,051
$938
benchmarking report released $1,000 $526
$136 $140
$169
in December 2017 recognised $120 $124 $163 $138
$120 $136 $151 $163 $139 $136
$123
$500
SA Power Networks as the $626 $631 $585
$516
$536 $540 $628 $646
$672 $700 $534 $542 $568 $580
most efficient distributor on $0
1999/00
2000/01
2003/04
2007/08
2009/10
2010/11
2011/12
2012/13
2013/14
2014/15
2015/16
2016/17
2017/18
2018/19
forecast
forecast
a state-by-state basis, based
on ‘total factor productivity’. SA Power Networks incl. metering Transmission Energy and Retail
Table 2.1: Total Factor Productivity state rankings Government incl. green GST Discount incl. GST
State Ranking
Figure 2.1: Average SA residential electricity bills
South Australia 1
Victoria 2
Queensland 3
$2,000
Tasmania 4 1727
New South Wales 5 +39 -12
71
$1,600 123
Australian Capital Territory 6 1321
+158 170
83 +171
+49
Table 2.2: Total Factor Productivity by distributor $1,200 84
11
709
Network AER Ranking
538
CitiPower (VIC) 1 $800
SA Power Networks 2
$400
United Energy (VIC) 3 605 654
Jemena (VIC) 4
$0
Powercor (VIC) 5 2007/08 SA Power Networks Wholesale Environmental Retail costs Retail margin 2017/18 (est)
+ Transmission electricity
Energex (QLD) 6
Endeavour Energy (NSW) 7 SA Power Networks + Transmission Wholesale electricity Environmental
AusNet Services (VIC) 8 Retail costs Retail margin
TasNetworks (TAS) 9
Figure 2.2: Change in average South Australia residential bill per customer 2007/08 to 2017/18
Ergon Energy (QLD) 10 ($ per customer, real $2016/17, excluding GST)3
ActewAGL (ACT) 11
Essential Energy (NSW) 12
Ausgrid (NSW) 13
We rank number two on efficiency
when all of the distribution businesses
in the NEM are compared. We are second
only to a unique distribution business
that is responsible for a small footprint,
including the Melbourne Central Business
District (CBD).
3 ACCC, Restoring electricity affordability and Australia’s competitive advantage Retail Electricity Pricing
3 Inquiry – Final
ACCC, Restoring electricity affordability and Australia’s competitive Report,Retail
advantage JuneElectricity
2018 Pricing Inquiry – Final Report, June 2018250
200
150
100
Better than target
50
0
2013/14 2014/15 2015/16 2016/17 2017/18
SA Power Networks reliability Service Standard to June 2015 Service Standard from July 2015
Figure 2.3: Electricity network system reliability (excluding major event days) — average minutes of outages
2
per customer
Providing a safe, reliable and secure A focus on safety underpins everything
electricity supply is our core business. we do. Our recent safety performance
shows us leading the industry and in
In recent years, customers have
2017 we reduced our lost time injury
experienced poor supply reliability
frequency rate to almost zero.
because of major events including:
›› a state-wide power outage in
September 2016 caused by cyclonic-
force winds that damaged ElectraNet’s
transmission system; and
›› significant outages at the distribution
level caused by an unprecedented We strive to deliver outcomes for
number of storms in 2016 and 2017. customers at the lowest sustainable cost
Notwithstanding these events, we and we are conscious that every dollar
continued to meet our electricity supply we spend is paid for by customers.
reliability4 standards and our customers We understand that customers’
remain satisfied with the level of customer electricity bills have grown over time
service we provide. due to a range of new charges that
are not related to distribution costs;
most recently due to large increases
in wholesale/retail charges.
Our charges have remained in line
with CPI since 1999/00 (refer to Figure
2.1). We have been able to achieve this by
operating efficiently and considering the
effects of our decisions on our customers’
electricity costs. This contrasts with
wholesale generation costs that have
nearly doubled over the same period.
4 Measured using the system average interruption duration index (SAIDI) which reports the average minutes per annum that South Australian customers
are without electricity supply (excluding major event days). Method of calculating target and outcomes amended by ESCoSA in 2015/16
Delivering services efficiently 1314 SA POWER NETWORKS 2020–2025 DRAFT PLAN
3% Solar FiT costs
1% Metering costs 9% GST
4% Green and energy
efficiency scheme costs
SA Power Networks’ recovers its costs
from the distribution component of 26% Distribution costs ES
customers’ bills. This component has ARG
SA Power Networks CH
reduced from 50% to 26% for residential
NETWORK
customers since privatisation in 1999/00
and is now typically 28% for a small 50% Generation
business. and retail costs
7%
3
The recent ACCC report into electricity 7% Transmission costs
pricing shows that the significant recent
increases in electricity bills arise from
retailer/wholesale and government
scheme increases. Figure 2.4: Residential customer bill breakdown
4% Solar FiT costs
1% Metering costs 9% GST
5% Green and energy
efficiency scheme costs
28% Distribution costs ES
ARG
SA Power Networks CH
NETWORK
45% Generation
and retail costs
1%
4
8% Transmission costs
Figure 2.5: Business customer bill breakdownWhat we do
Our primary responsibility Our corporate vision is to be
at SA Power Networks is ‘a leader in delivering energy
to maintain the safety and services that customers value’.
reliability of the electricity Through direct engagement and surveys
network for 860,000 of our customers and key stakeholder
groups, we make sure that what we do
residential and business is valued by our customers and that we
work together to deliver energy services
customers, across a service they value.
area of 178,200km2. As a privately-owned business that
manages essential public infrastructure,
The majority of our assets were we are funded to provide a specified level
constructed in the 1950s, 1960s and of service for a reasonable commercial
early 1970s, and we now operate the return. These outcomes are overseen
oldest network in the NEM. through economic and service standard
regulation which are administered by
How we do it
the AER and ESCoSA respectively.
We apply prudent risk-based asset
management strategies to ensure The South Australian Government’s
continued good performance from Office of the Technical Regulator (OTR)
these ageing assets. We maintain, also monitors our technical compliance
repair, refurbish and replace these with requirements of the Electricity Act
assets as efficiently as possible 1996 (SA) and regulations, technical
based on their condition. standards, and codes.
And we are not just doing what we Our headquarters are in Adelaide
have always done. We have future- and we are one of the State’s largest
focused strategies to ensure we adopt organisations. We employ more than
and increasingly deploy new technology 1,800 people throughout metropolitan
and non-network alternatives from third and regional South Australia to support
parties where cost-effective – and we this network. We are also a major
avoid investing in long-life assets when training organisation, with hundreds
future technologies could prevent this of apprentices becoming the next
expenditure entirely. generation of powerline and electrical
tradespeople.
Since 2011, our Future Operating
Model5 has provided us with a perspective We operate out of 42 depots and offices
on what the future world looks like for located in the metropolitan area and
our customers and our network. It helps major country locations across the State.
us understand how our business will We are proud of what we do for South
need to adapt to support the changing Australians. We are particularly proud
needs and choices of our customers. that we are recognised as a cost-efficient
The Future Operating Model guides our business, despite the challenges of a big
broad decision-making and our strategies. State with a dispersed population.
We maintain and update this document
every two years as our operating
environment evolves.
5 Future Operating Model document is available at sapowernetworks.com.au
Delivering services efficiently 15Customer engagement Early, frequent and open engagement with customers and their advocates underpins this Draft Plan.
Customer Engagement 17
18      SA POWER NETWORKS 2020–2025 DRAFT PLAN

     Customer engagement program

            2,892                                    43                36
         participants                            Engagement      Reference Group
                                                   activities        meetings

              13                                    10                 4,071
      Locations across                         Newsletters    talkingpower.com.au
       South Australia                                                  visits
PHASE 1: Strategic Research and Early Engagement | Feb – July 2017
Customer Research Customer Priorities
ADELAIDE METRO
NORTH, SOUTH,
EAST & WEST ADELAIDE Outage Sustain- Network
HILLS
1,000 503 online 5 in-depth Comms ability reliability
interviews
Residential and
business customers PT LINCOLN RENMARK Future
Self-reliant Electricity
network
8 focus groups 402 telephone SA prices
options
surveys
PHASE 2: In-depth Engagement | Aug – Dec 2017
Directions Workshops
134 Participants
202 questions
answered
6 locations
Reliability
Network
of the
of the future
network Network
prices
54% residential 46% business/government
talkingpower.com.au Online Engagement
1,396 Registered
September
Network
October
Outage
November
Network of
reliability Comms the Future
Surveys Polls Forums Maps
Culturally and Linguistically Diverse Focus Groups
Network
54 4 30+ questions
Reliability
of the
network
prices
Restoring
asked power
Participants Communities
Vulnerable Customer Conversations
68 Network
prices
Participants 54% metro Adelaide 46% regional 27 discussion
townships and country topics raised
PHASE 3: Draft Plan Development and Engagement | Jan – Sept 2018
Deep Dive Workshops
240 Participants 10 Workshops
›› Business advocates ›› Retailers Tariffs Levels of Service
›› Arborist Reference Group ›› State Government Capex 1 Capex 2
›› Vulnerable customeradvocates ›› AER, AEMO, AEMC
Opex Future Networks 1
›› Local Government ›› Other specialist and
›› Renewable energyadvocates representative groups Future Networks 2 Future Networks 3
›› Residential andbusiness customers Public Lighting Information Technology
Customer Engagement 1920 SA POWER NETWORKS 2020–2025 DRAFT PLAN
3 Our customer and stakeholder engagement
Designing our
SA Power Networks
customer engagement
Customer Consultative Panel
Our Customer Engagement
› External chair
Program for our 2020–2025 › Representative from each
Plan began in February reference group
› Other customers and advocates
2017. It was designed as a
progressive, phased program
that would provide multiple
Arborist Renewables Business Community Electricity
and diverse opportunities for Advisory
dialogue and engagement. › Botanic and
tree advocates
› Solar industry
advocates
› Small & large
business
› Residential
customers › Residential
Our goal was to better › Local government › Environment &
sustainability
advocates
(meets quarterly)
› Vulnerable
customer
customers
(meets as needs)
(meets quarterly)
understand the expectations advocates
(meets quarterly)
advocates
(meets quarterly)
and priorities of our customers
and stakeholders so we could Figure 3.1: Customer Consultative Panel and Reference Groups
make sure that our plans for
2020–2025 were in their Our 2020–2025 Customer Engagement We have continued to evolve our program
Program continued our business-as-usual and adopt new engagement activities.
longterm interests. engagement and also: For example, we established a dedicated
website (talkingpower.com.au) that uses
Regular interactions with our ›› considered past engagement learnings;
online engagement tools to reach a
Customer Consultative Panel and ›› was informed by our reference group broad customer base through surveys,
reference groups (which typically meet members; polls, and forums. We undertook other
quarterly) have underpinned the program.
›› reflected our desire for continuous targeted activities such as consulting with
The panel and reference groups were
improvement; vulnerable customer groups and culturally
established in late 2015 and refreshed
›› was aligned to both AER and SA Power and linguistically diverse communities
in late 2016 and include more than
Networks’ consumer engagement (CALD). These were developed and
60 customers and consumer advocates
principles; and importantly delivered in response to stakeholder
from diverse occupations and interest
feedback and in partnership with several
areas including arborists, renewables, ›› was guided by a ‘no surprises’ of our stakeholder organisations (thanks
business, community, and electricity approach. to Multicultural Communities Council
advisory (refer to Figure 3.1).
SA, Australian Refugee Association,
Uniting Care Wesley Bowden, and
Uniting Communities).
A summarised version of our engagement
program can be found in Figure 3.2.Engagement outcomes
(summary)
Phase 1: Phase 2: Phase 3:
Strategic Research In-depth Engagement Draft Plan Development Our comprehensive engagement
& Early Engagement & Engagement program has provided rich, and at times
Feb–July 2017 Aug–Dec 2017 Jan–Sept 2018 diverse, feedback which we have used to
refine our Draft Plan (refer to Table 3.1
Customer Research Directions Workshops x7 Deep Dive Workshops overleaf). Broadly, customers have told
› Tariff Structure Statement us they value three areas:
› Levels of Service
Reference Group Survey Targeted Engagement › Capex x2 ›› Keeping prices down
› Culturally and Linguistically › Opex
Diverse (CALD) Engagement › Future Networks x3
›› A safe and reliable network
Planning Workshops x2 › Vulnerable Customer › Public Lighting ›› Transitioning to a new energy future
Conversations › Information Technology
› Business Customer
Capacity Building Workshops Conversations
Draft Plan Consultation
Technical Workshops at request
Outcomes of the AER
1. Customer Research
2. Engagement program talkingpower.com.au online engagement
framework Keeping prices down
3. Engagement themes
Bilateral engagement Electricity price increases are hurting
› Price
customers, particularly those who
› Reliability and resilience
› Network of the future are vulnerable or running a business.
Outcomes Outcomes
SA Power Networks must do its part
1. Directions Workshop report 1. Deep Dive Workshop to keep a lid on electricity prices. As
2. CALD Engagement report reports
a result, everything proposed in this
3. Vulnerable Customer 2. Draft Plan engagement
Draft Plan has been considered with
Conversations report
affordability in mind.
4. Talking Power Insights
report
Figure 3.2: 2020–2025 Regulatory Proposal Customer Engagement Program
Delivering our engagement Tariff Structure Statement (TSS) A safe and reliable network
In 2017, our engagement was broad Specific engagement on our 2020–2025 Reliable energy remains a high priority
and we sought customer insights around TSS is discussed in Section 9. The TSS for customers, particularly our business
three key themes that were identified outlines the more cost-reflective tariffs customers. In some regional areas,
in our preliminary customer research: we are proposing for 2020–2025 and customers asked for improved reliability
how these will empower customers locally and recognised that those
›› Network price improvements may come at a cost.
to better manage their bills.
›› Network reliability and resilience It was also important to many customers
›› The network of the future ESCoSA’s Service Standard that we continue to manage the
Framework review increasing risk of bushfires starting
We considered the priorities emerging
We have also worked closely with from powerlines.
from this early engagement in our
preliminary expenditure forecasting in ESCoSA in its 2020–2025 Service Standard
late 2017. These preliminary forecasts Framework review. We considered
were based on keeping expenditures as their requirements as we designed our
low as possible. They were then used in engagement activities and we shared
early 2018 to engage with stakeholders engagement outcomes. ESCoSA’s research
through a series of deep dive workshops, also assessed the extent of a customer’s
where we explored the capital and willingness to pay for improved reliability Transitioning to a new energy future
operating expenditure forecasts levels and this is reflected in its draft Customers support SA Power Networks’
presented in our Draft Plan. reliability standards for 2020–20256. responsible investment in the network
to realise the potential benefits of
distributed energy resources.
6 Essential Services Commission of South Australia, SA Power Networks reliability standards review — draft decision, August 2018
Customer Engagement 2122 SA POWER NETWORKS 2020–2025 DRAFT PLAN
Table 3.1 Customer feedback and our response
Theme What we heard Our response
›› Ongoing electricity bill increases are challenging ›› The Draft Plan will reduce customer’s bills in 2020/21 —
for customers, particularly vulnerable customers a $37 decrease for the average residential customer and
and small business a $148 reduction for a typical small to medium business
›› Ensure network prices are affordable while maintaining ›› Prudent approach to all expenditure forecasts to minimise
satisfactory service levels investments in the Regulatory Asset Base (RAB)
Keeping prices down
›› Actively look for efficiencies and innovate to stay ›› Efficient deferrals and refurbishment of assets when
at the efficient frontier and deliver price relief possible, eg improved risk-based approach is enabling
›› Avoid or defer expenditure where possible efficient deferral of $200 million of asset replacement
›› If expenditure is required, adopt a prioritised, ›› Continuation of internal programs to drive efficiencies,
staged approach to any programs while managing risk and retaining value
›› Instead of proposing step changes, absorb improvements ›› Expenditure programs only proposed when value
where possible outweighs cost
›› Apply an additional productivity growth factor ›› Staged, risk-based approach to capital programs,
to reduce costs targeting areas of greatest need and/or value
›› “Do more for less” ›› We have not applied a productivity growth factor (but we
continue to strive to achieve further efficiencies to deliver
on our operating obligations at a cost lower than our
allowances — sharing benefits with customers 70:30 as
per incentive scheme regulations. We are also absorbing
some cost increases and providing additional services for
no additional cost)
›› Total reductions of $90 million capital expenditure and
$49 million operating expenditure following customer
and stakeholder feedback on preliminary forecasts in
deep dive workshops (see sections 6 and 7 for details)
›› Continued reliability of the network is a high priority ›› Prudent expenditure plans to maintain current reliability
›› Some locations (Eyre Peninsula, parts of the Adelaide Hills) and safety levels and meet service standards
have indicated a desire for reliability improvements ›› Targeted program to improve reliability to ‘poorly served’
›› Regular asset inspection, maintenance and repair or customers
A safe and reliable replacement is important ›› Continuation of a targeted program to improve the
network ›› There is logic in our risk-based approach to asset resilience of storm-prone network areas
management — but need to avoid ‘boom and bust’ ›› Prudent bushfire risk mitigation plan to reduce the risk
cycles of expenditure of our network starting fires
›› Customers expect SA Power Networks to operate safely, ›› Proposed asset replacement program at sustainable levels
and balance safety, risk and affordability when managing ›› Removal of the IT step change associated with more
the network advanced customer engagement technologies proposed in
›› Bushfire safety is important, not only to those in bushfire the operating expenditure deep dive workshop — approach
risk areas, but to most customers now focuses on progressive system enhancements to
›› Customers value accurate, timely and tailored information improve customer communications over time
about power outagesTheme What we heard Our response
›› Enable continued uptake of renewable technologies ›› Continued refinement of our industry-leading Future
›› Allow customers to export to the network — but not Network Strategy and related projects, pilots and trials
at any cost ›› More detailed investigation into the options and
›› Ensure the network can support two-way energy flows opportunities that will enable increased take-up
of new customer technologies
Transition to a new ›› Consider ways of capturing and sharing data on distributed
energy future energy resources and network hosting capacity ›› An integrated approach to managing the challenges
and opportunities of new technologies and use patterns,
›› Actively pursue non-network solutions and avoid capital
including tariff design that is aligned to our Future
expenditure
Network Strategy (eg proposed Time of Use (ToU)
›› Future network plans should allow for a range of future residential tariff, VPP tariff)
scenarios
›› Potential non-network solutions identified, valued at
›› Consider how network tariffs and demand management $28 million
opportunities could be used to delay capital investment
›› Integrated, measured, and staged strategy aimed at
›› The AER’s Consumer Challenge Panel (CCP14) provided using the available data to dynamically manage flows
advice to the AER on our approach to addressing the on the network, rather than significantly augmenting
challenges of high penetration of solar and embedded the capacity of the network
generation on our network
›› Testing the market for potential demand management
opportunities and other trials
›› We are adopting a ‘no-regrets’ approach to managing
customer solar and embedded generation and accept
CCP14 comments that further significant consideration
of options will be beneficial
Evaluating our engagement Our Draft Plan
program Thank you to everyone who has talked to
We are always seeking to improve our us so far. In the spirit of ‘no surprises’ we Feedback
engagement and aim for best practice. are pleased to have discussed our Plan Do you have any feedback
We have reviewed our program’s with our stakeholders and are confident on our customer engagement
effectiveness and implemented that this Draft Plan reflects what you’ve program and outcomes?
improvements based on the customer told us is important — for us to deliver
and stakeholder feedback we received. a safe, reliable supply of electricity and
begin the transition to the future, all while
doing our part to keep a lid on costs.
We look forward to your feedback.
Customer Engagement 23Keeping prices down A $37 drop in annual residential bills and a $148 drop in distribution charges for business.
Keeping prices down 25
26                  SA POWER NETWORKS 2020–2025 DRAFT PLAN

     4 Keeping prices down

     The number one priority for                                    Revenue8
     customers and stakeholders                                     Our Draft Plan will deliver a
     throughout our customer                                        real reduction in distribution
     engagement program was                                         charges in the first year of the
     affordability of electricity.                                  2020–2025 period with no
     We shared our preliminary plans and                            real increases in charges in
     expenditure forecasts with key customer
     representatives and stakeholders earlier                       subsequent years.
     this year. At that time, we indicated                          We propose a revenue path whereby
     a revenue outlook increasing at                                revenue will reduce by CPI-3.9% in
     approximately 1% per annum above                               2020/21 and only increase by CPI in the
     CPI over the 2020–2025 period.                                 remaining four years of the period. We
     While most customers and stakeholders                          have used the AER’s revenue model to
     were generally understanding of our                            determine this revenue path but varied
     plans, it was clear that the majority                          from the AER’s standard approach to
     were seeking average price increases of                        deliver no real increases in the remaining
     no more than CPI, and preferably below                         four years of the period. The AER’s
     CPI. We have refined our plans which                           standard approach would deliver a
     has enabled a reduction to our proposed                        slightly bigger reduction in 2020/21 but
     capital and operating expenditure                              would see distribution charges increase
     in certain areas to better meet the                            above CPI in subsequent years. We have
     expectations of customers. We have also                        adopted our approach as we understand
     adopted a rate of return consistent with                       that while customers and stakeholders
     the AER’s draft Rate of Return Guideline                       want reductions in their bills in 2020/21,
     published in July 2018 and calculated a                        they also want no real price increases in
     5.55% weighted average cost of capital                         subsequent years. The final revenue path
     (WACC) which compares with our current                         is set in consultation with the AER.
     WACC of 6.13%. This also contributes to
     lower prices for customers.

     Table 4.1: Achievable average annual
     residential bill savings by 2020/217
     Table 4.1: Achievable average annual residential bill savings by 2020/217

         Region                      2017/18 Bill        Networks*           Wholesale     Environment           Retail          Reduction          2020/21          % Reduction

         Victoria                        1457                 39                 192             34                26                291              1166               20
         New South Wales                 1697                174                 155             43                37                409              1288               24
         South East Queensland           1703                147                 192             18                62                419              1284               25
         South Australia                 1727                 13                 227             89                42                371              1356               21
         Tasmania                        1979                113                 226             75                 –                414              1490               21

     * Networks includes both distribution and transmission costs

     7      ACCC, Restoring electricity affordability and Australia’s competitive advantage Retail Electricity Pricing Inquiry – Final Report, June 2018 (Page XV)
     8      The 2020–2025 revenue and pricing outcomes exclude any incentive carry-over amounts that may be determined by the AER
Electricity bills
$700
Under our approach, the
average residential customer’s $600 $578
$541
annual distribution charges $500
will reduce by $37 in 2020/21.
For a typical small to medium business, $400
distribution charges will fall approximately
$148. This significantly exceeds the ACCC $300
view that networks should be able to
deliver a $13 reduction in electricity
bills (see Table 4.1). $200
These savings build on the significant
reductions in our network charges $100
delivered in 2015/16. Figure 4.1 illustrates
the price change for an average $0
residential customer. 2019/20 2020/21
The detail behind the indicative price Figure 4.1: Average annual residential distribution bill comparison (nominal $)
and revenue forecasts is explained in
the following sections of this Draft Plan.
Feedback
›› Do you have any feedback on
our proposed revenue plans or
electricity bill impact?
›› Do you support our revenue
path approach?
Keeping prices down 27Enabling the distributed energy transition Transitioning from centralised to de-centralised generation. This section outlines: ›› the impacts that more solar systems and batteries will have on our distribution network; ›› the strategies we use to manage these impacts; and ›› our plans to enable further distributed energy resources to connect to our network.
Enabling the distributed energy transition 29
30 SA POWER NETWORKS 2020–2025 DRAFT PLAN
5 Enabling the distributed energy transition
The changing role of 1,600
the distribution network 1,400
It is easy to forget that as recently as Installed Solar Capacity (MW)
ten years ago it was extremely unusual 1,200
to see a solar panel on a roof in South
1,000 940
Australia. At that time, the role of the
distribution network was as it always
800
had been: to take energy generated in
the state’s large coal and gas-fired 600
generators, delivered at high voltage
to our zone substations via ElectraNet’s 400
transmission network, and distribute it to
homes and businesses across the state. 200
In 2018, the role of the distribution 0
network is very different. One in four
2009/10
2010/11
2011/12
2012/13
2013/14
2014/15
2015/16
2016/17
2017/18
2018/19
2019/20
2020/21
2021/22
2022/23
2023/24
2024/25
premises now has solar on the roof.
Taken together, these 200,000 rooftop
systems can now generate 940 megawatts
Actual AEMO strong AEMO neutral AEMO weak
(MW) of electricity in the middle of
the day — more than any other single Figure 5.1: Installed Solar capacity and future forecasts
generator in the state — much of which
is fed back into the distribution network
to be re-distributed to other homes
and businesses. Battery storage and VPPs
The market for residential battery South Australia is at the forefront of VPP
Rooftop solar capacity continues to
storage in South Australia is poised to use globally. In 2018, we already have:
grow strongly, and significantly ahead of
accelerate, driven by falling battery prices,
AEMO’s most recent forecasts (November ›› the 100-battery (300kW) VPP
discount schemes from major retailers
2017), driven in part by strong growth established by SA Power Networks in
and, most significantly, two major new
in the mid-sized, 30–200kW, commercial Salisbury in 2016 to provide support
South Australian Government programs.
sector as businesses respond to high to the network in that area;
The programs, commencing in 2018,
energy prices. The rate of applications ›› AGL’s 1,000-customer, five megawatt
include a $100 million home battery
for new systems in this sector of the VPP, which is currently being
fund that will offer subsidies of up to
market tripled from 2016 to 2017. implemented;
$2,500 each for 40,000 customers to
By 2026, AEMO is forecasting that there buy residential batteries, and the South ›› Simply Energy’s newly-announced
will be enough installed rooftop solar to Australian Government/Tesla Virtual 1,200 customer (6MW) VPP, which
supply the entire State’s energy needs at Power Plant scheme, which aims to will commence later this year; and
periods of minimum demand. roll-out up to 50,000 batteries, initially ›› the South Australian Government/Tesla
targeting Housing SA properties. These VPP. This first phase of the rollout, to
As we continue through this transition two schemes could see 90,000 new
from centralised to de-centralised 1,200 premises, will be complete in
batteries connected to our distribution mid-2019. The Government plans to
generation, the role of the distribution network in the coming years.
network changes and becomes more expand this VPP to a final size of 50,000
critical. Individual customers with solar The value of home storage is multiplied households, which would make it the
now rely on our network not only to when many individual batteries are largest VPP in the world, and at 250MW,
supply their energy needs at times of aggregated under central control to a very significant resource in the South
high demand, but also to export their form a VPP. Such VPPs can be dispatched Australian energy market.
surplus energy in the middle of the day. rapidly to supply energy to the wholesale Many of the 40,000 batteries subsidised
As rooftop solar continues to make up market or to provide ancillary services under the Government’s $100 million
an ever-larger proportion of the state’s (eg services that balance demand and grant program might also be enrolled
generation mix, the whole state energy supply) to the market operator. They in VPP schemes, as this will offer greater
system is becoming increasingly reliant are expected to play an important role savings to the householder than if they
on SA Power Networks’ electricity network in dynamically balancing supply and use as a stand-alone battery.
to supply and redistribute this energy. demand in energy networks throughout
the world as the energy mix becomes
increasingly dominated by intermittent
generation sources like solar and wind.You can also read