Major Industrial Property Taxation Impacts - UBCM
←
→
Page content transcription
If your browser does not render page correctly, please read the page content below
Union   of   British   Columbia   Municipalities   and   BC   Ministry   of
Community, Sport and Cultural Development
Major Industrial Property Taxation Impacts
March 12, 2012

Davies Transportation Consulting Inc.
Wave Point Consulting Ltd.
Lane Property Advisors Inc.
Major Industrial Property Taxation Impacts                          Davies Transportation Consulting Inc.

             This study has been undertaken for the Union of British Columbia Municipalities and
             the BC Ministry of Community, Sport and Cultural Development.

             The consulting team was led by Philip Davies of Davies Transportation Consulting
             Inc., in cooperation with Darryl Anderson of Wave Point Consulting Ltd. and David
             Lane of Lane Property Advisors Inc.

             The views expressed are those of the authors and do not represent the opinions of
             government or the UBCM.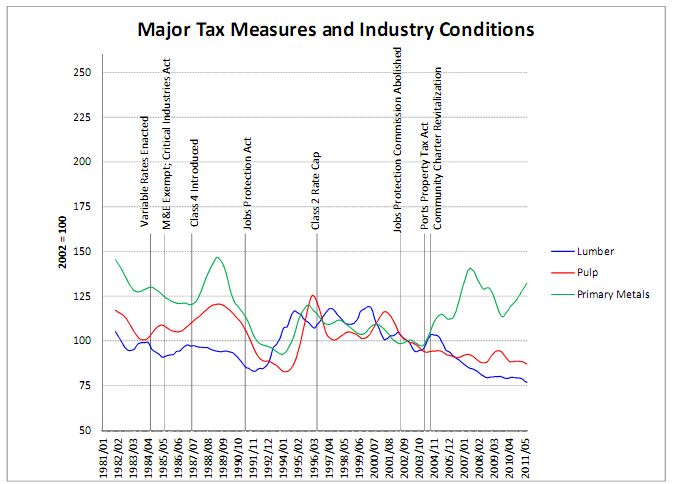
Major Industrial Property Taxation Impacts                                                             Davies Transportation Consulting Inc.

Major Industrial Property Taxation Impacts

Contents

1      EXECUTIVE SUMMARY ............................................................................................. 1

2      PROPERTY TAXES IN BRITISH COLUMBIA ............................................................ 5

2.1       Introduction ........................................................................................................................................5

2.2    Overview of Property Taxes in BC ...................................................................................................5
  2.2.1    Major Industrial Assessments - Non Market Valuation ................................................................5
  2.2.2    Property Classifications ...............................................................................................................6

2.3    Property Tax Rates ............................................................................................................................7
  2.3.1    Provincial Tax Rates ....................................................................................................................7
  2.3.2    Municipal Tax Rates ....................................................................................................................7

3      BUSINESS DECISIONS AND PROPERTY TAXES.................................................... 8

3.1       Investment in New Facilities .............................................................................................................9

3.2       Ongoing Operations and Temporary Closures.............................................................................11

3.3       Capital Re-Investment .....................................................................................................................11

3.4       Economic Obsolescence ................................................................................................................14

3.5       Plant Closures..................................................................................................................................15

3.6       Conclusions .....................................................................................................................................15

4      TAX POLICY AND INDUSTRY CYCLES .................................................................. 17

4.1       Major Industrial Properties Tax Base by Category.......................................................................17

4.2       Property Tax Policy and Economic Cycles ...................................................................................18

4.3    Municipal Tax Concessions............................................................................................................20
  4.3.1    City of Powell River ....................................................................................................................20
  4.3.2    Grand Forks ...............................................................................................................................21
  4.3.3    Castlegar....................................................................................................................................21
  4.3.4    Mackenzie ..................................................................................................................................22

4.4       Ports Property Tax Act ....................................................................................................................22
Major Industrial Property Taxation Impacts                                                           Davies Transportation Consulting Inc.

5      MAJOR INDUSTRIAL PROPERTIES - CASE STUDY APPROACH ....................... 24

6      PULP & PAPER......................................................................................................... 26

6.1       Industry Life Cycle and Cost Structure .........................................................................................26

6.2       Competitive Factors ........................................................................................................................28

6.3    Pulp & Paper Major Firms ...............................................................................................................30
  6.3.1    Catalyst Paper ...........................................................................................................................31
  6.3.2    Canfor and Canfor Pulp Limited Partnership .............................................................................31
  6.3.3    West Fraser Timber ...................................................................................................................32

6.4    Pulp & Paper Interviews ..................................................................................................................33
  6.4.1    New Investments .......................................................................................................................33
  6.4.2    Ongoing Operations ...................................................................................................................33
  6.4.3    Capital Re-Investment ...............................................................................................................33

7      SAWMILLS ................................................................................................................ 35

7.1       Industry Life Cycle and Cost Structure .........................................................................................35

7.2       Competitiveness Factors ................................................................................................................37

7.3    Major Firms.......................................................................................................................................40
  7.3.1    Canfor ........................................................................................................................................40
  7.3.2    West Fraser Timber ...................................................................................................................41
  7.3.3    Conifex .......................................................................................................................................41

7.4    Sawmills Interviews .........................................................................................................................42
  7.4.1   New Investments .......................................................................................................................42
  7.4.2   Ongoing Operations ...................................................................................................................42
  7.4.3   Capital Re-Investment ...............................................................................................................42
  7.4.4   Plant Closures............................................................................................................................42

8      MINING ...................................................................................................................... 43

8.1       Industry Life Cycle & Cost Structure .............................................................................................43

8.2       Competitive Factors ........................................................................................................................45

8.3    Major Mining Firms ..........................................................................................................................46
  8.3.1    Mining - Teck Coal .....................................................................................................................46
  8.3.2    Mining – Highland Valley Copper...............................................................................................46
  8.3.3    Copper Mountain Mining ............................................................................................................47
  8.3.4    Mining- Huckleberry Mines Ltd. .................................................................................................47

8.4    Mining Interviews.............................................................................................................................47
  8.4.1    New Investments .......................................................................................................................47
  8.4.2    Ongoing Operations ...................................................................................................................48
  8.4.3    Capital Re-Investment ...............................................................................................................48
Major Industrial Property Taxation Impacts                                                          Davies Transportation Consulting Inc.

9      ALUMINUM AND SMELTING ................................................................................... 50

9.1       Industry Life Cycle and Cost Structure .........................................................................................50

9.2       Competitive Factors ........................................................................................................................51

9.3    Major Firms.......................................................................................................................................51
  9.3.1    Teck Cominco Metals Trail ........................................................................................................51
  9.3.2    Rio Tinto Alcan...........................................................................................................................52

9.4    Smelting and Refining Interviews ..................................................................................................52
  9.4.1   Ongoing Operations ...................................................................................................................52
  9.4.2   Capital Re-Investment ...............................................................................................................53

10        SHIPBUILDING AND REPAIR ............................................................................... 54

10.1      Industry Life Cycle, Cost Structure & Profitability .......................................................................54

10.2      Competitive Factors ........................................................................................................................55

10.3      Major Shipbuilding and Repair Firms ............................................................................................55

10.4 Shipbuilding and Repair Interviews ...............................................................................................56
  10.4.1 New Investments .......................................................................................................................56
  10.4.2 Ongoing Operations ...................................................................................................................56
  10.4.3 Capital Re-Investment ...............................................................................................................56

11        MARINE TERMINALS & GRAIN ELEVATORS..................................................... 57

11.1      Industry Life Cycle & Cost Structure .............................................................................................57

11.2      Competitive Factors ........................................................................................................................59

11.3      Marine Terminal and Grain Elevator Firms....................................................................................60

11.4 Marine Terminal & Grain Elevator Interviews................................................................................61
  11.4.1 New Investments .......................................................................................................................61
  11.4.2 Ongoing Operations ...................................................................................................................61
  11.4.3 Capital Re-Investment ...............................................................................................................61

12        APPENDIX A – GLOSSARY OF TERMS .............................................................. 63

13        APPENDIX B STAKEHOLDER INTERVIEWS ...................................................... 66

14        APPENDIX C – MAJOR INDUSTRY COMPARISON FINANCIAL RESULTS...... 67

15        APPENDIX D RELEVANT SECTIONS OF BC ASSESSMENT ACT .................... 68

16        APPENDIX E DEPRECIATION RATES FOR MAJOR IMPROVEMENTS ............ 70
Major Industrial Property Taxation Impacts                                             Davies Transportation Consulting Inc.

17
   APPENDIX E REVITALIZATION TAX EXEMPTIONS UNDER THE COMMUNITY
CHARTER ........................................................................................................................ 71


18
     APPENDIX F REGIONAL ASSESSED VALUES .................................................. 73
Major Industrial Property Taxation Impacts Davies Transportation Consulting Inc.
Table of Figures
Figure 2-1 Provincial Property Tax Rates 2011...............................................................................................7
Figure 3-1 Business Decision Making .............................................................................................................9
Figure 3-2 Capital Cost Examples Major Industries ........................................................................................9
Figure 3-3 Major Industries Operating Expense Categories..........................................................................10
Figure 3-4 Major Industries: Indirect Taxes as a Percentage of Total Expenses ..........................................11
Figure 4-1 Major Industrial Properties Tax Base by Sector 2010 ..................................................................17
Figure 4-2 Major Tax Measures and Industry Conditions..............................................................................18
Figure 5-1 Class 4 Industries Industry Life Cycle and Commodity Price Status 2011...................................24
Figure 6-1 Pulp and Paper Major Markets and Life Cycle Stages.................................................................26
Figure 6-2 Paper Products Cost Structure.....................................................................................................26
Figure 6-3 Paper Manufacturing Profitability and Investment Returns ..........................................................27
Figure 6-4 Newsprint and Pulp Prices 2006 – 2010 ......................................................................................29
Figure 6-5 Pulp and Paper Assessment by Company 2010..........................................................................30
Figure 6-6 Canfor Pulp Financial Performance 2006 – 2010 ........................................................................32
Figure 6-7 West Fraser Financial Performance 2005 – 2010........................................................................32
Figure 6-8 Eurocan Financial Performance 2009 and 2010 ..........................................................................33
Figure 7-1 Softwood Lumber Major Markets and Industry life cycle ..............................................................35
Figure 7-2 Wood Products Manufacturing Cost Structure .............................................................................36
Figure 7-3 Wood Products Manufacturing Profitability and Investment Returns ...........................................36
Figure 7-4 Canada – US Exchange Rate 2002 – 2011 .................................................................................39
Figure 7-5 Softwood Lumber Prices 2005 – 2010 .........................................................................................39
Figure 7-6 Sawmills Assessment by Company 2010 ....................................................................................40
Figure 7-7 Canfor Financial Data 2006 – 2010..............................................................................................41
Figure 8-1 BC Mining Industry Sales by Sector 2010....................................................................................43
Figure 8-2 Mining Major Markets and Life Cycle Stages ...............................................................................43
Figure 8-3 Mining Cost Structure ...................................................................................................................44
Figure 8-4 Mining Industry Profitability and Returns on Investment ..............................................................44
Figure 8-5 Mining Assessment by Company 2010 ........................................................................................46
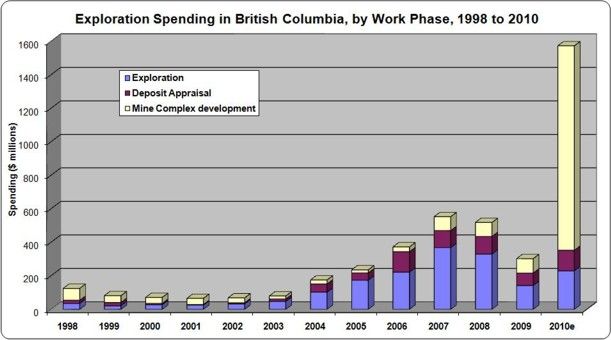
Figure 8-6 Mineral Exploration and Mine Development Expenditures in BC 1998 – 2010............................48
Figure 9-1 Aluminum and Smelting Major Markets and Life Cycle................................................................50
Figure 9-2 Aluminum and Smelting Tax Base by Company 2010 .................................................................51
Figure 10-1 Shipbuilding & Repair Major Markets and Life Cycle Stages .....................................................54
Figure 10-2 Shipbuilding Manufacturing Profitability and Investment Returns .............................................55
Figure 11-1 Marine Terminal Major Markets and Life Cycle Stages..............................................................57
Figure 11-2 Grain Elevators Major Markets and Life Cycle Stages...............................................................57
Figure 11-3 Transport Services Cost Structure .............................................................................................58
Figure 11-4 Transport Services Profitability and Return on Investment ........................................................58
Figure 11-5 Marine Terminals and Grain Elevators.......................................................................................60
Figure 11-6 Marine Terminals Tax Base by Terminal Type...........................................................................60
Figure 13-1 Stakeholder Interview Summary ................................................................................................66
Figure 18-1 Lower Mainland Major Industrial Assessed Values 2011...........................................................73
Figure 18-2 Southwest Interior Major Assessments 2011 .............................................................................73
Figure 18-3 Central Interior Major Assessments 2011 ..................................................................................74
Figure 18-4 Northern Interior (Excl. Rocky Mountain) Major Assessments 2011..........................................74
Figure 18-5 North Vancouver Island Major Assessments 2011 ....................................................................75
Figure 18-6 South Vancouver Island Major Assessments 2011....................................................................75
Major Industrial Property Taxation Impacts Davies Transportation Consulting Inc.
Major Industrial Property Taxation Impacts                                Davies Transportation Consulting Inc.

 1            Executive Summary
This study has been undertaken for the Union of British Columbia Municipalities and the BC Ministry of
Community, Sport and Cultural Development to assess the impact of property taxation on business
decisions related to major industrial facilities defined as Class 4 properties under BC’s Assessment Act. The
analysis encompasses major business decisions including investment in new facilities, ongoing operations
and temporary closures, re-investment in existing plants, and economic obsolescence and plant closure.
The study includes detailed case studies for representative major industrial sectors from a sample selected
to illustrate the impact of industry life and commodity price cycles on the sensitivity of business reactions.
Industry views on the impacts of property taxes were obtained from extensive interviews with
representatives from a wide selection of companies encompassing the major sectors in the Class 4
category.

The consulting team was led by Philip Davies of Davies Transportation Consulting Inc., in cooperation with
Darryl Anderson of Wave Point Consulting Ltd. and David Lane of Lane Property Advisors Inc.

Major Industries Property Tax Issues in British Columbia

The impact of municipal property taxes on major industry in British Columbia has been a subject of
controversy for years. Business complaints have focused on the differentials between municipal taxation
rates on major industries relative to residential property. High tax rates have been blamed for reducing the
competitiveness of BC firms in global markets.

Supporters of the existing system have argued that higher tax rates on major industries are justified
because the presence of major industry imposes significant costs on municipalities, directly through the
provision of services to industry and indirectly to provide the services which are necessary to enable firms
to attract workers. They point to the relatively insignificant cost of municipal tax rates in firms’ overall costs.

The issues came to a head in 2009 due to the impact of the recession on major forest products companies.
In 2009, there were seven lawsuits filed by major industrial property owners with respect to municipal tax
rates. Most prominently Catalyst Paper, a major pulp and paper producer, refused to pay its property tax bill
and launched a court challenge to the tax rates based on the proposition that their tax rates are inconsistent
with the cost of services provided.

Overview of the BC Property Tax System

In British Columbia annual property tax costs are the product of the taxable assessed value multiplied by
the applicable tax rates. The taxable assessed value and property classification are determined by BC
Assessment, an independent crown agency, legislatively mandated to assess all property throughout British
Columbia at its actual value and on a fair and equitable basis. Tax rates are set by the province,
municipalities and a number of other taxing jurisdictions. Our analysis in this study focuses on general
purpose tax rates set by municipalities.

The BC system is distinctive in that assessment of major industrial improvements (buildings & other
components) is based not on market value, but rather through utilization of a costing manual, commonly
referred to as the Major Industrial Property (MIP) manual. The costs estimated from the MIP manual are
depreciated at legislated annual depreciation rates that range from 4% to 6.5%. In the instance of an
operating major industrial plant the annual depreciation is capped at a maximum of 80%. Assessment
values are adjusted each year by a cost factor based on trends in changes in reproduction costs of the
assessable assets. It is noteworthy that the current major industrial system assessment does not reflect
increases or decreases in value as a result of commodity price changes.

Class 4 tax rates are set by individual municipalities. Properties outside of municipal areas are taxed at
standardized provincial rates except in Peace River, and these properties are also taxed by the regional
districts at rates that differ according to the services provided. The Province retains the authority to
intervene in municipal tax decisions; however this authority is very seldom utilized.

                                                        1
Major Industrial Property Taxation Impacts Davies Transportation Consulting Inc.
Property Tax Impacts
To analyze the impact of municipal property taxes on major industry sectors, case studies based on
industry life cycles, commodity price cycles, financial returns and competitive factors were conducted.
Extensive interviews were also undertaken with representatives of firms in each sector.
Analysis of industry costs at the national level confirms the relatively low contribution of property taxes to
overall industry costs. Based on Statistics Canada data, the share of total costs attributable to indirect taxes
(including municipal property taxes) averaged .54% from 2005 to 2009. Among the specific industry sectors
analyzed for this study, the share ranged from .17% for the petroleum and coal sector to 1.19% for marine
terminals.
With the possible exception of marine terminals, our analysis of a sample of individual companies in BC did
not indicate that property taxes account for a dramatically disproportionate share of costs relative to the
national averages. Using the most prominent example, in 2009 Catalyst’s municipal property taxes of $23
million accounted for approximately 1.15% of estimated total operating costs. This is substantially higher
than the national average of .22% for all indirect taxes for the paper industry, but still a small portion of total
costs.
Interviews with company representatives confirmed the following decision patterns:
Property taxes are not a major competitive issue under typical operating conditions. Property taxes
constitute a very small portion of overall costs and as long as industries are operating profitably have little
impact on business operating decisions such as output levels or the distribution of activity among multiple
facilities.
Property taxes are not a significant factor in investments in major capital projects because
anticipated costs are small relative to total operating costs and potential revenue over the economic
life of the new investment. These projects tend to be undertaken in periods of high commodity prices
when investors see a potential for extraordinary profits. A business decision to undertake a major capital
investment is most sensitive to the major factors that contribute to either revenue or cost uncertainty.
Recent examples in BC include the Alcan expansion, the new Mount Milligan mine, and the reopening of
the Copper Mountain mine.
Property taxes do affect decisions on re-investment in existing facilities, which may affect the long
term viability of operations. These investments may be undertaken in periods of low commodity prices, in
order to maintain production capacity or provide incremental reductions in operating costs. In the forest
sector, firms are requiring rapid payback of capital when undertaking investments due to the industry
downturn. A payback of 1 year for minor capital projects and 5 to 10 years for major projects is typical.
Firms are seeking exemptions from taxation for their new investments to provide additional certainty for
their capital recovery and to meet their investment objectives.
Property taxes have a larger impact on investment decisions for firms with multiple locations. Capital
renewal and business expansion decisions are based on opportunity costs. While re-investment in a plant
may be profitable, firms with multiple locations will optimize their allocation of capital to the projects which
have the highest overall return on an incremental basis. Since capital is scarce those jurisdictions with high
fixed costs will receive relatively fewer investment dollars than competing alternatives. In addition to the
internal rate of return on their capital, firms will consider the differential revenue and cost implications to
existing production and sales. Other things being equal, firms have an incentive to favour investment in
mills located outside of municipal boundaries or other political jurisdictions with lower major industrial tax
rates.
Property taxes become a major factor for firms in financial distress due to structural or cyclical
factors, because property taxes may constitute a large portion of firms’ fixed costs. The “tipping
point” may be the decline in profitability to the point where revenue is insufficient to cover the weighted cost
2Major Industrial Property Taxation Impacts Davies Transportation Consulting Inc.
of capital. Since debt is a legal obligation that must be paid this leaves the shareholder’s equity investment
in either retained earnings or share capital at risk. Firms and equity investors become very concerned about
the level of property taxes when their rate of return is insufficient in relation to the risk. Investors look to see
what incremental operating improvements can be made to make the rate of return acceptable.
The decline in profitability may be due to short term cyclical fluctuations in commodity process or long term
structural issues. Long term structural issues affecting the competitiveness of industrial plants include:
• Resource depletion.
• Entry of new low cost firms.
• Exchange rates.
• Cyclical or secular (long term) price declines.
• Rising variable costs (labour, energy, etc.)
• Rising fixed costs (capital, insurance, property taxes, etc.)
• Obsolete technology.
Major industries in BC are particularly vulnerable because with few exceptions they are price takers in
global commodity markets.
Tax Policy Issues
In 1987 the current assessment system was implemented for major industries. Under this approach the
value of major industrial property is determined on the basis of an assessment “manual” rather than the
appraisal techniques used for determining market value.
The use of the assessment manual provides stability in the determination of property values because
prescribed replacement costs are used. This is in contrast to the economic models used by appraisers
using a market value approach. In a market-based assessment system factors external to the property that
do affect property value are referred to in appraisal terminology as external obsolescence. In accordance
with generally accepted valuation practice the type of factors analysed in this report do impact on the
market value of the affected asset.
There are two implications arising from the current prescribed assessment practices that impact business
decision-making. The first implication is industries that see an appreciation in the value of their properties
based on rising commodity prices are not exposed to increasing property taxes. This is one of the reasons
why the amount of property taxes a firm is paying in BC is of relatively less concern in a rising market, or
when there is robust economic growth. However, the second implication is that if appraisals are not
reassessed periodically the property value may deviate substantially from actual market value and over- or
under-represent the industry's profitability and ability to pay based on long term trends in their global
competitiveness.
Major industry property taxes in BC are relatively insensitive to market influences on industry profitability.
Class 4 property values are determined by the criteria in the assessment manual rather than through a
market based approach. Consequently the only avenue for firms to seek property tax relief to cope with
economic obsolescence and/or cyclical price downturns is to seek tax relief from municipal councils.
Municipalities have the ability to set their tax rates to account for changes in economic conditions, but they
also have long-term service obligations and may find it difficult to adjust to reductions in tax revenue when
economic conditions change.
The lack of any link between the market value of Class 4 industrial assets and their assessment for property
tax purposes inadvertently creates a perception that a company is unaffected by long and short term
competitive factors. The impacts of this perception could be especially severe for industries like pulp and
paper that is both substantially overvalued relative to its ability to generate financial returns, and suffering a
cyclical downturn.
In previous industry downturns, and for specific industries, the Province intervened to assist major
industries. This was accomplished through the services of the Critical Industries Commission from 1986 to
3Major Industrial Property Taxation Impacts Davies Transportation Consulting Inc.
1992, and the Jobs Protection Commission from 1992 to 2002. Since the signing of the Canada – US Free
Trade Agreement in 1988, followed by NAFTA in 1994, the ability of governments to assist industry has
become increasingly constrained by international trade obligations. In the case of BC, the long running
trade dispute with the US over softwood lumber exports has also had a major impact. In 2002, assistance
from the Jobs Protection Commission was found by the US Department of Commerce to be a
countervailable subsidy; the Commission was abolished by the provincial government in the same year.
In 2004 the Province amended the Community Charter to provide more flexibility for municipalities to enter
into tax agreements with specific taxpayers by establishing a revitalization program. Municipalities have
used this authority to provide investment incentives to Class 4 industries, and in one case (Mackenzie) the
revitalization program has been used to negotiate minimum employment levels over the term of the
agreement. Even if these programs are found to be consistent with international trade obligations,
municipalities are limited in their ability to assist industries in distress by their financial capacity.
4Major Industrial Property Taxation Impacts Davies Transportation Consulting Inc.
2 Property Taxes in British Columbia
2.1 Introduction
This study has been undertaken for the Union of British Columbia Municipalities and the BC Ministry of
Community, Sport and Cultural Development to assess the impact of property taxation on business
decisions related to major industrial facilities defined as Class 4 properties under BC’s Assessment Act. The
analysis encompasses major business decisions including investment in new facilities, ongoing operations
and temporary closures, re-investment in existing plants, and economic obsolescence and plant closure.
The study includes detailed case studies for representative major industrial sectors from a sample selected
to illustrate the impact of product life and commodity price cycles on the sensitivity of business reactions.
Industry views on the impacts of property taxes were obtained from extensive interviews with
representatives from a wide selection of companies encompassing the major sectors in the Class 4
category.
The consulting team was led by Philip Davies of Davies Transportation Consulting Inc., in cooperation with
Darryl Anderson of Wave Point Consulting Ltd. and David Lane of Lane Property Advisors Inc.
2.2 Overview of Property Taxes in BC
In British Columbia annual property tax costs are the product of the taxable assessed value multiplied by
the applicable tax rates. The taxable assessed value and property classification are determined by BC
Assessment, an independent Crown agency legislatively mandated to assess all property throughout British
Columbia at its actual value and on a fair and equitable basis. The assessment of major industrial property
is unique in that unlike assessments for the significant majority of properties it is not market based. Tax
rates are set by the province and municipalities along with a number of other taxing jurisdictions.
2.2.1 Major Industrial Assessments - Non Market Valuation
The significant majority of properties in BC are assessed on the basis of the actual value. Actual value and
market value are generally considered to be synonymous. For example if your home is assessed at
$500,000 it would follow that the price that you could sell your home at would be approximately $500,000.
There are approximately 500 Major Industrial Plants including pulp and paper mills, saw mills, oil refineries,
cement plants, shipbuilding facilities, smelters and mines. In addition there are approximately 9,000 gas and
petroleum properties that are classed as Major Industrial properties. Notwithstanding the Major Industrial
Classification, the significant majority of these properties consist of well sites and related oil/gas field
facilities that typically carry very nominal property assessments i.e. less than $50,000. For this reason, the
assessment and taxation of these small oil and gas properties are not further investigated or commented on
in this report.
The assessment of the land component of major industrial properties is estimated on the basis of the land’s
actual/market value. Major industrial improvements (buildings & other components) are not assessed on a
market basis but rather through utilization of a costing manual, commonly referred to as the Major Industrial
Property (MIP) manual. Estimation of improvement assessments involves determining the quantity of the
improvement or more likely the component of the improvement and multiplying this quantity by the rate
contained in the MIP manual as being applicable to the particular improvement or component. For each
assessment year BC Assessment through consultation with owners of major industrial properties applies a
factor to the manualized costs determined from the MIP manual. This factor adjusts or indexes up the
estimated costs to the current assessment year and makes a further minor adjustment for Interest During
Construction. The unit costs in the manual tend to be low relative to current development costs, and
improvements or components thereof described in the manual may not fully reflect the impact of changes in
technology and construction methods.
5Major Industrial Property Taxation Impacts Davies Transportation Consulting Inc.
The costs estimated from the MIP manual are depreciated at legislated annual depreciation rates that range
from 4% to 6.5%. In the instance of an operating major industrial plant the annual depreciation is capped at
a maximum of 80%. In the instance of a major industrial property that is not operating and is not being held
for future operation the property may be eligible for additional depreciation, commonly referred to as a
closure allowance. Closure allowances may be granted in two situations:
• Firstly where a senior executive of the owner of the major industrial property provides a declaration to
BC Assessment that the plant is permanently closed.
• Secondly in the instance where a major industrial plant has been closed for three years and senior
executive of the owner provides confirmation to BC Assessment of the plant’s closure. In instances where
the major industrial plant complies with the closure allowance maximum depreciation is increased from 80%
to 90%.
Under the non-market based manualized assessment system in the instance of a permanently closed plant
the estimated cost for the closed plant is escalated each year to reflect increased construction costs and
interest during construction, while at the same time depreciation is capped at 80%. The consequence of
these calculations is that the assessed value of a permanently closed plant increases each year.
Machinery and equipment is not subject to property assessment in British Columbia. Thus in the instance
of major industrial plants it is the buildings and other improvements to the land and that are attached to the
land, which are subject to property assessment and taxation.
Total assessed value for an industrial property is calculated as the sum of the market based actual value of
the underlying land plus the non-market-based or manualized depreciated cost estimate of the
improvements to arrive at the total assessed value of the major industrial property.
The legislative and regulatory framework differs from generally accepted appraisal practice, because the
assessment on the land component of an industrial property is on a different basis than the assessment of
the improvement component, with land valuations based on market, and improvements on non-market.
2.2.2 Property Classifications
Under the Assessment Act, Prescribed Classes of Property Regulation B.C. Reg 344/2010 establishes the
following property classifications:
Class 1 residential
Class 2 utilities
Class 3 supportive housing
Class 4 major industry
Class 5 light industry
Class 6 business and other
Class 7 managed forest land
Class 8 recreational property/non-profit organization
Class 9 farm
6Major Industrial Property Taxation Impacts Davies Transportation Consulting Inc.
2.3 Property Tax Rates
2.3.1 Provincial Tax Rates
2011 provincial property tax rates for general purposes by class and their respective ratio to the residential
tax rates expressed as dollars per thousand of assessed value are set out in the following table.
Figure 2-1 Provincial Property Tax Rates 2011
2.3.2 Municipal Tax Rates
Municipalities have wide authority under Part 7 of the Community Charter to tax property owners. Each
municipal government provides different services and different levels of service. Also, methods of cost
recovery other than taxation such as user fees may be employed for various services.
The cost of service provision varies significantly between local governments due to factors such as
geography, climate and availability of labour, so the tax revenue required to provide the service will also
vary significantly. Some local governments have specified areas that pay different taxes than everyone
else. If these areas cover a large portion of the municipality, the tax rate is added to the municipal rate for
reporting purposes.
The Provincial Government retains the authority to intervene in municipal taxation decisions. The Lieutenant
Governor in Council, may make regulations respecting tax rates that may be established by annual property
tax bylaw, including:
(a) prescribing limits on tax rates;
(b) prescribing relationships between tax rates;
(c) prescribing formulas for calculating the limits or relationships referred to in paragraph (a) or (b);
(d) allowing the inspector under prescribed circumstances to vary, by order, a limit, relationship or formula
prescribed under this section.
7Major Industrial Property Taxation Impacts Davies Transportation Consulting Inc.
Based on data on municipal tax rates on Class 4 properties supplied by BC Ministry of Community, Sport
1
and Cultural Development , municipal tax rates levied on properties classed Major Industry during 2011
ranged from 4.8 to 92.5 per $1000 of assessed value.
3 Business Decisions and Property Taxes
An understanding of the basic theory of business behaviour is essential for understanding the role of
property taxes in business decisions. Firms are influenced in their decisions by the nature of their costs and
the markets in which they operate. The fundamental assumption in analyzing these effects is the
assumption that firms maximize profits.
Our analysis will focus on the impact of property taxes on three main types of business decisions: new
investments, on-going operations and the closure of a business line, or operating facility. We will also
identify and analyse the impact of other factors including other business costs relative to taxation levels.
Firms are faced with numerous business decisions however they can be generally classified into one of the
following two types:
• Capital Budgeting: New investment or expenditure that must be amortized because of the
accounting rules. Performance is usually assessed on the basis of discounted cash flow measures such as
Internal Rate of Return or Net Present Value. Property taxes are simply a cost input that needs to be
factored into the criteria under which the investment decision is undertaken. The larger the property tax bill
the more net cash the firm needs to produce to earn the required rate of return, to attract the capital
investment.
• Operating Decisions: Decisions on current operating parameters of existing facilities. From a
microeconomics perspective, the primary decision variable in short-term operations is the quantity and/or
price of the product. Performance indicators such as cost-volume and profit analysis techniques are used to
guide these decisions. Cost accounting in essence is similar to microeconomics. It is important to note that
for an individual firm’s behaviour the issue of resource constraints comes into play more often in cost
accounting. In British Columbia most firms compete under a commodity pricing model, where the highest
cost plant is the first plant whose operations will be curtailed.
Financial indicators can be assigned to two categories.
• Microeconomic/Cost Accounting: these are firm specific financial indicators. Comparisons
between firms even within the same industry must be done with caution.
• Financial Accounting Indicators: are standard indicators from the annual financial statements
regarding the Balance Sheet and Income Statement. These ratios are typically used for comparisons
among firms and industries. Financial accounting data is intended to make it easy to make comparisons.
Other financial indicators such as debt/equity ratios, liquidity ratios etc. may impact a firm’s ability to
execute a specific strategy but do not determine whether is it a sound business decision.
While each category of plant in the Major Industrial Property class has unique features, most share
common characteristics that are likely to influence management responses to local property taxes under
similar circumstances.
Relevant indicators related to the business decisions to be analyzed are shown below.
1
Schedule 702.
8Major Industrial Property Taxation Impacts Davies Transportation Consulting Inc.
Figure 3-1 Business Decision Making
Business Decision Making Matrix
How do property taxes influence the decision- Microeconomic/Cost Financial Accounting
making process? Accounting Indicators Indictors
Investment in New Facilities
Greenfield Entry Hurdle Rate
Merger Entry Opportunity Cost
Payback Period Proforma Projections
Return on Investment
Risk Profile of Project
Ongoing Operations & Temporary Closures
Maintain Existing Production Fixed & Variable costs Operating Profit Margin
Capital Expenditure (betterments, smaller scale) Net Profit Margin
Return on Equity
Production Levels Reduced Avoidable/unavoidable costs Return on Capital
Production Level Stopped for Indefinite Period Avoidable/unavoidable costs
Reinvestment in Existing Facilities
Capital Expenditure (betterments, larger scale) Contribution
Differential/incremental Weighted Cost of
Expansion at Existing Location costs Capital
Internal rate of Return
Economic Obsolescence
Financial Restructuring
Plant Closures
Close-down Exit Opportunity Cost Net Profit Margin
Divestiture Exit Replacement Costs
While each category of plant in the Major Industrial Property class has unique features, most share
common characteristics that are likely to influence management responses to local property taxes under
similar circumstances.
3.1 Investment in New Facilities
Typically new facilities in the Major Industry classification are capital intensive and require substantial
capital investments to bring into production. Some examples of recent investments in BC and globally
illustrate the level of investment required.
Figure 3-2 Capital Cost Examples Major Industries
9Major Industrial Property Taxation Impacts Davies Transportation Consulting Inc.
In planning these capital investments, firms take into account all fixed and variable costs to ensure that the
investment will provide an adequate return. Property tax is considered as a fixed cost, but it is generally
insignificant in relation to overall fixed costs (including capital costs).
To the degree that firms have options among different locations for their plants, differentials in tax rates in
among municipalities may have an impact on investment decisions.
Property tax is considered as a fixed cost, but it is generally not the most significant factor in relation to
overall fixed costs (including capital costs) and is therefore not a major consideration at this stage of the
plant’s existence. Typical cost structures of industries in the Major Industrial category based on Canadian
2
companies are shown below .
Figure 3-3 Major Industries Operating Expense Categories
Indirect taxes – including sales, property and excise taxes, and customs duties – account for a very small
portion of total costs. The share of indirect taxes in total costs for major industries is shown below.
2
Source: Adapted from: Statistics Canada Financial and Taxation Statistics for Enterprises 2009 Catalog
no. 61-219-X http://www.statcan.gc.ca/pub/61-219-x/61-219-x2009000-eng.htm
10Major Industrial Property Taxation Impacts Davies Transportation Consulting Inc.
Figure 3-4 Major Industries: Indirect Taxes as a Percentage of Total Expenses
It is important to recognize that analysis of new investment decisions by existing producers provides only a
partial indication of the impact of property taxes. There are no statistics on investment proposals that do not
proceed because anticipated revenues cannot cover the fixed and variable costs of the project, or the risks
are deemed to be too large. Property taxes may play a role in these decisions as well, either due to the
impact on fixed costs or the risk that taxes will increase. These effects cannot be captured in a statistical
analysis of existing investments.
3.2 Ongoing Operations and Temporary Closures
Firms are influenced in their operating decisions by the nature of their costs and markets. Most industries in
the Major Industrial Properties classification share similar cost and market characteristics.
• Most are price takers in international markets i.e. the prices received for their products are
determined by global (or regional) supply and demand conditions and individual producers cannot
substantially influence these variables.
• Most plants can minimize unit costs by operating close to their maximum capacity.
Profit-maximizing behaviour under these market and cost conditions generally results in the following
behaviour:
• Firms will operate individual plants near capacity as long as the price of their product exceeds their
variable costs. Even if they are losing money they are better off producing and selling their products as the
surplus of price over variable costs provides some contribution to their fixed costs.
• Firms with multiple production facilities will tend to operate their lowest cost plants near capacity and
temporarily close their higher cost plants.
Based on the microeconomic theory of the firm, fixed costs (including property tax costs) do not affect
decisions on output levels or on the distribution of activity among multiple facilities in the short term.
3.3 Capital Re-Investment
The life of industrial plants can be extended through expansion, investment in new technology or
replacement on the same site. The factors influencing the decision to re-invest in existing facilities are
11Major Industrial Property Taxation Impacts Davies Transportation Consulting Inc.
similar to that for investment in new plants; however incremental expansion of existing facilities may be a
cheaper alternative than a new greenfield plant, and the factors that determined the original location of the
plant may still favour production at the same location. In British Columbia over the past two decades there
has been a strong trend towards incremental investment rather than development of new plants on a
greenfield basis.
In setting tax rates, policy makers need to be cognizant of the rate of turnover. Because of high rates of
plant closures, the health of the manufacturing sector depends on the rates of renewal. On balance where
product prices escalate, the economic life of the plant is often extended. This situation is currently prevalent
in the metal and coal mining sectors in British Columbia. In general, manufacturing facilities tend to have a
3
relatively short life. The average life of manufacturing plants in Canada from 1961 to 1999 is depicted
below.
4
Figure 5-5 Average Life of Canadian Manufacturing Plants 1961 – 1999
New plants are encouraged by incentives and discouraged by disincentives. For example, the impact of a
high property tax rate that discourages new investment will be felt much more quickly in a world where
plants are constantly exiting the market place and being renewed - because a lack of ongoing investment
due to a burdensome tax environment will quickly translate into a smaller sector and fewer jobs.
Capital renewal can take place through expansion of existing facilities, greenfield entry or a merger in the
major industries. In planning these capital investments, firms take into account all fixed and variable costs
to ensure that the investment will provide an adequate return. If a community is experiencing significant
capital renewal in plant and equipment, this would tend to suggest that the overall cost structure, including
property taxes, of the firm is competitive and at a level that encourages continued economic expansion.
3
Death in the Industrial World: Plant Closures and Capital Retirement John R. Baldwin, Statistics Canada
Catalogue no. 11F0027MIE — No. 033 May 2005 p. 15.
4
Ibid., p. 12.
12Major Industrial Property Taxation Impacts Davies Transportation Consulting Inc.
The long-term impact of new investments and plant closures on employment can be assessed based on
fading and renewal rates. The fading rate is the proportion of jobs in the first year that was lost by the last
year of the period of analysis, either because of plant closures or downsizing. The renewal rate is the
proportion of jobs in the last year that is new, either because of investments in new plants or the expansion
of incumbent plants. The former is a measure of the extent to which jobs are fading away, at the level of
individual business units; the latter is a measure of the extent to which the economy is being renewed,
5
again at the level of individual business units. Fading and renewal rates for Canadian manufacturing
industries over the period from 1961 to 1999 are shown below.
Figure 5-6 Fading and Renewal Rates by Industry 1961 – 1999
These rates of fading and renewal are directly attributable to the accelerated rate at which market change is
taking place. The Powell River mill was built 100 years ago; life was simple and change was slow. In
today’s market there is no such thing as a 100 year investment horizon.
A renewal rate below the fading rate indicates a net loss of employment in an industry. The high fading and
renewal rates for most industries indicate that over the forty year period of the analysis the plants in
existence at the beginning of the period had been almost entirely replaced by new facilities by the end.
Researchers have concluded that business renewal and fading rates vary across industries because of
market structure, changes in technology and differences in underlying possibilities for entrepreneurial
activity. Industries with the lowest fading rates have economies of scale and concentrated market structure.
Entry and renewal are sensitive to economic conditions.6
If a community is not experiencing significant levels of capital renewal or reinvestment in their major
industries this suggests that all factors including property taxes must be considered as part of the reason
5
Baldwin, J., & Brown, M. (2004), Four Decades of Creative Destruction: Renewing Canada's
Manufacturing Base from 1961-1999, Statistics Canada ISBN 0-662-38274-9. p.3.
6
Ibid., p. 9.
13You can also read