Understanding Development in Winnipeg - An Informational Briefing for City Council and Winnipeg Citizens - Janice Lukes
←
→
Page content transcription
If your browser does not render page correctly, please read the page content below
Understanding Development
in Winnipeg
An Informational Briefing for City
Council and Winnipeg Citizens

                            Presented by:

 September 20, 2016                         Prepared by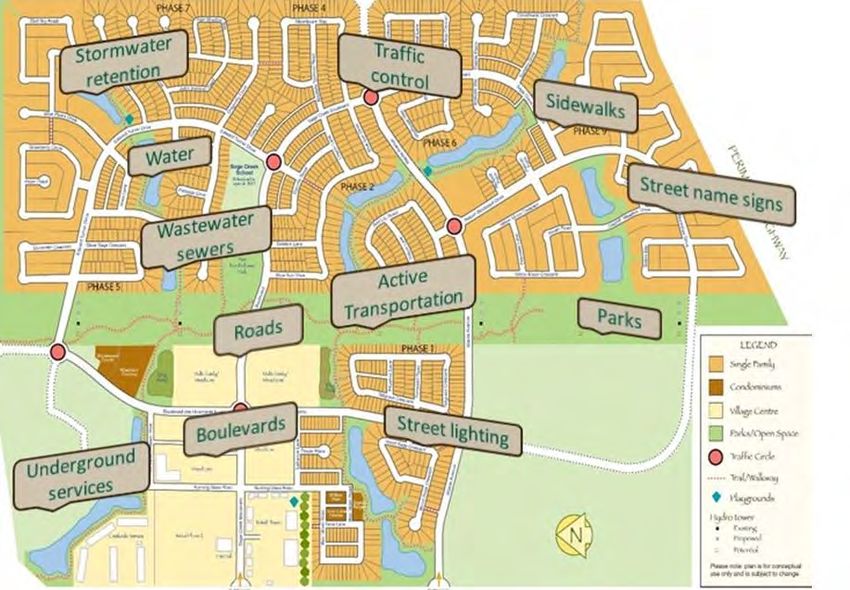
Understanding Development in Winnipeg

Contents

1.   Executive Summary .................................................................................................................. i
         State of Winnipeg’s Infrastructure ...................................................................................... i
         Current Development Agreement Parameters Process ......................................................ii
         The Overarching Vision for Winnipeg .................................................................................iii
         The Value of New Development .........................................................................................iii
         Comparison to Neighbouring Municipalities ......................................................................iv
         Growth Assumptions ...........................................................................................................v
         Capital Project Assumptions ...............................................................................................vi
         Other Jurisdictional Practices ............................................................................................ vii
                Determination of Costs ............................................................................................... vii
                Stakeholder Engagement............................................................................................ vii
                Attribution to Growth ................................................................................................. vii
                Accountability and Transparency .............................................................................. viii
         Authority ........................................................................................................................... viii
2.   Introduction and Background ................................................................................................. 1
         About UDI / MHBA .............................................................................................................. 1
         Purpose of This Report........................................................................................................ 2
         Why It’s Important .............................................................................................................. 3
3.   Context .................................................................................................................................... 4
         State of Winnipeg Infrastructure ........................................................................................ 4
         City of Winnipeg Financial Situation ................................................................................... 5
         Historic and Projected Growth ......................................................................................... 11
                Population .................................................................................................................. 11
                Employment............................................................................................................... 12
                Housing Market ......................................................................................................... 14
                Commercial and Industrial Market ............................................................................ 15
4.   Current Planning Environment ............................................................................................. 17
         Municipal Authority .......................................................................................................... 17

Prepared by MNP LLP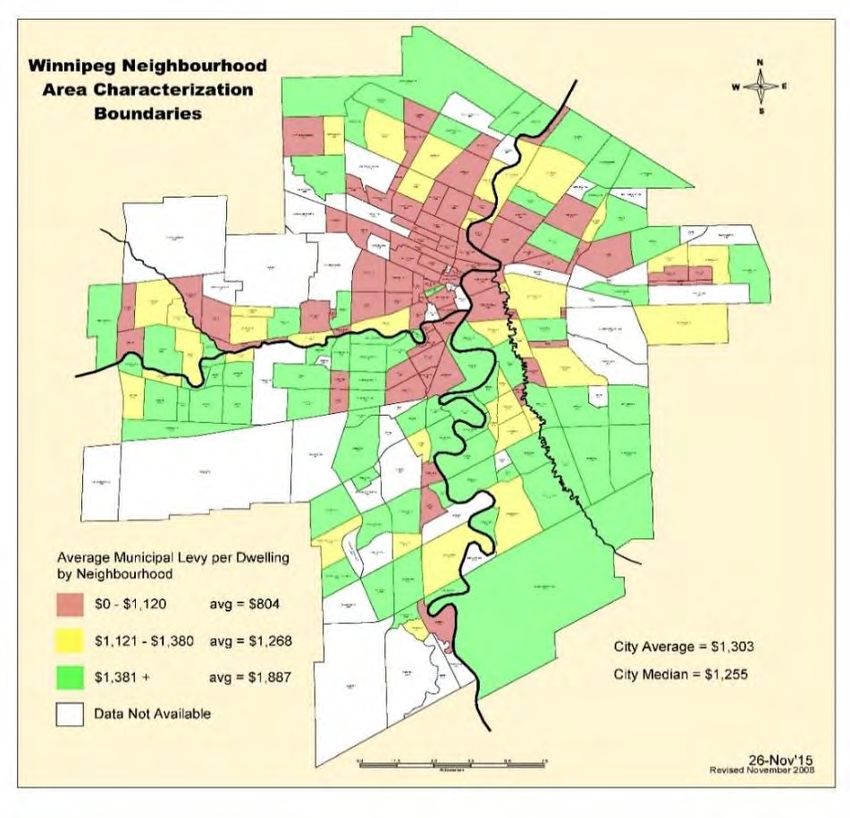
Understanding Development in Winnipeg

         Municipal Plans ................................................................................................................. 19
               OurWinnipeg .............................................................................................................. 19
               Complete Communities ............................................................................................. 19
               Urban Sprawl vs Smart Growth (CaRDI , 2016) ......................................................... 23
               Sustainable Transportation ....................................................................................... 24
               Other Infrastructure Plans ......................................................................................... 25
         City of Winnipeg Development Process ........................................................................... 25
         Development Agreement Parameters .............................................................................. 27
5.   Value of Development to Winnipeg ...................................................................................... 30
         Economic Impact of Home Construction .......................................................................... 31
         How New Development Pays for Its Impacts ................................................................... 31
               Direct Investment ...................................................................................................... 31
               Assessment Contribution of New Homes .................................................................. 32
               Cost Benefit Studies ................................................................................................... 34
6.   Other Jurisdictions................................................................................................................. 35
         Considerations when Comparing Winnipeg to Other Jurisdictions.................................. 35
         Recognized Practices for Attributing Costs of Growth ..................................................... 36
               Planning and Background Study Requirements ........................................................ 36
               Meaningful Stakeholder Engagement and Collaboration ......................................... 37
               Benefit........................................................................................................................ 38
               Limitations on Development Charges ....................................................................... 39
               Accountability and Transparency Mechanisms ......................................................... 39
         Capital Region Municipalities ........................................................................................... 40
               Contributing Factors for Development Cost Charges in Small Municipalities .......... 41
7.   Concerns with the 2016 Growth Study ................................................................................. 44
         Growth Projections ........................................................................................................... 44
         Identification of Costs ....................................................................................................... 45
               Projects Not Approved or Listed Above Approved Costs .......................................... 45
               Projects Previously Completed .................................................................................. 47
               Lack of Planning and Technical Rigour to Fairly Attribute Costs ............................... 48
               Disregard of Winnipeg’s Utility Model ...................................................................... 49

Prepared by MNP LLP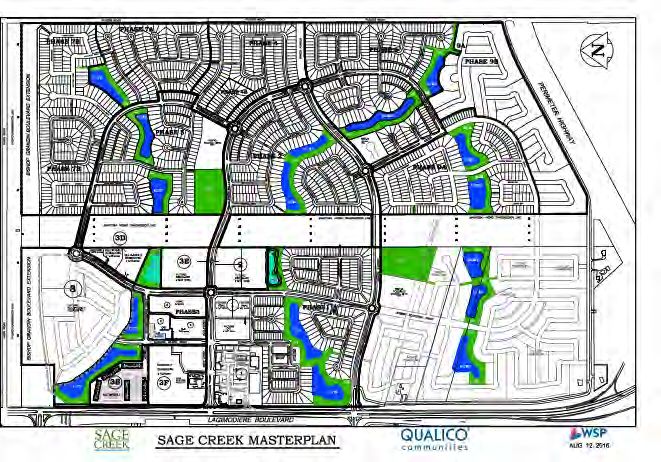
Understanding Development in Winnipeg
Process .............................................................................................................................. 49
Impact ............................................................................................................................... 51
Vision for Winnipeg ................................................................................................... 51
Loss of Development to Surrounding Communities ................................................. 52
8. Concerns with the Proposed By-Law..................................................................................... 52
Fairness and Equitable Application of Fees ............................................................... 52
Accountability and Transparency .............................................................................. 53
Authority .................................................................................................................... 54
9. The Path Forward .................................................................................................................. 54
Collaborative Process ........................................................................................................ 54
Sound Principles and Analysis ........................................................................................... 55
Effective City Planning, Fair Allocation ...................................................................... 55
Clear, Consistent Policy; Accountability and Transparency ...................................... 55
Next Steps to Long Term Sound Solutions ........................................................................ 55
10. References ............................................................................................................................. 56
Appendix A: Sources of City Revenues ........................................................................................ 62
Other Revenue Sources .................................................................................................... 63
Appendix B – Winnipeg Development Agreement Parameters ................................................... 64
Appendix C – Other Jurisdictions .................................................................................................. 68
British Columbia Local Government Act .................................................................... 68
Saskatchewan Planning Act ....................................................................................... 68
Alberta Municipal Government Act ........................................................................... 69
Ontario Development Charges Act ............................................................................ 69
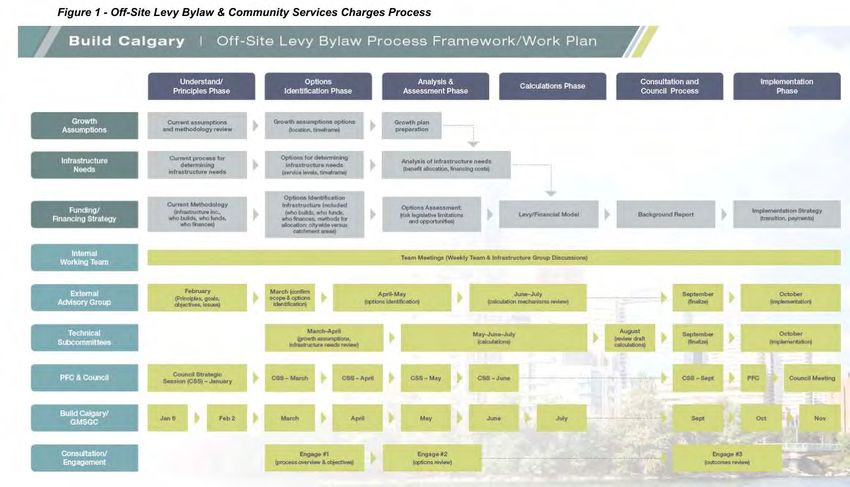
Example of Consultation Process (City of Calgary, 2015) .......................................... 71
Examples of Project Cost Detail ................................................................................. 73
Appendix D – Other Capital Region Municipalities....................................................................... 74
Appendix E - Comparative Prices for New Homes–Winnipeg and CMA Communities ................ 77
Prepared by MNP LLP
Understanding Development in Winnipeg

Table of Figures
Figure 1 Property Tax Changes in Cities (City of Winnipeg, 2016). ................................................ 5
Figure 2 City of Winnipeg Taxation, Service & Regulatory Revenue, 2007-2015 .......................... 6
Figure 3 Per Capita Revenue Comparison ..................................................................................... 6
Figure 4 City of Winnipeg Revenue and Expenses ......................................................................... 7
Figure 5 City of Winnipeg Accumulated Surplus............................................................................ 7
Figure 6 City of Winnipeg Capital Investment ................................................................................ 8
Figure 7 Capital Spending Per Capita Comparison ......................................................................... 8
Figure 8 City of Winnipeg Capital Reserve, 2007-2015 ................................................................. 9
Figure 9 Winnipeg Census Metropolitan Area (CMA) .................................................................. 11
Figure 10 Annual Population Growth Rate .................................................................................. 11
Figure 11 Sources of Migration .................................................................................................... 12
Figure 12 Winnipeg CMA Employment ........................................................................................ 13
Figure 13 Employment Outlook 2016-2020................................................................................. 13
Figure 14 Population Growth and Housing Starts ........................................................................ 14
Figure 15 Rental Vacancy Rate..................................................................................................... 14
Figure 16 Complete and Unsold Housing Inventory .................................................................... 15
Figure 17 Evidence of Problematic Conditions (CMHC, Q2 2016) ............................................... 15
Figure 18 Commercial Real Estate Inventory, 2015 ..................................................................... 16
Figure 19 Recent Communities .................................................................................................... 20
Figure 20 New Communities (City of Winnipeg, 2011) ............................................................... 20
Figure 21 Density of Areas of Winnipeg ....................................................................................... 21
Figure 22 Sage Creek Master Plan ................................................................................................ 22
Figure 23 Sage Creek Medium Density Homes ............................................................................ 22
Figure 24 City of Winnipeg Secondary Plans ............................................................................... 25
Figure 25 Waverley West Approval Process ................................................................................ 27
Figure 26 Infrastructure Built by Developers, Paid for by New Home and Commercial Property
Buyers ........................................................................................................................................... 32
Figure 27 Municipal levies by neighbourhood ............................................................................. 33
Figure 28 New Housing and Consumer Price Indexes .................................................................. 34
Figure 29 Cost Benefit Study Approach ........................................................................................ 34
Figure 30 Capital Region Municipalities Development Charges ................................................... 42
Figure 31 Comparison of New Homes .......................................................................................... 43
Figure 32: Winnipeg CMA Community Averages.......................................................................... 43
Figure 33 Growth in Non-Residential Space ................................................................................. 44
Figure 34 Comparison of Roads Project Costing........................................................................... 46
Figure 35 Comparison of Transit Project Costing ......................................................................... 47
Figure 36 Development Cost Charge Detail – BC Best Practice Guide [EXAMPLE] ...................... 73

Prepared by MNP LLP
Understanding Development in Winnipeg
1. Executive Summary
The City of Winnipeg is exploring new mechanisms for funding infrastructure deficits and impacts
of growth. In the spring of 2016, the City commissioned a study to identify options, determine
development-related costs and revenues, and define a growth financing model and
implementation framework. The study, completed by Toronto-based Hemson Consulting (the
Hemson Report), was released to the public on September 1, 2016. The Hemson Report
recommended development charges for residential, office, commercial/retail, institutional and
industrial development. On Friday September 16, 2016, the City of Winnipeg put forward a
proposed by-law to introduce ‘impact fees’ on the Executive Policy Committee agenda. If
approved, the by-law would come into force January 1, 2017. The administrative report that
accompanied this item included recommended fees for each type of development. The
administrative report also recommends the Chief Financial Officer be provided the authority to
determine how the fees collected through this scheme will be used.
The development industry has a long history of working with the City of Winnipeg to build new
communities. This has included extensive work in planning these communities, determining the
measureable impacts of the development, and negotiating developer and City responsibilities for
the costs. It is in the context of this relationship, and a sincere interest in a strong, sustainable
Winnipeg, that this report is offered.
Residential and commercial developers and Manitoba home builders are very concerned about
the proposed development financing mechanism because:
There was no true stakeholder engagement on principles, impacts or attribution of
costs through what became a rushed process;
The capital project costs that are the basis for calculating the proposed fees appear to
be significantly inflated, are not supported by detailed infrastructure plans, include
projects that have not been approved by Council, and include projects already
completed and in use since in 2009; and
There is no clear explanation of the basis on which costs have been attributed to
growth, how benefit was determined, or how this relates to who pays.
State of Winnipeg’s Infrastructure
The Hemson Report put forward an argument that development is not paying for new
development, because Winnipeg does not have a development charge system. The report does
not consider the net new revenues from property taxes from new development or other reasons
for under-funded infrastructure.
i
Prepared by MNP LLP
Understanding Development in Winnipeg

 In the 1990’s, a lack of growth in the city and decisions to spend money on operations instead
of capital led to a serious infrastructure deficit. In 2009, the City of Winnipeg estimated that ‘the
added investment required to maintain infrastructure assets at appropriate service levels and in
a good state of repair’ was $3.8 billion for existing infrastructure and $3.6 billion for ‘new
strategic’ infrastructure. For both types of infrastructure, approximately half was to maintain at
current (2008) condition and half was to “raise the average condition to appropriate asset
management condition”. A significant amount of the investment identified as strategic new
infrastructure is really ‘catch up’ needed to service the City as it exists today. For example,
bringing wastewater treatment plants up to modern standards is included in new infrastructure.
The City has previously stated these treatment plants had existing, sufficient capacity to service
not only growth in the city, but also in neighbouring municipalities, and were already included in
rate plans.

Current Development Agreement Parameters Process
The City of Winnipeg Charter requires an owner seeking approval of a subdivision to enter into a
development agreement. The City of Winnipeg and the development community negotiated
Development Agreement Parameters that were adopted by City Council in July 2002. The existing
development agreement parameters, that have been in existence for 15 years, address land
acquisition and dedication, services and improvement, maintenance,
compliance and general administration and finance. Developers are            Developers
required to transfer land to the City for various purposes and to         have built over
construct various types of municipal services that become part of the      $630 million in
City’s infrastructure. Currently, developers pay 100% of the costs          infrastructure
within the development and the costs of identified impacts outside        since 2007 that
the development (e.g. adjacent roads, nearby intersections). The City     are now City of
has recorded over $630 million in this private sector investment over    Winnipeg assets.
a 9 year period.
In December 2015, the City and the development community agreed to discuss improvements to
the Development Agreement Parameters. A schedule of meetings was agreed to begin in the
winter of 2016. Instead, the City deferred these discussions, electing instead to undertake a
study into alternative financing mechanisms. The Urban Development Institute and the Manitoba
Home Builders Association offered to contribute to the cost of a comprehensive study that would
form the basis for new agreement parameters. The City declined, choosing to pursue the study
independently through the Finance department, without industry engagement.
UDI and MHBA want to return to discussions, with all relevant departments, of how costs of
development should be funded through the Development Agreement Parameters process. They
are seeking a process that incorporates detailed plans for infrastructure development; objective
analysis based on reasonable costing at the level of detail that ensures fair attribution; clear,
consistent policy; transparency and accountability of both the City of Winnipeg and the

                                                                                                        ii
Prepared by MNP LLP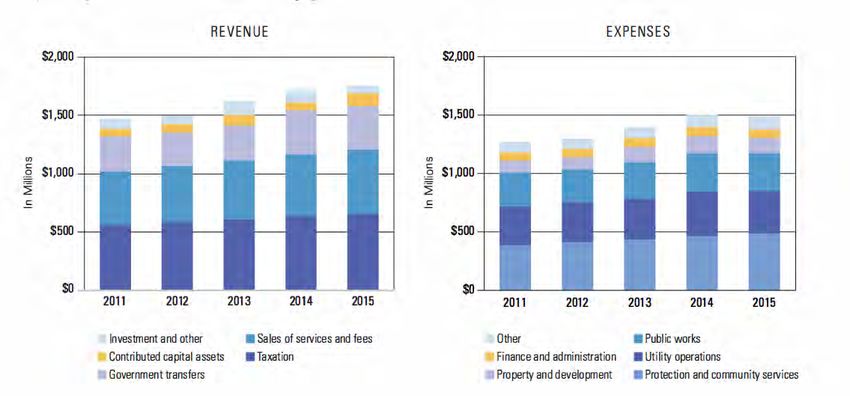
Understanding Development in Winnipeg

development community; and dedicated reserves that ensure the funds collected to pay for the
impacts of new development are spent to execute those projects.

     The Urban Development Institute and the Manitoba Home Builders
 Association want to return to discussions of how cost of development should
    be funded through the Development Agreement Parameters process

The Overarching Vision for Winnipeg
Modern, thriving cities provide their citizens and future citizens with choice of where they want
to live -- reflective of their needs and wants at different stages of their lives. OurWinnipeg was
developed after extensive consultation and establishes the City of Winnipeg’s vision for the next
25 years. It focuses on three key directions -- a city that works, sustainability and quality of life.
These directions are intended to address questions such as how growth and change will be
accommodated while making sure the city stays liveable, affordable and desirable.
                           Complete Communities is one of the four Direction Strategies
          The             supporting OurWinnipeg. It is intended to guide Winnipeg’s physical
   development            growth and development by introducing a new urban structure.
  community has           Complete Communities states that new development should only be
  fully embraced          approved when a full range of municipal services can be provided in an
   SMART Growth           environmentally sound, economical and timely manner; there is a
   principles and         reasonable relationship between the supply of land and the projected
     the vision of        demand; new development is adjacent to and compatible with existing
      Complete            development, and is designed to minimize the spatial use of land. Some
    Communities           have referred to recent growth in Winnipeg as “urban sprawl”. Urban
                          sprawl generally includes low density, homogenous, single use
developments disconnected from the existing development. This is not a true characterization
of recent development in Winnipeg. Recognized principles for Smart Growth include mixed land
use, a range of housing opportunities and choice, walkable neighborhoods, distinctive, attractive
communities with a strong sense of place. Recent developments such as Waverley West and
Sage Creek are clear examples of modern, complete communities designed with Smart Growth
principles and the Complete Communities vision.

The Value of New Development
New development expands the number and value of properties, enabling the city to grow its
assessment base. This revenue is crucial to support the services of a modern city. Without new
development, the existing tax base must pay higher taxes as the costs of delivering municipal
services rise, along with the backlog of needed investments in infrastructure renewal to meet

                                                                                                         iii
Prepared by MNP LLP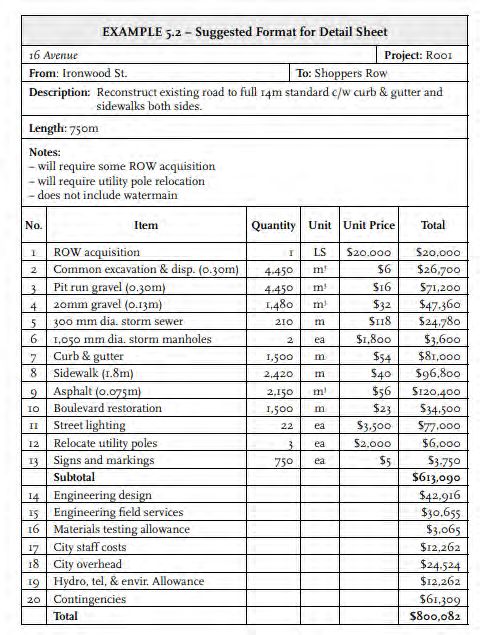
Understanding Development in Winnipeg
modern regulatory standards and citizens’ expectations. New development also provides
modern infrastructure that costs less to maintain and provides the capacity and appeal necessary
to support and attract population growth.
Without new development the existing tax payer will pay higher taxes for:
Rising costs of delivery of municipal services
Infrastructure renewal to meet modern service requirements and
regulatory standards
Once lots are sold and new homes constructed, homeowners pay property taxes on the assessed
value of the property. New homes are generally assessed at a much higher value than the
‘average home’ in Winnipeg and thus contribute a larger share of municipal revenue than the
average home. Winnipeg has the oldest housing stock in western
Canada and the 3rd oldest housing stock of major cities in Canada which
New homes
contributes to lower assessed values. This explains, in part, why average
contribute a
property taxes in Winnipeg appear low compared to other cities.
larger share
Assessed values, and thus property taxes, vary significantly by
of municipal
neighborhood. The average municipal levy per dwelling in Winnipeg was
revenue than
$1,303 in 2015. In 2013, an average new single detached home paid over
the average
$2,900 in property taxes and frontage levies, 2.2 times the amount paid
home
by the ‘average home’.
New homes built from 2006- 2015 are estimated to have contributed
about $200 million in new assessment revenue, and will continue to Waverley West
add over $33 million to city coffers per year. These new homes also will provide the
pay frontage levies, waste diversion fees, and utility rates for water city with $892
and sewer. New businesses in commercial developments also pay the million net
business tax. revenue after
Cost benefit studies required by the City of Winnipeg as part of the paying all
development approval process have repeatedly shown the net capital,
benefits of these new developments to Winnipeg. Waverley West is operating and
estimated to provide the city with $892 million (NPV of $250 million) maintenance
net revenue, after paying all capital, operating and maintenance costs
costs.
Comparison to Neighbouring Municipalities
A new home is for most people the most significant investment a family will make. This is also
true of facilities built for business owners. Cost is an important consideration to individuals,
iv
Prepared by MNP LLP
Understanding Development in Winnipeg

businesses and families. Homebuyers and new businesses are price and value sensitive and can
be highly mobile in these decisions.
As the total cost of ownership increases in one area, new homebuyers will look to another. There
are many attractive areas in the CMA surrounding the city that provide these alternatives within
an easy commute. While there are development charges in Manitoba municipalities outside of
Winnipeg, homeowners consider the total cost of buying and operating a new home. A sample
of active listings of to-be or just built homes indicates that the cost per square foot of the homes
in Winnipeg averaged over 10% higher than comparable homes (3
bedroom, two bath under $400,000) in surrounding municipalities. The
                                                                                    Surrounding
average selling price for the Winnipeg homes averaged over $16,000
                                                                                   municipalities
higher, for smaller homes, and smaller lots. Property taxes for CMA
                                                                                  are growing at
municipalities also average 1/3 less than in Winnipeg. The combination
                                                                                    over two (2)
of these factors lead many new home purchasers to perceive greater
                                                                                  times the rate
value in neighboring municipalities, even with the current charges.
                                                                                   of Winnipeg.
Surrounding municipalities are growing at double the rate of Winnipeg.
                                                                                      This new
If new homebuyers choose to build a home outside the city, the related
                                                                                     assessment
new assessment revenue is lost. These individuals and families then use
Winnipeg roads, parks and other amenities without providing the taxes             revenue is lost
                                                                                    to Winnipeg
that support their maintenance. An additional tax on a new home in
Winnipeg will drive more people to the surrounding municipalities.

Growth Assumptions
Underpinning the calculation of the development taxes proposed
in the Hemson Report are population and employment forecasts.               If the assumptions
Winnipeg grew at an average annual rate of .086% from 2001 to                  are wrong, the
                          2015. The Census Metropolitan Area                    numbers are
      The Census          outside of Winnipeg grew at 1.78% over              wrong and the
     Metropolitan         the same period, over two times the rate            fees are wrong
     Area outside         inside the city. The forecast to 2040
      of Winnipeg         shows a similar trend where growth in the areas surrounding Winnipeg
     grew at over         (77%) is expected to be more than two times the growth rate inside
     two times the        the city (28%). International immigration is the major contributor to
    rate inside the       population growth in Winnipeg. Although it is expected that Winnipeg
          city            will benefit from continued international migration, caution is
                          warranted. While Winnipeg is the seventh largest city in Canada in
                    nd
2006, it ranked 22 in attractiveness to migrants in the Conference Board of Canada’s
benchmarking report (2010). Employment growth is projected at 1.1% for 2015, down from a 20
year high of 3.4% in 2015. The Conference Board of Canada’s employment outlook indicates
growth will continue to be the highest in the service sectors in the next five years.

                                                                                                       v
Prepared by MNP LLP
Understanding Development in Winnipeg
The City of Winnipeg forecasts an average of 4,000 new housing starts per year, although this
level of housing start has only been seen in two out of the last 20 years. The Hemson Report has
forecast an average of 4,200 housing units per year for the next ten years. Rental vacancy rates
have now increased to 3% from 1% and are expected to rise as new units under construction are
introduced to the market. According to CMHC’s Housing Market Assessment, complete and
unsold multi-family units remain elevated and are at the threshold of overbuilding. The CMHC
Spring Housing Market Outlook for Winnipeg CMA forecasts total housing starts below the levels
of the last three years. For the entire CMA, the forecast for 2017-2018 housing starts is 3,600
compared to 4,200 in 2016. The rate of building in the other municipalities has been two times
the rate of growth in the city and will absorb some of this demand. Developers in Winnipeg
confirm market conditions in Winnipeg have somewhat cooled. Many have not increased lot
prices for two or more years and have needed to offer incentives to encourage lot sales. While
everyone hopes that the population grows at the rate projected in the study and this translates
into greater housing starts, actual growth may be more modest.
Capital Project Assumptions
A second key component in the calculation of the new charge is the
identification of capital costs associated with projects considered related Many of
to development. This data is based on information provided to Hemson these
by the City of Winnipeg. Hemson refers to them in their report as projects are
“development-related projects and their gross and net costs.” It is not not included
clear what criteria was used to determine what was ‘development in sufficiently
related’. The projects and their costing were not independently detailed
validated by the consultant. Hemson has stated that the “development plans and
related capital forecast ensures that regulatory fees are only imposed to cannot be
help pay for projects that have been or are intended to be purchased or reliably and
built in order to accommodate future anticipated development”. An accurately
initial analysis finds that: costed
Many projects are not included in sufficiently detailed plans to
enable reliable and accurate costing
Many projects are listed at amounts far above the amount in approved budgets or plans
Many projects are not included in capital budgets or master plans and have not been
approved by Council
Several projects have already been completed, with any additions to capacity unclear.
The methodology deducts grants and contributions from other levels of government and the
“portion of the project that may confer benefits to existing residents”. It is unclear how the
relative demand from growth and related benefit has been determined.
vi
Prepared by MNP LLPUnderstanding Development in Winnipeg
The City of Winnipeg has repeatedly said that those who benefit from growth should pay for the
impacts of this growth. What the actual impacts are of growth and who benefits is at the crux of
this issue. Although it could be argued that all Winnipeggers benefit from ongoing growth and
development, the methodology employed by Hemson Consulting (citywide average), results in
anyone purchasing new homes or opening new businesses regardless of where in the city will
pay for all estimated costs attributed to growth regardless of where the development is in the
city. For example, homeowners in the north east of the city will pay for investments in the south
west. While the vice versa applies, the related investments are not necessarily equal.
Other Jurisdictional Practices
The City of Winnipeg has repeatedly referenced development charges in other major cities and
surrounding Manitoba municipalities as justification for the imposition in Winnipeg. Every
municipality has its own unique characteristics, including the provincial legislation and
regulatory scheme, physical geography, social and economic environment, extent and
condition of existing infrastructure, and growth characteristics. While the general mechanisms
to generate revenue are similar, municipalities may employ them in different ways or with
different emphasis. There may be different policy considerations or goals that the municipality is
trying to achieve. In all cases, understanding what underlies another city’s policy, budgets or
costs, and how they are affected by timing, reporting and other considerations is important to
make a fair comparison. The practices in British Columbia, Alberta, Saskatchewan and Ontario
were reviewed to understand what may be learned from the experience in these other
jurisdictions. While there are significant differences in the ‘basket of services’ included in the
costing and the amounts charged, there are common principles that may be found where systems
have been established to recover capital costs from new developments.
Determination of Costs
In all cases, the fundamental premise of a development levy is that costs charged to new
development must be related to the development. Determining the amount of the levy begins
with a clear understanding of what these costs are, and how they are connected to the
development, generally through detailed infrastructure planning.
Stakeholder Engagement
Methods for involving the public in the decision making process in other provinces included
external advisory groups and general provisions for a meaningful public process to obtain input
on the proposed changes. Methods implemented include opportunities for municipal
departments, local developers and the public to review and contribute their opinions.
Attribution to Growth
The concept of those who benefit should pay is reflected in all reviewed jurisdictions. Other
jurisdictions include some parameters for what may reasonably be attributed to new growth.
vii
Prepared by MNP LLPUnderstanding Development in Winnipeg
Accountability and Transparency
Attributing cost and collecting levies is only one part of the necessary system of development
levies. Establishing the administrative structures to ensure the funds collected are clearly spent
for the purpose which they are collected, returned when warranted, and clear public
accountability and reporting are also key elements that are required in Acts, Regulations and By-
laws of other jurisdictions. In every province examined, development charges must be used only
for the projects outlined in the DCC program. In most cases this involves segregated special
reserves for each purpose, with separate accounting and reporting on their use.
Authority
The City of Winnipeg only has the legal authority that it is granted by
The City of the Province of Manitoba through The City of Winnipeg Charter Act
Winnipeg does (The Charter). The Charter sets out a development approval process
not have the that places clear limits on what costs, fees and charges the City of
legal authority to Winnipeg may impose on new developments.
implement The Hemson Report does not address the question of whether the
broad-based City of Winnipeg has the authority to impose regulatory charges,
impact fees levies or fees. In a similar study conducted by Hemson for the City of
Saskatoon, Hemson commented that The Charter does not provide
the City of Winnipeg the authority to implement development
charges. The City itself has previously come to this conclusion.
The proposed by-law states its authority is found in the general authority of the City under
subsection 6(1) of The City of Winnipeg Charter Act. It does not acknowledge the more specific
direction of The Charter under Part 6 - Planning and Development, or subsection 259(1) which is
quite specific on the matter. Use of the General Authority when specific authority has been
clearly contemplated and subsequently restricted is an unreasonable use of this general
authority, and could be considered an attempt to subvert the authority of the Act.
The City of Winnipeg has not completed planning at the level of detail necessary to accurately
and reliably determine which projects are required because of new development or what costs
should be attributed to new development. This lack of rigour and detail undermines the validity
of any regulatory scheme.
Winnipeg requires detailed and approved plans before it can
properly state what infrastructure needs to be built and what
should be attributed to new development
viii
Prepared by MNP LLPUnderstanding Development in Winnipeg
2. Introduction and Background
The City of Winnipeg is exploring new mechanisms for funding infrastructure deficits and impacts
of growth. In the spring of 2016, the City commissioned a study to identify options, determine
development-related costs and revenues, and define a growth financing model and
implementation framework. The study, completed by Toronto-based Hemson Consulting (the
Hemson Report), was released to the public on September 1, 2016. The Hemson Report
recommended development charges for residential, office, commercial/retail, institutional and
industrial development. On Friday September 16, 2016, the City of Winnipeg put forward a
proposed by-law to introduce ‘impact fees’ on the Executive Policy Committee agenda. If
approved, the by-law would come into force January 1, 2017. The administrative report that
accompanied this item included recommended fees for each type of development. The
administrative report also recommends the Chief Financial Officer be provided the authority to
determine how the fees collected through this scheme will be used.
Mayor Bowman has stated on numerous occasions that “growth does not pay for growth” and in
his February 2016 State of the City address, indicated “It’s a choice of higher property taxes for
all, or higher property prices for some” (Keele, 2016). This implies that new development is the
only aspect of growth and that new development does not already pay for impacts of these
developments.
The Winnipeg development community wants to ensure any decisions about growth financing
mechanisms are fully informed about the actual revenue and costs of development, and the
impact poorly constructed fees will have on future growth and City of Winnipeg revenue.
The development community in Winnipeg recognizes their responsibility for the capital costs of
the new communities they build, guided by the vision of OurWinnipeg and Complete
Communities. This may also include off-site infrastructure where there are measurable impacts
from this development. The development community is seeking enhancements to the
development agreement parameters and willingly participated in the Ad Hoc Committee
established by City Council in December 2015. Unfortunately, these meetings were stopped in
favour of the above-mentioned study. The development community welcomes the opportunity
to return to these discussions. This type of collaborative process is critical to future, sustainable
growth in Winnipeg.
About UDI / MHBA
The Urban Development Institute (UDI) is a national non-profit association representing the
development industry across Canada. The Urban Development Institute (Manitoba Division) is
the voice of the land development industry in Manitoba. Established in 1962, it was formed to
promote:
1
Prepared by MNP LLPUnderstanding Development in Winnipeg
˗ Well-planned communities by encouraging the reasonable and unselfish use of land for
residential, public, commercial and industrial purposes;
˗ Efficiency and a high standard of ethics among persons, firms and corporations engaged
in the business of land assembly and development; and
˗ Pleasant and efficient relationships between persons, firms, corporations and municipal
planning and other governmental authorities and agencies.
UDI Manitoba’s membership consists of a broad cross section of commercial, industrial and
residential developers and associated professionals. The members include development
companies and professionals involved in the industry such as engineers, architects, surveyors and
planners. UDI’s membership nationwide stands at over 1,000 companies, with chapters in British
Columbia, Alberta, Manitoba, Ontario, Quebec and the Maritimes.
The Manitoba Home Builders Association (MHBA) is a non-profit trade association whose
mandate is to provide members, the public and all levels of government with ongoing education
and information about the housing industry in our province. As the voice of the residential
construction industry in Manitoba since 1937, MHBA is committed to promoting affordability and
choice of housing for all Manitobans. They ensure members are always up-to-date on the latest
developments, building techniques and government regulations so homebuyers know they’re
getting the very best in craftsmanship and quality. MHBA is a member of the Canadian Home
Builder’s Association, ‘the voice of Canada’s residential construction industry’ since 1943, with a
membership of over 8,500 companies.
Purpose of This Report
This report is intended to provide the decision-makers at the
This report is intended City of Winnipeg and concerned citizens with objective,
to provide objective, balanced and well-supported information about
balanced and well- development funding and an understanding of the
supported information significant risks to our city of a poorly constructed growth
about development financing scheme. It provides information on historical and
funding and an current development in Winnipeg, including why it is
understanding of the important, how it is planned, and the respective
significant risks to our responsibilities of developers and the City of Winnipeg. It
city of a poorly includes a review of accepted principles and lessons from
constructed growth other jurisdictions that are critical to effective public policy.
financing scheme. The report also includes a recommended path forward, with
the development community and the City of Winnipeg
working together to ensure sound solutions that truly support the long-term best interests of our
city.
2
Prepared by MNP LLPUnderstanding Development in Winnipeg
Why It’s Important
New development expands the number and value of properties, enabling the City to grow its
assessment base. This revenue is critical in supporting the services of a modern city. Without new
development, the existing tax base must pay higher taxes as the costs of delivering municipal
services rise, along with the backlog of needed investments in infrastructure renewal, to meet
modern regulatory standards and citizens’ expectations. New development also provides
modern infrastructure and appeal, and is necessary to support and attract population growth.
A new home is, for most people, the most significant investment a family will make. Cost is an
important consideration to these families. The City itself has acknowledged that new home
buyers consider this important financial decision carefully.
“One of the most important financial decisions a Winnipegger can make is
whether to purchase and own a house. For younger individuals,
homeownership may be a financial challenge, tying up a larger share of
disposable income. For older Winnipeggers, ownership of a home is viewed as
an implicit source of income; equity held in reserve that may be liquidated and
used as income” (City of Winnipeg, 2016)
Homebuyers are thus price and value sensitive and can be highly mobile in these decisions. As
costs increase in one area, new homebuyers will look to another. In the case of Winnipeg, there
are many attractive areas in the Capital Region surrounding the city that provide these
alternatives within an easy commute. If new home buyers choose a home outside the city, the
new assessment revenue is lost to the city.
The private sector makes significant long-term investments that ultimately result in new
communities. This includes purchase of the land, engineering and design of new subdivisions,
shepherding applications through the comprehensive processes of approval, and building the
actual infrastructure to service the subdivision. These investments are often carried for many
years before revenue is earned from the sale of serviced lots. The developer must consider the
risks associated with how long the process will take, and whether the lots will sell quickly at the
price needed to warrant the investment. If this does not appear to be the case, the investment
will be deferred until market conditions improve, or will be moved to where conditions are more
favourable. Given the length of time for a new development, these decisions could result in
growth being delayed for many years.
Municipal policies that unreasonably increase the regulatory cost burden will slow growth and
reduce the amount of new assessment revenue available to the city. Housing starts are a key
economic indicator and this may have a snowball effect in other investment decisions, further
slowing growth.
3
Prepared by MNP LLPUnderstanding Development in Winnipeg
Existing taxpayers will need to pay more as a result. The development community supports a fair,
transparent, accountable development framework that will enable growth and new revenue.
This requires careful consideration.
A long term public policy solution that enables
growth and new revenue requires careful
consideration.
3. Context
State of Winnipeg Infrastructure
In the 1990’s, a lack of growth in the city and decisions to spend money on operations instead of
capital led to a serious infrastructure deficit.
Possible funding that could have been used for capital was used Past decisions to
to balance the operating budget. With the debt being paid divert funds from
down, the freed up interest payments were used to fund infrastructure
operations instead of increasing capital spending. The investment have
increased GST exemption was [also] used to fund operations led to current
(City of Winnipeg, 2009). deficits.
In 2009, the City estimated that ‘the added investment required to maintain [infrastructure
assets] at appropriate service levels and in a good state of repair’ was $3.8 billion for existing
infrastructure, and $3.6 billion for ‘new strategic’ infrastructure. For both types of infrastructure,
approximately half was to maintain at current (2008) condition, and half was to “raise the
average condition to appropriate asset management condition” (City of Winnipeg, 2009). By
definition, using the criteria of who benefits, all Winnipeg property owners should be
contributing.
A significant amount of the investment identified as strategic new infrastructure is ‘catch up’
needed to service the City as it exists today. For example, over 40% of ‘new strategic
infrastructure’ was identified as related to regional roads, a longstanding problem --
“…all of the traffic typically handled by [a] fourth level of streets in the road
hierarchy in other cities is handled by the arterial street system in Winnipeg….
Despite relatively modest population growth, this has resulted in ever
4
Prepared by MNP LLPUnderstanding Development in Winnipeg
increasing pressure on the arterial street system by both commuters and
commercial development over the past 30 years” – Sustainable Transportation
(City of Winnipeg, 2011)
Bringing wastewater treatment plants up to modern standards is also included in “new”
infrastructure. The City has previously stated these treatment plants had existing, sufficient
capacity to service not only growth in the city, but also in neighbouring municipalities.
While there are investments that may be reasonably attributed to growth, the
level of planning detail necessary to understand the purpose of an
investment, the relative demand from existing and new growth, the
associated commitment to proceed, and timing of the investment is not in
place to fairly attribute infrastructure costs to new growth.
City of Winnipeg Financial Situation
The 2016 Budget Highlights compare property tax changes in Winnipeg with a number of other
cities. The chart, as shown below, indicates that the City of Winnipeg increased property taxes at
a much lower level than comparative cities, totalling only 6.7% from 1999 to 2015.
Figure 1 Property Tax Changes in Cities (City of Winnipeg, 2016).
According to the City’s financial statements, combined revenue from taxation, service and
regulatory fees have increased by 34.5% over the past 9 years.
5
Prepared by MNP LLPUnderstanding Development in Winnipeg
Figure 2 City of Winnipeg Taxation, Service & Regulatory Revenue, 2007-2015
Revenue Taxation, Service & Regulatory Revenue
from 1,400,000
taxation, 1,200,000
service and 1,000,000
regulatory 800,000
fees 600,000
increased 400,000
by 34.5% 200,000
between -
2007 and 2007 2008 2009 2010 2011 2012 2013 2014 2015
2015 Taxation Services and Regulatory Revenue
Source: City of Winnipeg Annual Financial Reports
A comparison of revenue per capita indicates that Winnipeg collects significantly less tax revenue
per capita than Edmonton and Hamilton. Fees and charges are higher in Winnipeg than Hamilton.
Edmonton collects the highest per capita amount of both tax and fees. Mississauga is lower than
all compared cities, and may be influenced by its position within the Greater Toronto Area.
Figure 3 Per Capita Revenue Comparison
Per Capita Revenues Comparison by Category
$3,500
$262
$3,000 $137 $309
$2,500 $698
$245 $1,410
$2,000 $519 $686
$1,500
$760
$1,000 $409
$39
$1,539 $1,510 $303
$500 $919
$549
$-
Winnipeg Edmonton Hamilton Mississauga
2015
Taxes Fees and Charges Government Grants and Transfers Interest and Other Revenue
6
Prepared by MNP LLPUnderstanding Development in Winnipeg
Revenue from all sources has resulted in an annual operating surplus, and an increasing
accumulated surplus as shown in the charts below.
Figure 4 City of Winnipeg Revenue and Expenses
Figure 5 City of Winnipeg Accumulated Surplus
Source: City of Winnipeg 2015 Annual Financial Report
The City’s 2016 Community Trends and Performance Report illustrated capital spending at $393
per capita in Winnipeg based on the 2014 multi-year budget to show a low level of investment
compared to other cities. This was the information used by Hemson as part of its argument about
the lack of spending on infrastructure. Due to timing and financing methods, the illustration did
not fully account for all capital investments. According to the city’s financial statements, actual
7
Prepared by MNP LLPUnderstanding Development in Winnipeg
annual capital additions during the year averaged $744 per capita from 2010 to 2015, as
illustrated below.
Figure 6 City of Winnipeg Capital Investment
City of Winnipeg Capital Investment
$700,000 $949 $1,000
$900
$600,000 $778 $777
$717 $741 $800
$500,000 $700
$579
$400,000 $498 $501 $499 $600
$405 $500
$300,000 $400
$281
$246 $256 $222 $300
$200,000 $213
$200
$100,000
$100
$- $-
2001 2002 2003 2004 2005 2006 2007 2008 2009 2010 2011 2012 2013 2014 2015
Capital Additions during the year (000's) Capital $ per capita
A comparison to other similar sized cities shows that Winnipeg’s investment since 2012 is
relatively similar to Hamilton and higher than Mississauga. Edmonton shows significantly higher
than the other three.
Figure 7 Capital Spending Per Capita Comparison
Capital $ per capita Comparison 2010-2015
$1,600
$1,400
$1,200
$1,000 Winnipeg
$800 Edmonton
$600 Hamilton
$400 Mississauga
$200
$-
2010 2011 2012 2013 2014 2015
8
Prepared by MNP LLPUnderstanding Development in Winnipeg
Capital reserves in Winnipeg have also steadily increased since 2010.
Figure 8 City of Winnipeg Capital Reserve, 2007-2015
City of Winnipeg Capital Reserve (000's)
160,000
135,829
140,000 127,051
120,000 114,359 114,907 114,548
107,716
98,329 97,376
100,000 89,887
80,000
74,930
60,000
40,000
20,000
0
2006 2007 2008 2009 2010 2011 2012 2013 2014 2015
Source: City of Winnipeg 2007, 2008, 2013, 2015 Annual Financial Reports
In spite of balanced budgets and increasing reserves, the City is on an active search for alternative
sources of revenue.
“There is a growing gap between revenues and spending to support the
services that Winnipeggers need. We have a growing structural operating
deficit and not enough revenue to cover current expenditure levels. We need a
new funding model. We need new, stable sources of revenue”
-Mayor Bowman (City of Winnipeg, 2016)
The City has historically taken funds collected for one purpose and used them for another. In the
90’s, this led, in part, to the infrastructure deficit situation. There is concern this practice will
continue with funds collected for investments in new infrastructure. In April 2016, City Council
approved increases to water and sewer rates, but re-directed $32 million of the revenue to a
general reserve in spite of massive upgrades underway at the City’s four water treatment plants.
(CBCNews, 2016). The Minister of Conservation and Water Stewardship objected and wanted to
see Winnipeg refer the planned rate hike to the Public Utilities Board to provide “good
professional analysis” on whether taking a dividend payment from water revenue is appropriate.
While the PUB regulates the rates charged by all water and sewer utilities outside Winnipeg, City
Council has sole authority for utility rates in Winnipeg. According to the PUB, this is not in the
public interest. After hearings in December 2011 to see how the City of Winnipeg handles its
9
Prepared by MNP LLPUnderstanding Development in Winnipeg
water and sewer utilities, the PUB found the practice of cross subsidizing to be a hidden tax. The
PUB further found that:
“Winnipeg's water and sewer utilities are in excellent financial health with
combined surpluses of $1.6 billion as of December 31, 2010… The
money…could be used to significantly accelerate the removal of existing
infrastructure deficits, including the separation of combined sewers (to reduce
or eliminate raw sewage discharges into rivers) if such monies were kept and
used in the two utilities…The Board is of the view that it would be in the public
interest for the Public Utilities Board to regulate the rates charged by these
utilities." (Manitoba Public Utilities Board, 2012).
A number of projects for the water and sewer utility are included in the costs to be charged to
new development, even though another funding method exists, to which new homeowners and
commercial properties also contribute.
The Mayor campaigned on finding alternative revenues and has actively lobbied the province for
a greater share of the PST (Kives, 2014). Other lucrative opportunities have been rejected, such
as ending the generous tax break enjoyed by MTS for its landlines that has been the same flat
rate for more than four decades, even when given the opportunity with a sale to Bell (Annable,
2016). The proposed target for alternative revenues in the 2017 budget is now families investing
in new homes.
“We are either looking at higher property taxes for everyone, or higher
property values for some that choose to build and grow”
– Mayor Brian Bowman (Taylor, 2016).
Creating an unfair burden on those that choose to build and grow
the city will dampen growth. Without the new, annual assessment
revenue that comes with new growth, there will need to be higher
property taxes for everyone.
10
Prepared by MNP LLPYou can also read