IESE Cities in Motion Index 2019 - IESE Business School
←
→
Page content transcription
If your browser does not render page correctly, please read the page content below

IESE
Cities in
Motion
Index
2019

IESE Cities
in Motion Index
2019

   We gratefully acknowledge the financial support of the Agencia Estatal de Investigación (AEI) of the Ministry of
   Economy and Competitiveness—ECO2016-79894-R (MINECO/FEDER), the Schneider-Electric Sustainability and
   Business Strategy Chair, the Carl Schroeder Chair in Strategic Management and the IESE’s High Impact Projects
   initiative (2017/2018).

DOI: https://dx.doi.org/10.15581/018.ST-509


CONTENTS

Foreword                                                                        07

About Us                                                                        09

Working Team                                                                    09

Introduction: The Need for a Global Vision                                      10

Our Model: Cities in Motion. Conceptual Framework, Definitions and Indicators   11

Limitations of the Indicators                                                   23

Geographic Coverage                                                             23

Cities in Motion: Ranking                                                       25

Cities in Motion: Ranking by Dimension                                          28

Cities in Motion: Regional Ranking                                              40

Noteworthy Cases                                                                46

Evolution of the Cities in Motion Index                                         50

Cities in Motion Compared With Other Indexes                                    53

Cities in Motion: City Ranking by Population                                    54

Cities in Motion: Analysis of Dimensions in Pairs                               57

Cities in Motion: A Dynamic Analysis                                            64

Recommendations and Conclusions                                                 66

Appendix 1. Indicators                                                          69

Appendix 2. Graphical Analysis of the Profiles of the 174 Cities                76


Foreword

Once again, we are pleased to present a new edition (the sixth) of our IESE Cities in Motion Index
(CIMI). Over the past years, we have observed how various cities, companies and other social actors
have used our study as a benchmark when it comes to understanding the reality of cities through
comparative analysis.

As in every edition, we have tried to improve the structure and coverage of the CIMI and this, the
sixth edition, has been no exception. As in the previous editions, we have tried to provide an index
that is objective, comprehensive, wide-ranging and guided by the criteria of conceptual relevance
and statistical rigor. However, this edition features some different elements with respect to the
others. The first important difference is that we have significantly increased the number of variables
in relation to the cities. This edition includes a total of 96 indicators (13 more than in the previous
edition), which reflect both objective and subjective data and offer a comprehensive view of each
city. Among the new variables, there are, for example, the hourly wage, purchasing power, mortgage
as a percentage of income, and whether a city is a favorable environment for the development of
women. In our opinion, this increase in the quantity and quality of the variables used allows for a
more accurate assessment of the reality of the cities that appear in the CIMI.

A second difference is reflected in our effort to widen the geographical coverage, which has resulted
in the analysis of a greater number of cities than in the previous edition: we cover a total of 174 cities
(79 of them capitals), which represent 80 countries. In this regard, 11 new cities have been added,
notably Quebec (Canada), Edinburgh (United Kingdom) and Denver and Seattle (United States). The
breadth and scope of the CIMI establish it as one of the city indexes with the widest geographical
coverage existing today. On the website citiesinmotion.iese.edu/indicecim/?lang=en, the data about
each of the cities can be consulted in an interactive way and two cities can be compared at the same
time.

As in the previous edition, we have merged two dimensions of our conceptual model, which
originally took into account 10 key dimensions: human capital, social cohesion, the economy,
public management, governance, the environment, mobility and transportation, urban planning,
international outreach, and technology. We have kept governance and public management in a
single category (“governance”) for two fundamental reasons: in the first place, because there is a
certain overlapping between both dimensions that makes it difficult to distinguish between them
conceptually and, secondly, because the limited number of city-related indicators that cover each
of these dimensions led us to join them together so we have a more reliable measure. We believe
that this change does not significantly affect the conclusions of the CIMI but rather it strengthens
them. In any case, we continue to strive to obtain more and better indicators that will capture these
dimensions.

These differences with respect to previous editions oblige us to remind the reader that the rankings
are not directly comparable from one year to another. The inclusion of new cities and new indicators
produces variations that do not necessarily reflect the trajectory of the cities over time. To be able to
study the evolution of the cities, in each edition we analyze the trend of the cities by calculating the
index of the previous three years, which allows us to make more appropriate comparisons.

We see this index as a dynamic project and therefore we continue to work so that the future editions
of the index will have better indicators for all the dimensions and give wider coverage, as well as a
growing analytical and predictive value. In this respect, your comments and suggestions are always
welcome as they will enable us to progress, and we invite you to contact us via the channels you will
find on our website: www.iese.edu/cim.

Likewise, we would like to inform our readers that our efforts here at the IESE Cities in Motion
platform have not been limited to just ranking cities but we have continued to publish our series
of minibooks in English, which identify good practices in each of the dimensions of the IESE Cities
in Motion model. Currently there are four publications available on Amazon about the dimensions

                                 7      IESE Business School - IESE Cities in Motion Index / ST-509-E
of the environment, mobility and transportation, the economy, and social cohesion, while the next
volume will be devoted to international outreach and shortly this collection will be expanded to
cover the rest of the dimensions.

Moreover, new case studies have been published in addition to those that already exist about
Vancouver ("Vancouver: The Challenge of Becoming the Greenest City"), Barcelona ("Barcelona: A
Roman Village Becoming a Smart City") and Málaga ("Málaga: In Search of Its Identity as a Smart
City"). During this academic year, moreover, we have added a case about the city of Medellín, which
has the title "Medellín: Transformation Toward a More Equitable, Innovative and Participatory Urban
Society." These documents are available on the IESE case study portal (www.iesepublishing.com),
and there will be new cases available shortly, including one about the city of Singapore and its digital
identity project. This new teaching material has allowed us to consolidate our courses linked to cities
in both IESE programs and those undertaken in collaboration with other schools and institutions.

In parallel, we continue to work on a series of academic papers, especially focused on the Sustainable
Development Goals (SDGs) adopted by the United Nations in urban contexts. We hope that these
publications will soon be added to other articles already published in prestigious journals such as
the Academy of Management Journal, the California Management Review and the Harvard Deusto
Business Review.* We have also strengthened the presence of the IESE Cities in Motion platform
on the Internet with our Twitter account (@iese_cim) and our monthly posts on the IESE Cities
in Motion blog (blog.iese.edu/cities-challenges-and-management). Finally, it is worth highlighting
our participation in various projects, such as GrowSmarter, financed by the European Commission
(www.grow-smarter.eu/home), or the technical guide about public-private partnerships (PPPs) that
we have produced with the CAF-Development Bank of Latin America. This guide can be acquired
free of charge (scioteca.caf.com/handle/123456789/1179) and it is complemented by a series of
explanatory videos (www.ieseinsight.com/doc.aspx?id=2165&idioma=1).

We regard both our publications and our presence in cyberspace as being the ideal complements
of this index as they contribute to a better understanding of the reality of cities. Therefore, we
believe that it will be useful for those in charge of making cities better environments in which to
live, work and enjoy life. Urban managers face significant obstacles such as difficulties in mobility,
aging populations, increases in inequality, the persistence of poverty and pollution, among many
others. Their scope and magnitude demonstrate the need for all of the world’s cities to carry out a
strategic review process that covers: what type of city they want to be, what their priorities are, and
what changes they should undertake in order to take advantage of the opportunities—and minimize
the threats—of urbanization. Therefore, our effort focuses on the concept of smart governance.
This report is our modest contribution to advancing this process. We are convinced that we can
live in better cities, but this will be possible only if all the social actors—the public sector, private
companies, civic organizations and academic institutions—actively participate and collaborate to
achieve this common goal.

THE AUTHORS
                                Prof. Pascual Berrone                                                Prof. Joan Enric Ricart
                                Holder of the Schneider Electric                                     Holder of the Carl Schrøder
                                Sustainability and Business                                          Chair of Strategic
                                Strategy Chair                                                       Management
                                Academic codirector of                                               Academic codirector of
                                IESE Cities in Motion                                                IESE Cities in Motion

*
    You will find a complete list of publications on our website: www.iese.edu/cim.

                                               8        IESE Business School - IESE Cities in Motion Index / ST-509-E
About Us

IESE Cities in Motion is a research platform launched jointly by the Center for Globalization and
Strategy and IESE Business School’s Department of Strategy.

The initiative connects a global network of experts in cities, specialist private companies and local
governments from around the world. The aim is to promote changes at the local level and to develop
valuable ideas and innovative tools that will lead to more sustainable and smarter cities.

The platform’s mission is to promote the Cities in Motion model, with an innovative approach to city
governance and a new urban model for the 21st century based on four main factors: sustainable
ecosystem, creative activities, equality among citizens, and connected territory.

Working Team

ACADEMIC TEAM

Pascual Berrone
Professor of Strategic Management and holder of the Schneider Electric Sustainability and Business
Strategy Chair of IESE Business School

Joan Enric Ricart
Professor of Strategic Management and holder of the Carl Schrøder Chair of Strategic Management of
IESE Business School

Ana Isabel Duch T-Figueras
Research Collaborator

Carlos Carrasco
Research Collaborator

TECHNICAL TEAM

David Augusto Giuliodori
Professor of Statistics 2 at the National University of Córdoba (Argentina) and Econfocus Consulting

María Andrea Giuliodori
Professor of Statistics at the Institute of Stock Exchange Studies (IEB)

                                  9      IESE Business School - IESE Cities in Motion Index / ST-509-E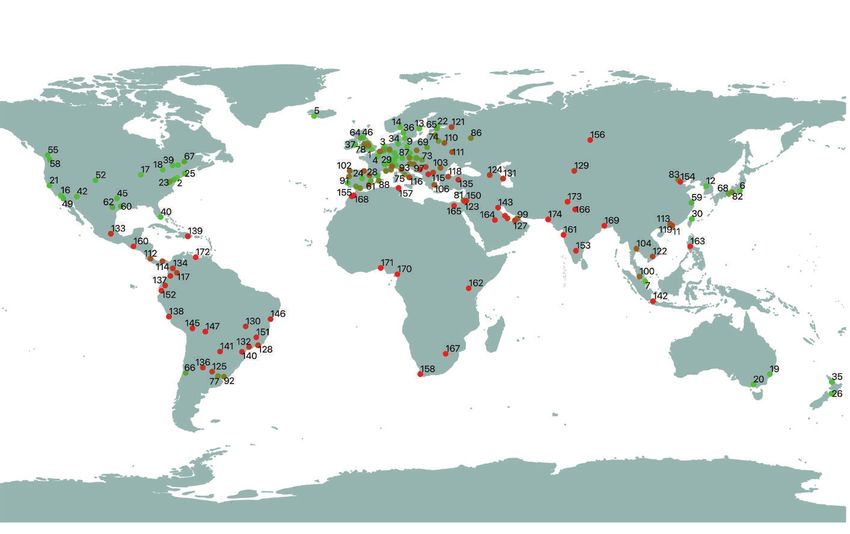
Introduction: The
Need for a Global
Vision

Today more than ever, cities need to develop strategic                 have been sustainable in the medium term as, in some
planning processes, since only then can they outline                   cases, they were created for studies meant to cover the
paths toward innovation and prioritize the aspects that                specific information needs of certain bodies, whose life
are most important for their future.                                   span depended on how long the financing would last
                                                                       and, in other cases, the system of indicators depended
This process should be participatory and flexible, and a
                                                                       on a political desire in specific circumstances, so they
central aim must be established: to define a sustainable
                                                                       were abandoned when political priorities or the authori-
action plan that will make the metropolis unique and re-
                                                                       ties themselves changed. As for the indicators developed
nowned. Just as two companies do not have the same
                                                                       by international organizations, it is true that they strive
recipe for success, each city must look for its own model
                                                                       for the consistency and solidity necessary to compare cit-
based on a series of common reflections and consider-
                                                                       ies; however, for the most part, they tend to be biased or
ations.
                                                                       focused on a particular area (technology, the economy,
Experience shows that large cities must eschew short-ter-              and the environment, among others).
mism and broaden their field of view, as well as turn to
                                                                       Taking all this into account, the index that provides
innovation more frequently to improve the efficiency and
                                                                       this publication with its title, the Cities in Motion Index
sustainability of their services. Also, they should promote
                                                                       (CIMI), has been designed with the aim of constructing a
communication and ensure that the public and business-
                                                                       “breakthrough” indicator—in terms of its completeness,
es are involved in their projects.
                                                                       its properties, its comparability, its quality and the ob-
The time has come to practice smart governance that                    jectivity of its information included—that would enable
takes into account all the factors and all the social actors,          measurement of sustainability with regard to the future
with a global vision. In fact, over the past few decades,              of the world’s leading cities, as with the quality of life of
various national and international organizations have                  their inhabitants.
produced studies focusing on the definition, creation and
                                                                       The CIMI is intended to help the public and governments
use of indicators with a variety of aims, although mainly
                                                                       to understand the performance of nine fundamental di-
that of contributing to a diagnosis of the state of cities.
                                                                       mensions for a city: human capital, social cohesion, the
The definition of the indicators and the process of their
                                                                       economy, governance, the environment, mobility and
creation are the result of the characteristics of each study
                                                                       transportation, urban planning, international outreach,
and of the statistical and econometric techniques that
                                                                       and technology. All the indicators are linked with a strate-
best fit the theoretical model and the available data, as
                                                                       gic purpose whose goal is to implement a novel form of
well as the analysts’ preferences.
                                                                       local economic development that involves the creation of
Today we have a great deal of “urban” indicators, al-                  a global city, the promotion of the entrepreneurial spirit,
though many of them are neither standardized nor                       and innovation, among other aspects.
consistent and they cannot be used to compare cities.
                                                                       Each city, unique and unrepeatable, has its own needs
Actually, despite numerous attempts to develop city indi-
                                                                       and opportunities, so it must design its own plan, set its
cators at a regional, national and international level, few
                                                                       priorities, and be flexible enough to adapt to changes.

                                 10     IESE Business School - IESE Cities in Motion Index / ST-509-E
Smart cities generate numerous business opportunities
and possibilities for collaboration between the public
Our Model: Cities in
and private sectors. All stakeholders can contribute, so
an ecosystem network must be developed that will in-
Motion. Conceptual
volve all of them: members of the public, organizations, Framework,
institutions, government, universities, experts, research
centers, etc. Definitions and
Networking has its advantages: better identification of Indicators
the needs of the city and its residents, the establishment
of common aims and constant communication among Our platform proposes a conceptual model based on the
participants, the expansion of learning opportunities, in- study of a large number of success stories and a series
creased transparency, and the implementation of more of in-depth interviews with city leaders, entrepreneurs,
flexible public policies. As a report by the Organization for academics and experts linked to the development of
Economic Cooperation and Development (OECD) pointed cities.
out back in 2001, the network approach allows local pol-
icies to be focused on the public. This model proposes a set of steps that include diagnosis
of the situation, the development of a strategy, and its
Private enterprise also has much to gain with this system subsequent implementation. The first step to making
of networking, given that it can collaborate with the ad- a good diagnosis is to analyze the status of the key
ministration in the long term, access new business op- dimensions, which we will set out below along with the
portunities, gain a greater understanding of the needs of indicators used to calculate the CIMI.
the local ecosystem, gain greater international visibility
and attract talent. Human Capital
Thanks to its technical expertise and its experience in The main goal of any city should be to improve its human
project management, private enterprise, in collaboration capital. A city with smart governance must be capable of
with universities and other institutions, is suited to lead attracting and retaining talent, creating plans to improve
and develop smart city projects. In addition, it can pro- education, and promoting both creativity and research.
vide efficiency and result in significant savings for pub-
Table 1 sets out the indicators used in the human capital
lic-private partnerships.
dimension, along with descriptions of them, their units of
Finally, it must not be forgotten that the human factor measurement, and the sources of information.
is fundamental in the development of cities. Without a
While human capital includes factors that make it more
participatory and active society, any strategy, albeit intel-
extensive than what can be measured with these indica-
ligent and comprehensive, will be doomed to failure. Be-
tors, there is international consensus that level of educa-
yond technological and economic development, it is the
tion and access to culture are irreplaceable components
inhabitants who hold the key for cities to go from “smart”
for measuring human capital. One of the pillars of human
to “wise.” That is precisely the goal to which every city
development is this capital and, given that the Human
should aspire: that its residents and its rulers deploy all
Development Index published annually by the United Na-
their talent in favor of progress.
tions Development Program (UNDP) includes education
To help cities identify effective solutions, we have created and culture as dimensions, it is valid to use these indica-
an index that integrates nine dimensions in a single indi- tors to explain the differences in human capital in a city.
cator and covers 174 cities worldwide. Thanks to its broad
and integrated vision, the CIMI enables the strengths and To define this dimension, the CIMI includes the 10 vari-
weaknesses of each of the cities to be identified. ables detailed in Table 1. Most of the variables are incor-
porated into the index with a positive sign due to their
contribution to the development of the dimension, the
exception being expenditure on education per capita.
To measure access to culture, the number of museums,
art galleries and theaters and the expenditure on leisure
and recreation are taken into account. These indicators
show the city’s commitment to culture and human cap-
ital. Cities that are considered creative and dynamic on a
global level typically have museums and art galleries open
to the public, offer visits to art collections, and carry out
11 IESE Business School - IESE Cities in Motion Index / ST-509-ETable 1. Human Capital Indicators
No. Indicator Description / Unit of measurement Source
1 Higher education Proportion of population with secondary and higher education. Euromonitor
2 Business schools Number of business schools (top 100). Financial Times
3 Movement of students International movement of higher-level students. Number of students. UNESCO
4 Universities Number of universities in the city that are in the top 500. QS Top Universities
5 Museums and art galleries Number of museums and art galleries per city. OpenStreetMap
6 Schools Number of public or private schools per city. OpenStreetMap
7 Theaters Number of theaters per city. OpenStreetMap
Expenditure on leisure and
8 Expenditure on leisure and recreation per capita. Euromonitor
recreation
Expenditure on leisure and Expenditure on leisure and recreation. In millions of dollars, according to
9 Euromonitor
recreation 2016 prices.
10 Expenditure on education Expenditure on education per capita. Euromonitor
activities aimed at their conservation. The existence of a of the rule of law, and solidarity. This allows us to under-
city’s cultural and recreation provision implies greater ex- stand the importance of policies that foment and rein-
penditure on these activities by the population. force social cohesion based on democratic values.
Finally, expenditure on education per capita represents Table 2 sets out the indicators selected to analyze this
what each member of the public spends individually to dimension, descriptions of them, their units of measure-
obtain an appropriate level of education. A high level of ment and the sources of information. This selection seeks
expenditure is an indicator that the state’s budget alloca- to incorporate all the sociological subdimensions of so-
tions for education are insufficient, since they oblige the cial cohesion, taking into account the different variables
public to assume that cost in order to gain access to a suit- available.
able education. For this reason, this variable is included The ratio of deaths per 100,000 inhabitants and the crime
with a negative sign. rate are incorporated with a negative sign when this di-
mension is created. Furthermore, the health index and
Social Cohesion the number of public and private hospitals and health
Social cohesion is a sociological dimension of cities that centers per city are added with a positive sign, since ac-
can be defined as the degree of consensus among the cess to and coverage provided by basic social services
members of a social group or as the perception of be- help strengthen social cohesion.
longing to a common situation or project. It is a measure
of the intensity of social interaction within the group. Employment, meanwhile, is a fundamental aspect in the
Social cohesion in the urban context refers to the level societies, to the extent that, according to historical evi-
of coexistence among groups of people with different in- dence, a lack of it can break the consensus or the implicit
comes, cultures, ages, and professions who live in a city. social contract. For this reason, the unemployment rate
Concern about the city’s social setting requires an anal- is incorporated with a negative sign in the dimension of
ysis of factors such as immigration, community develop- social cohesion. With regard to the ratio of women who
ment, care of the elderly, the effectiveness of the health work in public administration, this is incorporated with a
system, and public safety and inclusion. positive sign, since it is an indicator of gender equality in
access to government jobs.
The presence of various groups in the same space and
mixing and interaction between them are essential in a The Gini index, calculated on the basis of the Gini coeffi-
sustainable urban system. In this context, social cohesion cient to measure social inequality, assumes a value equal
is a state in which citizens and the government share a to 0 for situations in which there is a perfectly equitable
vision of a society based on social justice, the primacy distribution of income (everyone has the same income)
12 IESE Business School - IESE Cities in Motion Index / ST-509-ETable 2. Social Cohesion Indicators
No. Indicator Description / Unit of measurement Source
11 Mortality Ratio of deaths per 100,000 inhabitants. Euromonitor
12 Crime rate Crime rate. Numbeo
13 Health Health index. Numbeo
14 Unemployment Unemployment rate (number of unemployed out of the workforce). Euromonitor
Measure of social inequality. It varies from 0 to 100, with 0 being a situation of
15 Gini index Euromonitor
perfect equality and 100 that of perfect inequality.
16 Price of property Price of property as percentage of income. Numbeo
International Labour
17 Female workers Ratio of female workers in the public administration.
Organization (ILO)
An index that measures the peacefulness and the absence of violence in a
Institute for
18 Global Peace Index country or region. The bottom-ranking positions correspond to countries
Economics and Peace
with a high level of violence.
19 Hospitals Number of public and private hospitals and health centers per city. OpenStreetMap
An index that measures the level of happiness of a country. The highest
World Happiness
20 Happiness index values correspond to countries that have a higher degree of overall
Index
happiness.
Ranking that considers the proportion of people in a situation of slavery in
21 Global Slavery Index the country. The countries occupying the top positions in the ranking are Walk Free Foundation
those with the highest proportion.
This variable measures how the government deals with situations of slavery
Government response to
22 in the country. The top positions in the ranking indicate countries that have Walk Free Foundation
situations of slavery
a more effective and comprehensive response.
Global Terrorism
Database (GTD) of
23 Terrorism Number of terrorist incidents by city in the previous three years.
the University of
Maryland
The variable seeks to measure whether a city provides a friendly
24 Female-friendly environment for women on a scale of 1 to 5. Cities with a value of 1 have a Nomad List
more hostile environment, while those whose value is 5 are very friendly.
25 Suicides Suicide rate by city. Nomad List
26 Homicides Homicide rate by city. Nomad List
and it assumes a value equal to 100 when the income dis- The price of property as a percentage of income is also
tribution is completely unequal (one person hoards all the negatively related since, when the percentage of income
income to the detriment of all the others). This indicator to be used to buy a property increases, the incentives to
is included in the dimension with a negative sign, since a belong to a particular city’s society decrease.
greater Gini coefficient has a negative effect on a city’s
social cohesion. With regard to happiness, it is increasingly considered a
suitable measure of social progress and has become a
The Global Peace Index is an indicator that represents the goal of government policies. According to the World Hap-
degree of tranquility and peace in a country or region, as piness Report, people assert they are happy if they have
well as the absence of violence and war. It includes in- a stable job and are healthy and if there is a more homo-
ternal variables such as violence and crime and external geneous distribution of wealth within the country or city
ones, such as military spending and the wars in which the where they live. To represent this degree of satisfaction,
country or region is taking part. The countries at the top the happiness index is included in the CIMI. This variable
of the ranking are countries with a low level of violence, is included with a positive sign, since the countries that
so the indicator has a negative relationship with the CIMI. show themselves to be “happiest” (with high values in the
index) are those that pay special attention to freedom,
13 IESE Business School - IESE Cities in Motion Index / ST-509-Eemployment, health care, income and good governance. ative sign in the index, due to their impact on the dimen-
Thus, the happiness of a country or city would also be re- sion also being negative: the higher the homicide rate, the
flected in greater social coexistence. more insecure the city becomes; the higher the suicide
rate, the less attractive it is as a place to live.
The proportion of people enduring slavery and the mea-
sures that governments take to respond to this type of Economy
crime are incorporated with a negative sign in the ranking,
since they do not contribute to the development of a just This dimension includes all those aspects that promote
and socially cohesive city. the economic development of a territory: local economic
development plans, transition plans, and strategic indus-
The terrorism variable takes into account the acts of ter- trial plans; cluster generation; innovation; and entrepre-
rorism that have been committed in the previous three neurial initiatives.
years in the city. It is included with a negative sign since
such acts undermine the social peace of the city. The indicators used to represent the performance
of cities in the economic dimension are specified in
This year, three new variables have been incorporated. Table 3, along with a brief description, their units of mea-
The female-friendly variable seeks to measure the ur- surement, and the sources of information
ban degree of freedom and safety for the development
of women and it is expressed in categories from 1 to 5, Considering that the CIMI seeks to measure, via multi-
where the highest score corresponds to cities that are ple dimensions, the future sustainability of the world’s
more female-friendly. It is included in the index with a main cities and the quality of life of their inhabitants,
positive sign. The other two variables incorporated are real GDP is a measure of the city’s economic power and
the suicide rate and the homicide rate by city, with a neg- the income of those who live there. Indeed, in numer-
ous studies, GDP is considered the only or the most im-
Table 3. Economic Indicators
No. Indicator Description / Unit of measurement Source
27 Productivity Labor productivity calculated as GDP per working population (in thousands). Euromonitor
28 Time required to start a business Number of calendar days needed so a business can operate legally. World Bank
The top positions in the ranking indicate a more favorable regulatory
29 Ease of starting a business World Bank
environment for creating and developing a local company.
Globalization and
30 Headquarters Number of headquarters of publicly traded companies.
World Cities (GaWC)
Percentage of people involved in TEA (that is, novice entrepreneurs and
Motivation to get started in TEA Global
owners or managers of a new business), driven by an opportunity for
31 (total early-stage entrepreneurial Entrepreneurship
improvement, divided by the percentage of TEA that is, in turn, motivated by
activity) Monitor (GEM)
need.
32 GDP estimate Estimated annual GDP growth. Euromonitor
33 GDP GDP in millions of dollars at 2016 prices. Euromonitor
34 GDP per capita GDP per capita at 2016 prices. Euromonitor
Mortgage as a percentage of income. It is calculated as a proportion of
the real monthly cost of the mortgage with respect to the family income
35 Mortgage Numbeo
(estimated via the average monthly salary). The lower the percentage, the
better.
The variable assumes the value of 1 if the city has the Glovo service and 0
36 Glovo Glovo
otherwise.
The variable assumes the value of 1 if the city has the Uber service and 0
37 Uber Uber
otherwise.
38 Salary Hourly wage in the city. Euromonitor
Purchasing power (determined by the average salary) for the purchase of
39 Purchasing power goods and services in the city, compared with the purchasing power in New Numbeo
York City.
14 IESE Business School - IESE Cities in Motion Index / ST-509-Eportant measure of the performance of a city or country. by the mortgage, the worse the situation will be for the
However, in this report, it is not considered as exclusive family. For that reason, the variable is incorporated with
nor as the most important measure but as one more indi- a negative sign.
cator within the framework of the nine dimensions of the
CIMI. Thus, its share of the total is similar to that of other Taking into account the degree of dissemination of new
indicators. For example, if a city with a high or relatively technologies and the services that emerge from them,
high GDP does not have a good performance in other in- we also incorporated the Glovo and Uber variables as in-
dicators, it may not be in one of the top positions. In this dicators of the new digital economy. Both variables show
way, a city that is very productive but has problems with the coverage of the respective service in the city. They
transportation, inequality, weak public finance or a pro- are binary variables and are incorporated with a positive
duction process that uses polluting technology probably sign. Information concerning the Mytaxi service was also
will not be in the top positions of the ranking. Additional- collected but this was discarded, since it currently has a
ly, we have included the estimated annual GDP growth to presence in all the cities considered in the ranking.
study the future progress of the city.
Finally, the variable for the hourly wage in the city has
For its part, labor productivity allows for a measurement been incorporated, along with the index that represents
of the strength, efficiency and technological level of the the purchasing power relating to goods and services in
production system. With regard to local and internation- the city compared with the purchasing power of a New
al competitiveness, productivity will have repercussions, York resident. Both indicators are added with a positive
obviously, on real salaries, capital income, and business sign, since high values of these represent a better work
profits—for which reason, it is very important to consid- situation.
er the measure in the economic dimension, since differ-
ent productivity rates can explain differences in workers’ Governance
quality of life—and the sustainability over time of the “Governance” is the term commonly used to describe
production system. the effectiveness, quality and sound guidance of state in-
tervention. Given that the city resident is the focal point
Other indicators selected as representative of this di-
for solving all the challenges facing cities, factors such as
mension enable the measurement of some aspects of
the level of the public’s participation and the authorities’
the business landscape of a city, such as the number
ability to involve business leaders and local stakeholders
of headquarters of publicly traded parent companies;
should be taken into account, as well as the application
the entrepreneurial capacity and possibilities of a city’s
of e government plans. Moreover, this dimension en-
inhabitants, represented by the percentage of entre-
compasses all those actions aimed at improving the ad-
preneurs who start their activity motivated by personal
ministration’s efficiency, including the design of new or-
improvement; and the time required to start a business
ganizational and management models. In this area, great
and the ease of setting up a business in regulatory terms.
opportunities open up for private initiative, which can
These indicators measure a city’s sustainability capacity
bring greater efficiency.
over time and the potential ability to improve the quality
of life of its inhabitants. The time required to start a busi- In this work, governance is understood to have a strong
ness and the ease of launching it are incorporated into correlation with the state of public finances of a city or
the economic dimension with a negative sign, since lower country. In this sense, public accounts decisively affect the
values indicate a greater ease of starting businesses. The population’s quality of life and a city’s sustainability, since
number of headquarters of publicly traded parent com- they determine the level of present and future taxes that
panies, the entrepreneurial capacity and possibilities of a the residents and the production system must face, the
city’s inhabitants and the number of entrepreneurs have expected growth of the general level of prices, the possi-
a positive relationship, since the high values of these indi- bilities of public investment in basic social infrastructure,
cators reflect the economic dynamism of a city, as well as and incentives for private investment. In addition, if the
the ease of setting up and starting a new business. state has financing needs, it will compete with the private
sector for funds available in the financial system, which
This year, five new variables have been incorporated in will affect investment.
this dimension. In the case of the percentage of the fam-
ily income represented by mortgage payments, this is The indicators that represent the governance dimension
added to complement the information collected by the in this report are listed in Table 4, along with descriptions
variable of the price of private property. An attempt is of them, their units of measurement and the sources of
made to measure the extent to which access to a 20-year information.
mortgage is within the reach of a middle-income family.
The level of reserves is an indicator of the strength of
The higher the percentage of the family income taken up
the public finance system in the short and medium term,
15 IESE Business School - IESE Cities in Motion Index / ST-509-ETable 4. Governance Indicators
No. Indicator Description / Unit of measurement Source
Total reserves in millions of current dollars. Estimate at city level according to
40 Reserves World Bank
the population.
41 Reserves per capita Reserves per capita in millions of current dollars. World Bank
42 Embassies Number of embassies and consulates per city. OpenStreetMap
This establishes whether or not the city has ISO 37120 certification. Certified
cities are committed to improving their services and quality of life. It is a World Council on City
43 ISO 37120 certification
variable coded from 0 to 6. Cities that have been certified for the longest time Data (WCCD)
have the highest value. The value 0 is for those cities without certification.
44 Research centers Number of research and technology centers per city. OpenStreetMap
45 Government buildings Number of government buildings and premises in the city. OpenStreetMap
The strength of legal rights index measures the degree to which collateral
and bankruptcy laws protect the rights of borrowers and lenders and thus
46 Strength of legal rights index facilitate access to loans. The values go from 0 (low) to 12 (high), where the World Bank
highest ratings indicate that the laws are better designed to expand access
to credit.
Countries with values close to 0 are perceived as very corrupt and those Transparency
47 Corruption perceptions index
with an index close to 100 as very transparent. International
CTIC Foundation and
48 Open data platform This describes whether the city has an open data system.
Open World Bank
E-Government Development The EGDI reflects how a country is using information technology to
49 United Nations
Index (EGDI) promote access and inclusion for its citizens.
Ranking where the countries in the highest positions are those considered The Economist
50 Democracy ranking
more democratic. Intelligence Unit
Percentage of population employed in public administration and defense;
Employment in the public
51 education; health; community, social and personal service activities; and Euromonitor
administration
other activities.
of their ability to cope with changing economic cycles, The strength of legal rights index measures the degree to
and of the strength and sustainability of the economic which collateral and bankruptcy laws protect the rights
structure in relation to the state. Likewise, the number of borrowers and lenders and thus facilitate access to
of embassies and consulates is an indicator of the city’s loans. The values go from 0 (low) to 12 (high) and the
international importance for global standards. This indi- highest ratings indicate that the laws are better designed
cator is based on the embassies that foreign countries to expand access to credit. Creating the conditions and
assign to the city. ensuring the effective implementation of the rights of the
public and companies situated in their territory are func-
Cities that have ISO 37120 certification are committed to tions that pertain to national or local governments and
improving their services and quality of life, so a variable cannot be delegated. The perception of the observance
has been included that considers whether a city has ob- of legal rights influences all aspects of life of a country or
tained the certification or not. Standards for smart cities city, such as its business climate, investment incentives,
are established in this standard, based on 100 indicators. and legal certainty, among others. For this reason, the
The aim of this to provide a parameter to compare all the strength of rights index has been included with a positive
cities equally. This variable is incorporated with a positive sign in the creation of this dimension.
sign.
The government corruption perceptions index is a way to
For their part, the number of research centers and the measure the quality of governance, since a high percep-
number of government buildings show the degree of tion in society of corruption in public bodies is a sign that
representativeness of local government among the pub- state intervention is not being efficient from the point of
lic for attending to their requests and carrying out ad- view of the social economy, given that public services—
ministrative tasks, etc. These variables are included with understood in a broad sense—involve higher costs in
a positive sign in the CIMI calculation. relation to a situation with no corruption. In addition,
16 IESE Business School - IESE Cities in Motion Index / ST-509-Eincentives to invest or settle in countries or cities with a energy, efficient water and waste management, and the
high perception of corruption will be lower than in others existence of policies that help counter the effects of cli-
with low levels, which negatively affects sustainability. In mate change are essential to guarantee the long-term
the case of the CIMI, it is taken as an explanatory indi- sustainability of cities.
cator of the governance dimension, with a positive sign,
Since the CIMI also seeks to measure environmental
due to how the index is calculated by the organization
sustainability, the environment is included as one of the
Transparency International, which assigns a value of 0 to
essential aspects of measurement. Table 5 sets out the
countries with a high level of corruption and 100 to those
indicators selected in this dimension, as well as brief de-
with a high degree of transparency.
scriptions, their units of measurement, and the sources
Finally, the variable that considers whether a city’s gov- of the information.
ernment has an open data platform is an indicator of The indicators selected include measurements of air pol-
transparency in government management, a communi- lution sources and water quality in cities, which are in-
cation channel with the public and a platform for gener- dicators of the quality of life of their inhabitants, as well
ating new business models. The variable assigns a value as the sustainability of their production or urban matrix.
of 1 if there is an open data platform and 0 otherwise.
Therefore, the indicator is incorporated with a positive CO₂ emissions come from the burning of fossil fuels and
sign into this dimension. the manufacture of cement, while methane emissions
arise from human activities such as agriculture and the
The E-Government Development Index (EGDI) reflects industrial production of methane. Both types of emis-
how a country is using information technology to pro- sions are the main measures that are commonly used
mote access and inclusion for its citizens. It is a measure to evaluate the degree of air pollution, since they are
composed of three important dimensions of e govern- substances that are strongly related to the greenhouse
ment: the provision of online services, telecommunica- effect. In fact, reducing these indicators’ values is one of
tions connectivity and human capacity. This variable is the goals of the Kyoto Protocol.
included with a positive sign.
Other very important indicators for measuring air pol-
The Democracy Index, for its part, shows a country’s de- lution in cities are PM2.5 and PM10, designations that
gree of democracy, represented by its electoral system, correspond to small particles (solid or liquid) of dust,
its freedom of expression, the functioning of the govern- ash, soot, metal, cement, or pollen, scattered in the at-
ment, and political participation and culture. It is includ- mosphere and whose diameter is less than 2.5 µm and
ed with a negative sign since the countries in the highest 10 µm, respectively. These particles are formed primarily
positions are those considered more democratic. by inorganic compounds such as silicates and aluminates,
heavy metals, and organic material associated with car-
This year, a new variable has been incorporated for the
bon particles (soot). These indicators are commonly used
percentage of employees in public-sector jobs, such as
in the indexes that seek to measure the state of environ-
education, defense and health, and it is included with a
mental pollution. They are also complemented by the in-
positive sign in the dimension, since it is an indicator of
formation provided by a city’s pollution index, which es-
the human capital in the public sector.
timates its overall pollution. The greatest weight is given
to those cities with the highest air pollution.
The Environment
Sustainable development of a city can be defined as The Environmental Performance Index (EPI), calculat-
“development that meets the needs of the present with- ed by Yale University, is an indicator based on the mea-
out compromising the ability of future generations to surement of two major dimensions related to the envi-
meet their own needs.”1 In this respect, factors such as ronment, namely: environmental health and ecosystem
improving environmental sustainability through antipol- vitality. The first is divided into three subdimensions:
lution plans, support for green buildings and alternative effects on human health of air pollution, water quality
and the environmental burden of diseases. In turn, eco-
1
Definition used in 1987 by the UN’s World Commission on Environment and
Development, created in 1983.
system vitality contains seven subdimensions: effects on
17 IESE Business School - IESE Cities in Motion Index / ST-509-ETable 5. Environmental Indicators
No. Indicator Description / Unit of measurement Source
CO₂ emissions from the burning of fossil fuels and the manufacture of cement.
52 CO₂ emissions World Bank
Measured in kilotons (kt).
53 CO₂ emission index CO₂ emission index. Numbeo
Methane emissions that arise from human activities such as agriculture and
54 Methane emissions World Bank
the industrial production of methane. Measured in kt of CO₂ equivalent.
Percentage of the population with reasonable access to an appropriate
55 Access to the water supply World Bank
quantity of water resulting from an improvement in the supply.
The indicator PM2.5 measures the number of particles in the air whose World Health
56 PM2.5
diameter is less than 2.5 micrometers (µm). Annual mean. Organization (WHO)
The indicator PM10 measures the amount of particles in the air whose
57 PM10 WHO
diameter is less than 10 µm. Annual mean.
58 Pollution Pollution index. Numbeo
Environmental Performance This measures environmental health and ecosystem vitality. Scale from 1
59 Yale University
Index (EPI) (poor) to 100 (good).
Food and Agriculture
60 Renewable water resources Total renewable water sources per capita. Organization of the
United Nations (FAO)
Percentage of the rise in temperature in the city during the summer
61 Future climate forecast for 2100 if pollution caused by carbon emissions continues to Climate Central
increase.
Average amount of municipal solid waste (garbage) generated annually per Waste Management
62 Solid waste
person (kg/year). for Everyone
the ecosystem of air pollution, water quality, biodiversity city represents potential harm for its inhabitants and the
and habitat, afforestation, fish, agriculture, and climate environment due to the prevalence of poor solid waste
change. Given the completeness of this indicator—which management. In many cities, this poor management also
covers almost all aspects related to measuring the state means an additional health risk for the people who work
and evolution of the environment in a city, complement- with this waste. For this reason, the variable is incorpo-
ed by the other indicators that the CIMI incorporates— rated into the index with a negative sign.
the environment dimension is considered to be repre-
sented proportionately. Mobility and Transportation
Water is a renewable energy source that is fundamental The cities of the future have to tackle two major challeng-
for dealing with climate change and its devastating ef- es in the field of mobility and transportation: facilitating
fects. The variable of total renewable water sources per movement (often over large territories) and access to
capita considers both internal and external renewable public services.
surface water resources, and it represents the resources Mobility and transportation—both with regard to road
that a country has so it can have a sustainable future. For and route infrastructure, the vehicle fleet, and public
this reason, it is included with a positive sign in the calcu- transportation, as well as to air transportation—affect the
lation of the index. quality of life of a city’s inhabitants and can be vital to the
sustainability of cities over time. However, perhaps the
The variable of future climate represents the percentage most important aspect is the externalities that are gen-
of the rise in the city’s temperature during the summer erated in the production system, whether because of the
forecast for 2100 if pollution caused by carbon emissions workforce’s need to commute or because of the need for
continues to increase. This variable shows the future risks an outlet for production.
of today’s pollution and is included with a negative sign,
since a continuous increase in temperature in a city pos- Table 6 sets out the indicators selected in the dimension
es a threat to public health and the economy. of mobility and transportation, descriptions of them, their
units of measurement, and the sources of the informa-
Finally, the average amount of municipal solid waste tion.
(garbage) generated annually per person (kg/year) in a
18 IESE Business School - IESE Cities in Motion Index / ST-509-ETable 6. Mobility and Transportation Indicators
No. Indicator Description / Unit of measurement Source
Consideration of the time spent in traffic, the dissatisfaction this generates,
63 Traffic index Numbeo
CO₂ consumption and other inefficiencies of the traffic system.
Estimation of traffic inefficiencies (such as long journey times). High values
64 Inefficiency index Numbeo
represent high rates of inefficiency in driving.
Index of traffic for commuting to Index of time that takes into account how many minutes it takes to commute
65 Numbeo
work to work.
This system shows the automated services for the public use of shared bicycles
Bike-Sharing World
66 Bike sharing that provide transport from one location to another within a city. The indicator
Map
varies between 0 and 8 according to how developed the system is.
67 Length of the metro system Length of the metro system per city. Metrobits
68 Metro stations Number of metro stations per city. Metrobits
69 Flights Number of arrival flights (air routes) in a city. OpenFlights
70 High-speed train Binary variable that shows whether the city has a high-speed train or not. OpenRailwayMap
71 Vehicles Number of commercial vehicles in the city (in thousands). Euromonitor
72 Bicycles per household Percentage of bicycles per household. Euromonitor
The indexes for general traffic, traffic caused by commut- This year we have also incorporated variables for the
ing to work, and inefficiency are estimates of the traffic number of vehicles and the percentage of bicycles that
inefficiencies caused by long driving times and by the dis- the city has. The former is integrated with a negative sign,
satisfaction that these situations generate in the popula- and the latter with a positive sign, due to the negative
tion. These indicators are a measure of the safety of roads and positive influence they respectively have on traffic
and public transportation, which, if it is effective and has and traffic congestion.
a good infrastructure, promotes a decrease in vehicular
traffic on public thoroughfares and reduces the number Urban Planning
of accidents. All these are included with a negative sign
Urban planning has several subdimensions and is close-
in the calculation of the CIMI, since they have a negative
ly related to sustainability. If this is inadequate, it causes
impact on the development of a sustainable city.
a reduction in the public’s quality of life in the medium
The bike-sharing indicator, for its part, collects informa- term and can also negatively affect investment incen-
tion about a city’s public system of shared bicycles aimed tives, since bad planning or a complete lack of planning
at making it possible to move from one location to anoth- hinders and increases the costs of logistics and workers’
er using them. It varies between 0 and 8, where 0 refers transportation, among other aspects.
to the lack of such a system in the city and 8 refers to a To improve the habitability of any territory, it is necessary
highly developed system. It is incorporated with a posi- to take into account the local master plans and the design
tive sign in the CIMI. of green areas and spaces for public use, as well as opt-
ing for smart growth. The new urban planning methods
The number of metro stations and the length of the sys- should focus on creating compact, well-connected cities
tem are indicators of commitment to the development with accessible public services.
of the city and investment with respect to the population
size. The number of air routes (arrivals) and the posses- Depending on the information available, several aspects
sion of a high-speed train represent the degree of mo- related to urban plans, the quality of health infrastruc-
bility development of a city. A highly developed city will ture, and housing policies are incorporated as indicators
favor the incorporation of new commercial air routes, of this dimension. Table 7 sets out the indicators includ-
as well as the circulation and transit of passengers using ed in this dimension, along with descriptions of them,
different means of transport. These indicators are includ- their units of measurement, and the sources of informa-
ed with a positive sign in the calculation of the index be- tion used.
cause of the good influence they have on the dimension.
19 IESE Business School - IESE Cities in Motion Index / ST-509-ETable 7. Urban Planning Indicators
No. Indicator Description / Unit of measurement Source
Number of bike-rental or bike-sharing points, based on docking stations where
73 Bicycles for rent OpenStreetMap
they can be picked up or dropped off.
Percentage of the urban Percentage of the urban population that uses at least basic sanitation
74 population with adequate services—that is, improved sanitation facilities that are not shared with other World Bank
sanitation facilities households.
Number of people per household. Occupancy by household is measured
75 Number of people per household compared to the average. This makes it possible to estimate if a city has Euromonitor
overoccupied or underoccupied households.
Percentage of buildings considered high-rises. A high-rise is a building of at Skyscraper Source
76 High-rise buildings
least 12 stories or 35 meters (115 feet) high. Media
This variable is the number of completed buildings in the city. It includes
structures such as high-rises, towers and low-rise buildings but excludes Skyscraper Source
77 Buildings
other various others, as well as buildings in different states of completion (in Media
construction, planned, etc.).
The bicycle is an effective, fast, economical, healthy, and International Outreach
environmentally friendly means of transportation. There-
fore its use has a positive impact on a city’s sustainable Cities that want to progress must secure a privileged
development as it does not cause pollution or use fuel, place in the world. Maintaining global impact involves
among other benefits. Considering this positive effect, improving the city brand and its international recognition
the index includes in the CIMI the number of points for through strategic tourism plans, the attracting of foreign
the rental or sharing of this means of transport, based investment and representation abroad.
on docking stations where bicycles can be picked up or Cities can have a greater or lesser international outreach
dropped off. Many cities historically considered to be even if they are from the same country but this aspect is
smart cities have a certain positive correlation with wide- not independent of the degree of openness nationally.
spread bicycle use. As a result, this variable is included This dimension seeks to reflect these differences and to
with a positive sign. measure the international outreach of cities.
For its part, the quality of health infrastructure refers to In this respect, the following indicators have been includ-
the percentage of the urban population with improved ed: airports, number of passengers by airport, number of
sanitation facilities that are not shared with other house- hotels in a city, ranking of the most popular places in the
holds. This indicator has a high correlation with that of world according to Sightsmap, and number of meetings
urban planning, since it can be shown that inadequate and conferences that are held according to data from
planning inevitably results in health problems in the the International Congress and Convention Association.
short and medium term. This last indicator is important for a city’s international
reputation, taking into account that these events usual-
In addition, from the urban planning and housing point of ly take place in cities with international hotels, meeting
view, a city with proper urban planning generally has few rooms specially fitted out for such ends, good frequency
or no problems of overcrowding in households, since nor- of international flights, and appropriate security mea-
mally housing policy, in relation to the estimated growth sures. Table 8 summarizes these indicators, along with
in the number of residents, is a determining factor in descriptions of them, their units of measurement, and
urban planning. For this reason, within the explanatory the sources of information.
indicators of this dimension, the number of occupants of
each household is included with a negative sign. All indicators of this dimension, except Sightsmap, are
incorporated with a positive sign into the calculation of
In turn, the number of completed buildings and the per- the CIMI since the higher the value of the indicators, the
centage of high-rises contribute to the creation of com- greater the impact that the city has on the world. Sights-
pact and organized cities. These variables are incorporat- map is incorporated with a negative sign, since the top
ed with a positive sign. positions in its ranking correspond with the most-pho-
tographed cities, of which there is a higher number of
references in Wikipedia and Foursquare.
20 IESE Business School - IESE Cities in Motion Index / ST-509-EYou can also read