Dallas Urban Forest Master Plan 2021 - City of Dallas

Page created by Gene Barrett
 
CONTINUE READING
Dallas Urban Forest Master Plan 2021 - City of Dallas
Dallas Urban Forest
Master Plan 2021
Dallas Urban Forest Master Plan 2021 - City of Dallas
A MESSAGE FROM TEXAS TREES

         It’s a simple fact that trees are good. It’s also a fact that
         trees in cities just don’t happen by chance, except the Trinity
         Forest. The reality that the City of Dallas has a natural forest,
         and a built urban forest is remarkable. But we’ve come to a
         crossroads; nurture and manage this resource - or lose it.

         Bulldozers, urban heat, pests, climate change, and a myriad
         of other maladies are affecting one of our most important
         natural resources—trees. And it’s up to us to come together,
         as a community, and have the will to consolidate efforts, both
         within the city and with external partners, to protect, expand,
         and manage our urban forest resource. It’s up to all of us to
         make trees a priority.

         The Dallas Urban Forest Master Plan sets forward a strategic
         and cohesive agenda to manage this “green infrastructure”.
         If centralized within the City, there can be a comprehensive
         cost-effective approach to aligning investments for a greater
         return while at the same time providing a roadmap for private
         partners to help reach the goals and objectives of a strategic
         urban forestry plan.

         The Texas Trees Foundation is here to help, as we’ve been
         since 1982, and we will continue to provide technical
         assistance, support, expertise, volunteers, and sponsors to
         help make Dallas cooler, greener and cleaner for our residents
         and to the visitors to this great city.

         Janette Monear, CEO & President // Texas Trees Foundation

    Texas Trees Foundation is pleased to lead the Urban Forest Master Plan with these Key Partners
      CITY OF DALLAS // LYDA HILL PHILANTHROPIES // ONCOR

2                                                                                                    3
Dallas Urban Forest Master Plan 2021 - City of Dallas
TABLE OF CONTENTS
    Executive Summary                                         6
     Why Dallas’s Urban Forest Matters                        7
     Urban Forest Threats and Opportunities                   7
     A Plan for Action                                        8
     Making Trees a Priority                                  8
     Dallas’s Urban Forest Master Plan                       10
     Dallas Urban Forest Master Plan Goals                   10
     Dallas Urban Forest Master Plan Recommendations          11

    SECTION 1: Introduction                                  12
     Why Develop an Urban Forest Master Plan?                15
     Trees Work                                              17
     Benefits of Trees—By the Numbers                        20
     Dallas is Facing Challenges                             23
     The Way Forward                                         31

    SECTION 2: State of the Urban Forest                     33
     What Do We Have?                                        34
     Dallas’s Urban Forest                                   37
     About Dallas’s Trees                                    49
     Dallas’s Public Tree Care & Management                  56
     Public Tree Maintenance                                 62
     City Regulations and Policies                           65
     City Plans                                              66
     Indicators of a Sustainable Urban Forest                70

    SECTION 3: Understanding Dallas’s Priorities             73
     Community and Stakeholder Input                         75
     Urban Forest Master Plan Survey                         80

    SECTION 4: Making Trees a Priority                       85
     The Path Forward                                        87
     Goals                                                   87
     Recommendations and Recommended Action Steps            88
     Action and Implementation                              109

    SECTION 5: Assessing Progress                           115
     How Are We Doing?                                       116
     Conclusion                                              119

    APPENDICES AND REFERENCES                               121
     Appendix A: Maps                                       122
     Appendix B: Ordinance Review                           132
     Appendix C: Indicators of a Sustainable Urban Forest   136
     References                                             140

4                                                                  5
Dallas Urban Forest Master Plan 2021 - City of Dallas
Executive Summary   WHY DALLAS’S URBAN FOREST MATTERS
                        Imagine it is a typical summer day in the City of Dallas, and you go for a walk. It is 110
                        degrees and too hot to stand on the sidewalk. Ahead, a row of trees lines your path
                        and relief from the heat is instant as you stand in their shade. The City of Dallas hosts
                        an impressive, yet underappreciated resource in its trees, forests, and greenspace,
                        known collectively as the urban forest. The urban forest is a capital infrastructure
                        asset, and like any other capital infrastructure asset, requires management input
                        and sustained action. However, unlike other infrastructure, the urban forest’s value
                        increases over time, returning on average $2.25 dollars per dollar spent (McPherson
                        et al., 2005). Trees produce a myriad of important benefits to Dallas’s environment,
                        residents, and visitors. These benefits, including cooling, air quality regulation,
                        improved human health and well-being, and stormwater mitigation, are enhanced with
                        proper urban forest management action. In the City of Dallas, there are an estimated
                        14.7 million trees (Texas Trees Foundation, 2015) producing $239 million in quantifiable
                        environmental benefits annually (Texas Tree Foundation, 2019). In addition, these trees
                        also provide aesthetic, social, and spiritual benefits that go beyond monetary value.

                        URBAN FOREST THREATS AND OPPORTUNITIES
                        Unfortunately, Dallas’s urban forest resource is at risk. Diffused management, pests
                        and disease, and rapid urban development pose serious threats to the city’s trees.
                        Currently, Dallas has a tree canopy cover of 32%, relatively high for a city of its size.
                        At the same time, the inequitable distribution of tree canopy across the city cause
                        some of its residents to be deprived of the key benefits of these trees altogether.
                        As trees grow, their benefits supplied increase exponentially, meaning preservation
                        of mature trees is critical, and the planting of new trees is urgently needed to supply
                        future benefits. Dallas’s unique urban forest, composed of trees on both private
                        and public property, in parks, medians, and in the 6,000-acre Great Trinity Forest,
                        must be properly managed to ensure the greatest benefit for the City’s inhabitants.
                        Furthermore, as opportunities, such as carbon credits and cap-and-trade programs,
                        become increasingly viable, the value of a healthy, well managed forest resource
                        will continue to grow. Currently, a decentralized governance structure with varying
                        management strategies and a lack of focused resources and action, cause the City’s
                        urban forest resource to be underutilized and threatened.

6                                                                                                                    7
Dallas Urban Forest Master Plan 2021 - City of Dallas
ONE TRILLION
    A PLAN FOR ACTION                                                                                 TREES INITIATIVE
    A sound plan for the management of the urban forest is critical to ensure the resource is
                                                                                                      In 2020, the City of Dallas joined the
    protected, maintained, and grown. Building on decades of high-quality local and national
    urban forest research, this Urban Forest Master Plan (UFMP, the Plan), sets a strategic           World Economic Forum’s One Trillion
    and cohesive agenda to improve urban forest management across the City of Dallas.                 Trees Initiative to plant one trillion
    Informed by the State of the Dallas Urban Forest assessments performed by the Texas
                                                                                                      trees worldwide by 2030.
    Trees Foundation (2015; 2019), driven by goals outlined in the Dallas Comprehensive
    Environmental and Climate Action Plan (2020), Dallas’s commitment to the World
                                                                                                      Through the Dallas Urban Forestry
    Economic Forum’s One Trillion Trees initiative (2020), the UFMP sets the stage for
    increased and improved urban forest stewardship action.                                           Initiative, the City of Dallas and its

                                                                                                      partners have pledged to:

    MAKING TREES A PRIORITY
    All too often, the urban forest is treated not as an asset, but relegated to a luxury, or              Plant 31,000 trees
    worse, as a hinderance to other land uses and infrastructure. To accomplish the goals
    set out in this plan, trees must be recognized for their full inherent, monetary, health,              Protect 14.7 million
    and cultural values. City decision-makers must recognize these values in the context of                existing trees
    decisions made around funding allocations, infrastructure, zoning, and development, and
    become a priority for city decision-makers in order to ensure the health and longevity                 Facilitate Natural
    of the urban forest. This plan lays out 14 recommendations, with recommended
                                                                                                           Regeneration of
    action steps and timelines, for the City to create a more resilient, well-managed, and
    sustainable urban forest. Without increased, cohesive support, trees will continue
                                                                                                           3.3 million trees
    to be an afterthought, and the City of Dallas will miss extraordinary opportunities to
    enhance the lives and health of its residents through green infrastructure. With herculean
    challenges such as climate change, poor air quality, and rapid development looming on
    Dallas’s doorstep, urban forests provide a key tool to combat issues facing every Dallas
    decision-maker and their constituents. Ultimately, without champions for urban forests at    The Dallas Urban Forest Master
    the political and management levels of the City of Dallas, the opportunities and benefits
                                                                                                 Plan can help meet this pledge.
    of urban forestry will not be realized.

    Dallas is at a crossroads. Is it going to continue down a path towards intolerable outdoor   For information on the Initiative
    activities in summer months? Or will it respond to the challenges of a super-heated          and Dallas’s pledge, visit 1t.org.
    city head-on by managing and aggressively taking action for its urban forest, so that a
    summer walk can be along cool, green, healthy tree-lined streets.

8                                                                                                                                              9
Dallas Urban Forest Master Plan 2021 - City of Dallas
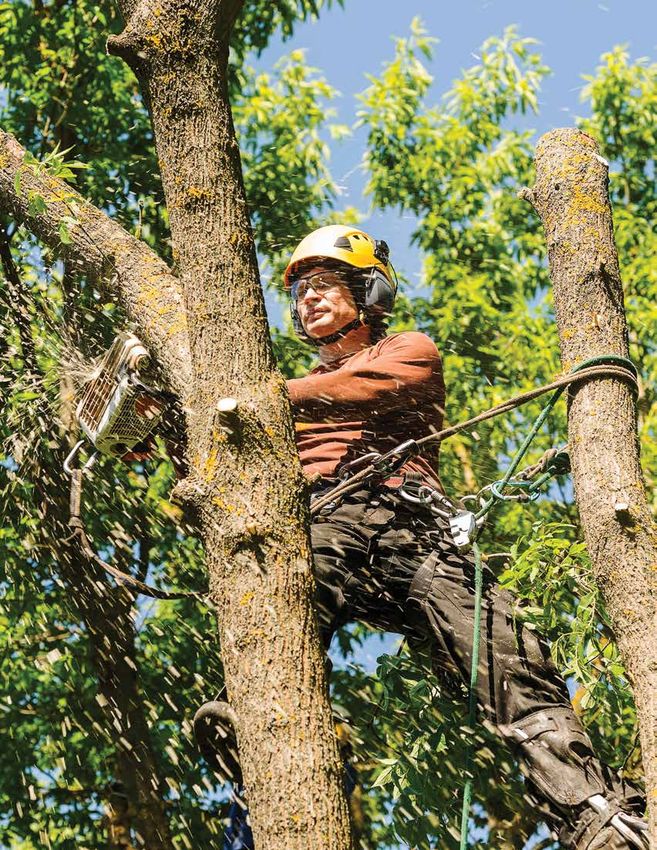
DALLAS’S URBAN FOREST MASTER PLAN                                                             DALLAS URBAN FOREST MASTER PLAN RECOMMENDATIONS
     Trees are an important part of the solution in addressing the challenges facing Dallas          1. Complete a comprehensive tree inventory of all right-of-way and park trees.
     and making the city sustainable and resilient. However, to harness and maximize the
     benefits the urban forest provides, trees must become a priority in Dallas. Adoption of         2. Centralize the City of Dallas’s urban forestry programs and activities.
     the Dallas Urban Forest Master Plan is the first step in making trees a priority, and
                                                                                                     3. Create a Storm Response and Recovery Plan for the City of Dallas.
     action on its recommendations is the next.
                                                                                                     4. Strengthen and support existing relationships and partnerships.
     The foundation and direction of the Plan was established based on a set of priorities,
     themes, and guiding principles identified through input and feedback from a wide range          5. Work towards development of a City Urban Forest Management Plan.
     of stakeholders and the community at large. Using these themes, priorities, and guiding
     principles, the Plan is designed to move Dallas towards a sustainable and resilient urban       6. Ensure Dallas regulations, best-management practices, and guidelines are in place
     forest by proactively managing, preserving, caring for, and growing the city’s tree canopy.         to support tree canopy growth, protection, and preservation.

                                                                                                     7. Develop and implement a strategy to maximize investment and resources to
     The Urban Forest Master Plan will help Dallas to:                                                   meet Dallas’s desired level of service for urban forestry programs and management.
        Plan for a sustainable and resilient urban forest by developing strategies and               8. Create a plan to strategically plant and care for trees to ensure equitable access to
         policies that align with internationally-established best management practices.                 tree canopy across Dallas.
         Manage tree maintenance, care, and tree planting activities more effectively by             9. Create and implement a management program to monitor and address
         improving data, technology, communication, decision-making, and collaboration.                  environmental threats to Dallas’s urban forest.
         Protect the urban forest and maximize the benefits it provides, by ensuring                 10. Develop and implement a public engagement, outreach, and education plan.
         systems are in place to support its long-term growth, preservation, and care.
                                                                                                     11. Formulate a strategy to manage wood waste and identify the highest and best
         Grow the urban forest in an equitable and sustainable manner to ensure that all                 use of wood from trees removed by the City of Dallas.
         Dallas residents have access to trees and the benefits they provide.
                                                                                                     12. Strengthen working relationships and partnerships with private utilities,
         Engage and connect with the community about the important role that they play in                organizations, and contractors whose activities impact trees by instituting regular
         the growth, preservation, and care of Dallas’s trees.                                           dialogue and project coordination.

                                                                                                     13. Enhance and develop programs that encourage and support active
     DALLAS URBAN FOREST MASTER PLAN GOALS
                                                                                                         participation by residents and volunteers in the planting and care of
         1.   Create a healthy, equitable, and resilient urban forest through proper planning
                                                                                                         Dallas’s urban forest.
              and implementation of management strategies that maximize the benefits that
              Dallas’s trees provide.                                                                14. Review and update the Great Trinity Forest Management Plan.
         2. Protect and grow tree canopy in Dallas to reduce temperatures, improve air
            quality, and address the most pressing challenges facing the city.

         3. Achieve the Dallas Comprehensive Environmental and Climate Action Plan target
            of 37% tree canopy cover by 2040.

         4. Actively engage with the community about the instrumental role they play in
            caring and growing Dallas’s urban forest and making trees a priority.

10                                                                                                                                                                                              11
Dallas Urban Forest Master Plan 2021 - City of Dallas
SECTION 1: Introduction   In 2019, the Texas Trees Foundation and the City
                               of Dallas embarked on a project to develop the
                               city’s first Urban Forest Master Plan (UFMP/Plan).
                               The goal of the Plan is to provide a unified vision
                               and framework to manage Dallas’s urban forest
                               as a sustainable community asset.

12                                                                                   13
Dallas Urban Forest Master Plan 2021 - City of Dallas
WHY DEVELOP AN URBAN
     FOREST MASTER PLAN?
     Dallas’s urban forest is made up of all the trees that               THE PLANNING
     surround us every day, those growing around our homes and
     workplaces, along streets, in City parks, and in the Great Trinity
     Forest. Studies conducted by the Texas Trees Foundation
                                                                          PROCESS
     estimate that Dallas has over 14.7 million trees (Texas Trees
                                                                          The development of the Dallas Urban
     Foundation, 2015) and a tree canopy cover of 32% (Texas
     Trees Foundation, 2019).                                             Forest Master Plan was based on
                                                                          answering four key questions:
     An abundant and healthy urban forest has been shown
     to reduce city temperatures, improve air quality, manage
                                                                                  What Do We Have?
     stormwater, positively impact human health, and mitigate
     the effects of climate change, serving as an important tool in
     helping to address many of the challenges facing Dallas today                What Do We Want?
     (Bastin, 2019; Johnson, 2017; Ulmer, 2016). The City of Dallas
     Comprehensive Environment and Climate Action Plan (2020)
     cites trees as an important solution in making Dallas a more                 How Do We Get There?
     equitable, sustainable, and climate resilient city.

                                                                                  How Are We Doing?
          Dallas’s 14.7 million trees
          have a replacement value
                                                                          This structure, termed “adaptive
          of $9 billion.
               Texas Trees Foundation 2015 State of the                   management,” is commonly used for
                             Dallas Urban Forest Report
                                                                          resource planning and management

     While trees are an important solution in helping to address          and provides a useful conceptual
     the challenges facing Dallas, they can only be effective if their    framework for managing Dallas’s
     care, management, and preservation become a priority.                urban forest resource (Miller, 1998).
     The Dallas Urban Forest Master Plan serves as guide to make
     this happen by providing additional insights into the current
     state of Dallas’s urban forest and outlining recommendations
     and actions to proactively manage, care, protect, and grow
     the city’s tree canopy. It provides a shared vision for the
     future of the urban forest to inspire us all to plant, care for,
     and protect Dallas’s trees.

14                                                                                                                15
Dallas Urban Forest Master Plan 2021 - City of Dallas
TREES WORK
     Trees and the urban forest are constantly         depression to weight gain and heart disease,
     working to improve and enhance our health,        trees are proving to be a low-cost solution in
     environment, and quality of life.                 helping to mitigate these health problems.

     Trees Make Cities More Livable. Large,            Trees Can Save Lives. A study of the health
     healthy trees are a key component in              impacts that trees have on air pollution
     making cities more livable and improving the      removal finds trees save over 850 lives
     quality of life for its residents. Decreasing     and prevent 670,000 incidents of acute
     summer temperatures, reducing flooding,           respiratory symptoms in the United
     and improving the air we breathe are part of      States each year (Nowak et al., 2014).
     the range of environmental, economic, and
     social benefits trees provide.                    Trees Reduce Temperatures. Shade from
                                                       large, healthy mature trees reduces the
     Trees and greenspace enhance                      amount of sunlight that is absorbed and
     neighborhoods by strengthening ties               stored by impervious surfaces (like roads
     between neighbors, encouraging outdoor            and buildings), while their leaves release
     play by children, reducing crime, and             water vapor (transpiration) cooling the
     providing an overall sense of safety (Kuo,        surrounding area. Through shade and
     2003). A 10% increase in neighborhood             transpirational cooling, trees modify the
     tree canopy cover has been associated             environment and reduce urban heat island
     with a 12-15% reduction in violent and            effects. The Texas Trees Foundation’s 2017
     property crimes (Gilstad-Hayde, 2015; Troy,       Urban Heat Island Management Study for
     2012). Tree canopy cover near and around          Dallas found:
     middle schools has been associated with
     higher standardized student test scores in         • tree preservation and planting
     reading and math (Kuo, 2021).                        is the most effective strategy in
                                                          lowering temperatures in Dallas. The
     Trees Improve Human Health. People                   cooling benefits from trees reduces
     living in neighborhoods with more tree               temperatures by up to 15° F in some
     canopy cover have been shown to have                 areas of Dallas.
     better overall health, including lower rates of
     obesity, more social cohesion, less stress,        • planting and caring for 250,000 new
     and lower blood pressure (Roe, 2013; Ulmer,          trees in Dallas can provide significant
     2016). Residents that self-reported their            cooling and health benefits. Increased
     mental health as “poor” decreased 63%                tree canopy can reduce nighttime
     18 months after vacant lots near their               temperatures by more than 2° F,
     homes were planted with grass and trees.             reducing the stress on respiratory and
                                                          cardiovascular systems and allowing
     With the negative impacts of chronic                 the body to recover from high heat
     stress on human health, from anxiety and             exposure during the day.

16                                                                                                      17
Dallas Urban Forest Master Plan 2021 - City of Dallas
Trees Can Lower Electricity Bills. Trees        monoxide, nitrogen dioxide, and particulate
     planted in proper locations around a home       matter (USDA Forest Service iTree MyTree).
     can reduce energy costs by $100 to $250
     per year for the average household. While       Trees Help Reduce the Effects of Climate
     shading air conditioning units can help them    Change. Trees reduce greenhouse
     run up to 10% more efficiently, reducing        gases that can trap and retain heat in
     energy use (U.S. Department of Energy).         the atmosphere, causing the city to
                                                     get warmer. Carbon dioxide, a major
                                                     greenhouse gas, is absorbed (sequestered)
          A large, healthy live
                                                     in tree trunks, branches, leaves, and roots
          oak tree can remove
                                                     during photosynthesis. The amount of
          nearly 5 pounds of
                                                     carbon that can be stored is directly related
          pollutants from the                        to the size of the tree, meaning larger
          air each year.                             trees store more carbon (Gomez & Barton,
                                                     2013). A large, healthy live oak tree (Quercus     Trees Reduce Stormwater Runoff                  pollen and nectar to hundreds of species
     Trees Improve Air Quality. Trees serve an       virginiana) stores 3.5 times more carbon over      and Improve Water Quality. Existing             of native bees and other pollinators, and
     important function in improving air quality,    its lifetime than a small, healthy, mature crape   stormwater management systems are not           their canopies provide food and shelter to
     reducing pollutants, and helping to lessen      myrtle (Lagerstroemia indica) (iTree MyTree).      always adequate to accommodate runoff;          a variety of wildlife.
     the public health effects of air pollution.                                                        when a system is overtaxed, peak flows
     Trees intercept and filter particulate matter   The Dallas Comprehensive Environmental             can cause stormwater to back up and             Texas provides habitat for nearly 70% of
     from the air, including dust, ash, pollen,      Climate Action Plan (2020) established             cause flooding. During storm events trees       North American bird species (Audubon
     and smoke. They absorb harmful gaseous          targets to reduce greenhouse gas                   intercept rainfall in their canopies acting     Texas). Dallas is along migration routes
     pollutants like ozone, nitrogen dioxide, and    emissions. Proper investments in tree              as a mini reservoir (Xiao et al., 1998).        of songbirds, bats, and insect species
     sulfur dioxide; and reduce ozone formation      planting, care, and preservation can               This intercepted rainfall evaporates from       that use the city’s trees for shelter and
     by shading surfaces and reducing air            ensure that Dallas’s trees reach maturity          leaves or slowly soaks into the ground,         food during their migration.
     temperatures. A large, healthy live oak tree    where their larger sizes can help achieve          reducing and slowing stormwater runoff,
     (Quercus virginiana) growing in Dallas can      these targets and maximize the important           and lessening erosion. While underground,       Trees Make Economic Sense. The
     remove nearly 5 pounds of pollutants from       benefits they provide.                             the growth and decomposition of tree            economic benefits trees provide reflect
     the air each year – including ozone, carbon                                                        roots helps to increase the amount of           both their importance, and the value that
                                                                                                        water the soil can hold, allowing for greater   people place on having trees in cities.
                                                                                                        absorption of rain (McPherson et al., 2002).    Mature, healthy trees can increase property
                                                                                                        Each of these processes greatly reduces         values, for both residential and commercial
                                                                                                        stormwater runoff, reducing flooding and        properties, by an average of 10% (USDA
                                                                                                        erosion, and preventing sediments and           Forest Service, 2011). A study in Riverside,
                                                                                                        pollutants from entering waterways.             CA found that the property value of a
                                                                                                                                                        residential lot adjacent to a preserved oak
                                                                                                        Allowing rainwater to slowly soak into          woodland was 17% higher than a property
                                                                                                        the ground where it lands can reduce            that was 1,000 feet away from it. The
                                                                                                        stormwater runoff and pollutants by 20          preserved oak woodland also increased
                                                                                                        to 60 percent (Johnson et al., 2017).           the overall value of the community
                                                                                                                                                        (Standiford, 2001). Researchers have also
                                                                                                        Trees Support Wildlife. Trees provide           found that shoppers spend more time
                                                                                                        critical habit for birds, mammals, reptiles,    and money in shopping districts that have
                                                                                                        insects, fish, and other aquatic species.       mature, healthy tree canopy (Wolf, 2005).
                                                                                                        Their flowers provide a valuable source of

18                                                                                                                                                                                                     19
BENEFITS OF TREES – BY THE NUMBERS
                     While some of the benefits that trees provide cannot be measured, like how they make a       intercepts 36% more stormwater than a 12” crepe myrtle, while a crepe myrtle absorbs
                     person feel, there are many benefits that can be valued and quantified. To introduce these   67% more carbon dioxide than a redbud. A 24” live oak has stored over 21,000 pounds
                     benefits, an analysis using the iTree MyTree tool was conducted on four tree species         of carbon in its trunk and branches over its lifetime; however, as it matures its ability to
                     commonly found in Dallas - redbud (Cercis canadensis var. texensis), crepe myrtle            absorb large amount of carbon dioxide each year is significantly reduced. Planting and
                     (Lagerstroemia indica), cedar elm (Ulmus crassifolia), and live oak (Quercus virginiana).    maintaining a diversity of tree species is the key to maximizing the benefits trees
                                                                                                                  provide and creating resiliency in Dallas’s urban forest.
                     As the analysis illustrates (Figure 1), different tree species provide different levels of
                     benefits depending on their size, structure, form, and age. For example, an 8” redbud

     Figure 1. Benefits of four common tree species in Dallas.
     The larger the tree, the greater the benefits.

20                                                                                                                                                                                                               21
DALLAS IS FACING CHALLENGES

     RESEARCH                                                                                                                              Dallas is Getting Hotter. One effect of climate change already being felt in Dallas is an
                                                                                                                                           increase in the number of days above 100° F (high heat days). Between 1960 and 2019, the
     Tree Canopy, Crime & Health                                                                                                           average number of high heat days in Dallas increased 58%, and 2011 saw a record-breaking 71
                                                                                                                                           high heat days (National Weather Service Climatology). This trend is predicted to continue and
     TREES IMPROVE                                                     TREES HELP MAKE                                                     by 2050, Dallas could have 30 to 60 more days per year with temperatures over 100° F
     HUMAN HEALTH                                                      NEIGHBORHOODS SAFER                                                 (US Global Change Research Program, 2018).
     New York City The presence of street trees was                    Portland, OR Street trees planted in neighbor-
     associated with a lower prevalence of asthma                      hoods with single-family homes were associated                      In the United States, extended periods of high temperatures, heavy rain events, severe
     in early childhood.                                               with lower crime.                                                   flooding, and droughts have increased over the last 50 years (US Global Change Research,
     Lovasi, G. S., J.W. Quinn, K.M. Neckerman, M.S. Perzanowski,      Donovan, G. H. and Prestemon, J. P. (2012). The effect of trees     2018). As Dallas temperatures increase and the climate changes, extreme and unpredictable
     and A. Rundle. 2008. Children Living in Areas With More           on crime in Portland, Oregon. Environment and Behavior,
     Street Trees Have Lower Prevalence of Asthma. Journal of          44 (1), 3–30.
                                                                                                                                           weather patterns with which residents are all too familiar, are forecasted to increase in
     Epidemiology and Community Health 62: 647-49.                                                                                         frequency, intensity, and duration in the coming decades (City of Dallas, 2020). In 2019, Dallas
                                                                       Baltimore, MD A 10% increase in tree canopy                         experienced two of these events in less than 6 months: the June 9, 2019 storm that produced
     United States Mortality rates due to cardiovascular               was associated with a 12% decrease in crime                         straight-line winds and the October 20, 2019 tornadoes that touched down in North Dallas.
     and lower respiratory disease increased in counties               (robbery, burglary, theft, and shooting). Tree
     that lost trees due to the emerald ash borer.                     canopy on public land provided a greater                            Why does it matter? High temperatures in cities contribute to a phenomenon called
     Donovan, G.H., D.T. Butry, Y.L. Michael, J.P. Prestemon, A.M.     benefit than private lands.
                                                                                                                                           the urban heat island. An urban heat island occurs, when impervious surfaces, like roads,
     Liebhold, D. Gatziolis, and M.Y. Mao. 2013. The Relationship      Troy, A., J.M. Grove and J. O’Neil-Dunn. 2012. The relationship
     Between Trees and Human Health: Evidence From the Spread          between tree canopy and crime rates across an urban–rural
                                                                                                                                           buildings, and sidewalks, trap and hold heat causing air temperatures to be hotter than nearby
     of the Emerald Ash Borer. American Journal of Preventive          gradient in the greater Baltimore region. Landscape and             areas that are less built-up and have more greenspace (Figure 2). According to the United
     Medicine 44, 2: 139-145.                                          Urban Planning 106: 262–270.                                        States Environmental Protection Agency, a city which has extensive areas of impervious
                                                                                                                                           surfaces can be 1-7° F warmer than surrounding suburban areas during the day and up to 5°
     Pennsylvania Patients with views of trees outside                 Philadelphia, PA Neighborhoods with abundant                        F warmer at night. In Dallas, the Texas Trees Foundation’s Urban Heat Island Management
     their hospital room had shorter hospitalizations                  vegetation had lower rates of crime (assault,
     and required less medication than patients who                                                                                        Study determined that densely developed areas of the city with high amounts of impervious
                                                                       robbery, and burglary) than areas with sparse or
     had a view of a brick wall.                                       no vegetation.                                                      surfaces and low tree canopy cover were up to 9° F warmer during the day and up to 4° F
     Ulrich, R.S. 1984. View Through a Window May Influence            Wolfe, M. K. and Mennis, J. (2012). Does vegetation encourage       warmer at night than less built-up areas (2017).
     Recovery from Surgery. Science 224 (4647): 420-1.                 or suppress urban crime? Evidence from Philadelphia, PA.
                                                                       Landscape and Urban Planning. 108 (2-4), 112-122.

     England Health inequities and mortality in low
     income populations were lower for those living in
     the greenest areas.                                                                                                                                                                                    90°+
                                                                                                                                                                          85°
     Mitchell, R. and F. Popham. 2008. Effect of Exposure to Natural
     Environment on Health Inequalities: An Observational
     Population Study. The Lancet 372: 1655-660.

                                                                                                                                                   75°

                                                                                                                                                                                                                                                               70°

                                                                                                                                                                          Figure 2. Illustration of the urban heat island effect in Dallas.
                                                                                                                                         Higher temperatures are shown downtown where there are more buildings and roads (impervious surfaces) and less tree canopy cover.
                                                                                                                                                  Moving away from downtown, as tree canopy increases and impervious surfaces decrease, temperatures are lower.

22                                                                                                                                                                                                                                                                           23
With over 40% of the City of Dallas’s land
     covered with impervious surfaces and other
                                                      Extreme weather events caused by
                                                      increasing temperatures can also impact
                                                                                                       Trees at work.
     non-vegetated cover – as identified in the       the health, safety, and well-being of Dallas’s   On the job 24/7.
     2019 urban tree canopy assessment update         residents. The effects of these events on
     (Texas Trees Foundation, 2019) – urban heat
     island impacts can be significant and include:
                                                      residents are complex and dependent on
                                                      the elements of vulnerability – exposure,
                                                                                                       Shade from trees reduces the
       • Negative Health Effects. As
                                                      sensitivity, and adaptive capacity (U.S.
                                                      Global Change Research, 2016). For
                                                                                                       amount of heat absorbed and
         temperatures increase, respiratory
         difficulties (e.g., asthma), heat
                                                      example, a neighborhood with low tree
                                                      canopy cover that experiences a heat wave
                                                                                                       stored by impervious surfaces
         stroke, and heat-related mortality
         also increase. For every 1° F
                                                      (exposure), that has residents that are
                                                      at high risk for heat-related illnesses due
                                                                                                       (e.g., roads and buildings),
         increase in temperature during a
         heat wave, there is a 2.5% increase
                                                      to heart disease (sensitivity), and do not
                                                      have the resources to cool their homes
                                                                                                       while transpiration releases
         in the risk of heat-related mortality
         (Anderson et al., 2011). Heat-related
                                                      (adaptive capacity) are more vulnerable
                                                      than neighborhoods that may have only
                                                                                                       water vapor from tree canopies
         illnesses cause more deaths in
         the United States each year than
                                                      one element of vulnerability. Developing
                                                      and having access to the tools, skills, and
                                                                                                       cooling the surrounding area.
         any other natural disaster (e.g.,
         hurricanes, lightning, tornadoes,
                                                      strategies to adjust to and/or address the
                                                      consequences of these events, building
                                                                                                       Through shade and transpiration,
         floods, earthquakes) (Borden &
         Cutter, 2008).
                                                      adaptive capacity is a key to creating
                                                      resiliency in Dallas.
                                                                                                       trees can reduce temperatures
       • Increased Ozone Levels. Ground               Trees are an important tool in reducing
                                                                                                       and heat island effects.
         level ozone is created by chemical           stressors that impact vulnerable
         reactions of atmospheric gases and
         compounds with sunlight and heat.
                                                      populations, such as heat, poor air quality,
                                                      and flooding, and helping to build adaptive
                                                                                                       The Dallas Urban Heat Island
         The hazy skies seen in Dallas during
         high-heat days are caused by ground
                                                      capacity. However, trees are also impacted
                                                      by high temperatures and extreme weather
                                                                                                       Management Study (Texas Trees
         level ozone.                                 events. Ensuring that trees are properly
                                                      cared for and maintained can reduce the
                                                                                                       Foundation, 2017) found that
       • Higher Energy Usage. When the
         city gets hotter, there is an increase
                                                      risk that extreme weather can have on their
                                                      condition and ability to withstand storms
                                                                                                       planting a minimum of 250,000
         in electricity used to cool homes
         and businesses, resulting in higher
                                                      (Richards et al., 2004).
                                                                                                       trees in Dallas could reduce
         energy bills.
                                                                                                       nighttime temperatures by 2° F.

24                                                                                                                                        25
Dallas is Growing (Fast). Dallas is             Dallas Urban Heat Island Management
                                                     a thriving and diverse city in the Dallas-      Study (2017) found that an 11% loss in
                                                     Fort Worth (DFW) metroplex that has             tree canopy in this area is projected to
                                                     experienced rapid growth over the last          increase temperatures by more than 1°F
                                                     decade. The population of the DFW region        and decrease overall city canopy cover by
                                                     is 6.3 million with an estimated 1.3 million    1.4%. This will negatively affect the health
                                                     people calling the city of Dallas home –        and well-being of residents who may not
                                                     making it the 9th largest city in the United    have the economic or social resources to
                                                     States (United State Census Bureau). With       escape the heat, increasing their vulnerability.
                                                     growth expected to continue in the DFW

     Trees at work.                                  area over the next decade, the population
                                                     is projected to increase by nearly 1.4
                                                                                                     Dallas’s Air Can Make It Hard to
                                                                                                     Breathe. Ozone is naturally found in
     Transforming the world around us.               million people by 2029 (Egan, 2020). New
                                                     development will be needed to meet the
                                                                                                     the upper atmosphere where it protects
                                                                                                     the Earth from the sun’s ultraviolet
                                                                                                     radiation. While it is beneficial in the upper
     Trees help to reduce effects of climate         housing, retail and employment needs of
                                                     new residents.                                  atmosphere, at ground level, ozone is an
                                                                                                     air pollutant that causes serious harm to
     change by reducing greenhouse gases that        Why does it matter? The majority of             human health. Ground level ozone is formed
                                                                                                     by a chemical reaction between nitrogen
     can trap and retain heat in the atmosphere.     the city’s undeveloped land is located in
                                                     Dallas’s southern neighborhoods, where          oxides and volatile organic compounds
                                                                                                     (VOCs), and sunlight. Add heat and ozone
     Carbon dioxide, a major greenhouse              more than 1/3 of the city’s tree canopy
                                                     cover is located and significant populations    formation is exacerbated. VOCs are a
                                                                                                     class of carbon-based particles emitted from
     gas, is absorbed (sequestered) in tree          of economically and medically vulnerable
                                                     residents live (City of Dallas, 2006). As       automobile exhaust, lawnmowers, human
                                                                                                     activities, and even some tree species.
     trunks, branches, leaves, and roots during      development occurs in these areas, there
                                                     is a significant risk of tree canopy loss
                                                                                                     Particulate matter (PM) is the dust, pollen,
     photosynthesis. The amount of carbon            and an increase in roads and buildings
                                                     (impervious surfaces). As tree canopy is lost   soot, smoke, and chemicals floating in the
                                                                                                     air. Fine particulate matter (PM2.5) is most
     that can be stored is directly related to the   and impervious surfaces increase, there will
                                                     be more hard surfaces to trap and retain        harmful to human health because of its
                                                                                                     ability to be inhaled and get deep into lung
     size of the tree - meaning larger trees store   heat, which will lead to higher temperatures
                                                     and an increase in the urban heat island        tissue and sometimes even the bloodstream.

     more carbon (Gomez & Barton, 2013).             effect in an area that currently does not
                                                     experience it. The Texas Trees Foundation

26                                                                                                                                                      27
Dallas has faced challenges meeting Federal     Individually, the effects of these air pollutants
     air quality standards and currently does not    can have a significant impact on human
     meet the 2008 and 2015 Federal air quality      health. In combination, their effects are
     standards for ground level ozone – current      exacerbated. Populations most vulnerable to
     compliance status “non-attainment.” The         these pollutants are children, older adults,
     2020 American Lung Association State of         and those with pre-existing lung or heart
     Air report gave Dallas County an “F” grade      disease. Economically and socially vulnerable
     for ozone and a “C” grade for particulate       populations tend to live closer to industrial
     matter. In 2019, there were 23 days where       areas that produce fine particulate matter
     ozone levels and 5 days where particulate       putting those populations at higher risk. A
     matter levels were “unhealthy for sensitive     project by Harvard University researchers
     populations” in Dallas (American Lung           found that people who lived in areas with

                                                                                                         Trees at work.
     Association, 2020).                             historically high levels of particulate matter
                                                     (long-term exposure) had a higher risk of
     Why does it matter? Ground level
     ozone and particulate matter are the two
                                                     mortality from COVID-19. The research found
                                                     that an increase in fine particulate matter in
                                                                                                         Like an environmental processing plant.
     forms of air pollution that have the greatest   the air (1 μg/m3 of PM2.5) was associated
     impact on human health. Exposure to             with an 8% increase in the COVID-19 death           Trees intercept and filter particulate
     ground level ozone and particulate matter       rate (Wu et al., 2020).
     cause similar health effects, including:                                                            matter from the air, including dust, ash,
                                                     As Dallas’s population grows, emissions
       • Premature death in people with              from vehicles are also increasing. Since            pollen, and smoke. They absorb harmful
         heart or lung disease                       1990 emissions from passenger and freight
       • Heart attacks (non-fatal)                   vehicles in Dallas increased 133% (Popvich          gaseous pollutants, like ozone, nitrogen
       • Irregular heartbeat                         and Lu, 2019). This increase in emissions
       • Asthma attacks                              adds more VOCs, leading to the creation             dioxide, and sulfur dioxide, and reduce
       • Decreased lung function                     of more ground level ozone and particulate
       • Irritation of lungs and airways,            matter, which negatively impacts the health         ozone formation by shading surfaces
         coughing or difficulty breathing            and well-being of Dallas’s residents.
                                                                                                         and reducing air temperatures.

28                                                                                                                                                   29
THE GREAT TRINITY FOREST
                                     The Great Trinity Forest, growing along the Trinity River, is a
                                                                                                                THE WAY FORWARD
                                     unique gem in the heart of Dallas. At over 6,000 acres it is the largest   Trees are essential to addressing the challenges facing Dallas and making the city
                                     contiguous city-managed forest in the United States, containing            sustainable and resilient. However, to harness and maximize the benefits the urban
                                     nearly half of all of the trees growing in Dallas (Texas Trees             forest provides, trees must become a priority in Dallas. The Dallas Urban Forest Master
                                                                                                                Plan services as a guide to do just that by offering a vision of the future of the urban
     Photograph by Robert Nunnally   Foundation, 2015). It is a bottomland hardwood forest dominated
                                                                                                                forest to inspire us to care, preserve, plant, and protect Dallas’s trees.
                                     by a mixture of floodplain tree species, including green ash,
                                                                                                                The Plan is designed to move Dallas along the road towards a sustainable and resilient
                                     American elm, and hackberry.
                                                                                                                urban forest by proactively managing, preserving, caring for and growing the city’s
                                                                                                                tree canopy. The next section (Section 2) presents information and data on the current
                                     The Urban Forest Master Plan, while recognizing the significant
                                                                                                                state of the Dallas’s urban forest to help us understand where Dallas’s is today and
                                     role that the Great Trinity Forest plays in Dallas’s urban forest, does    serves as baseline to measure future progress. Section 3 examines the values, needs,
                                     not specifically address its management. Due to its unique nature,         and priorities the Dallas community and stakeholders have around trees and the urban
                                                                                                                forest. The Plan’s recommendations, recommended action steps, and goals which were
                                     ecology, and function within the city, the management needs of
                                                                                                                developed based on community priorities, themes, and guiding principles are presented
                                     the Great Trinity Forest are addressed in the City of Dallas’s 2008        in Section 4. They focus on improving Dallas’s urban forest through planning, managing,
                                     Great Trinity Forest Management Plan. The recommendations of the           protecting, growing, and engaging. Section 5 provides ways to monitor and measure
                                     Urban Forest Master Plan, however, should be applied to the care           Dallas’s progress in improving the urban forest and making it a priority.

                                     and management of the Great Trinity Forest, when appropriate.              Let’s begin by exploring Dallas’s urban forest.

     Photograph by Scot Miller

30                                                                                                                                                                                                         31
SECTION 2:
     State of the Urban Forest

32                               33
WHAT DO WE HAVE?
                                      Landscape                                                     Climate
                                      Dallas, at 386 square miles, is a patchwork                   The National Weather Service classifies
                                      of both natural and urban landscapes,                         Dallas’s climate as humid, subtropical
                                      including roads and buildings, trees and                      with seasonal temperature variations.
                                      lakes, and the city’s defining natural                        August, the city’s hottest month, can see
                                      features, the Trinity River and Great                         high temperatures average 96°F; while, in
                                      Trinity Forest. Prior to its settlement,                      January, its coldest month, temperatures
                                      Dallas’s primary landcover was tall grass                     average 36° F. Between 1960 and 2019,
                                      prairies (Blackland Prairie eco-region) with                  the average number of high-heat days
                                      occasional wooded areas (Crosstimbers                         (days above 100°F) increased 58% from an
                                      eco-region) to the west (Texas Parks and                      average of 14 days per year to 22 days per
                                      Wildlife Department). As the city grew                        year (National Weather Service Climatology).
                                      and developed, the landscape and its                          This trend is predicted to continue and by
                                      rich and fertile native soils were replaced                   2050, Dallas is projected to have an average
                                      with urban soils (USDA Natural Resource                       of 52 days per year above 100°F (US Global
                                      Conservation Service). Urban soils, created                   Change Research Program, 2018).
                                      through development of the land, lack the
                                      structure, profile, and physical properties                   Precipitation amounts vary considerably each
                                      of native soils. They can contain dust and                    year (Figure 3), with an average of 37 inches
                                      rubble from construction activities and can                   (National Weather Service Precipitation). This
                                      be severely compacted, which impacts the                      variability is predicted to continue as Dallas’s
                                      types of tree species that can grow and                       climate changes (NOAA National Center for
                                      thrive in Dallas.                                             Environmental Information).

                                                                             YEARLY AVERAGE RAINFALL
     TOTAL ANNUAL RAINFALL (inches)

                                       60
                                            Average Annual Rainfall (37in)
                                       50

                                       40

                                       30

                                       20

                                       10
                                               00

                                               02

                                               03

                                               04

                                               05

                                               06

                                               07

                                               08

                                               09

                                               10

                                               11

                                               12

                                               13

                                               14

                                               15

                                               16

                                               17

                                               18

                                               19

                                               20
                                               01
                                            20

                                            20

                                            20

                                            20

                                            20

                                            20

                                            20

                                            20

                                            20

                                            20

                                            20

                                            20

                                            20

                                            20

                                            20

                                            20

                                            20

                                            20

                                            20

                                            20
                                            20

                                                                                          YEAR
                                                                       Figure 3. Dallas annual precipitation 2000-2019
                                                                               Source: National Weather Service

34                                                                                                                                                     35
39%                     32%
                           29%
                                                               DALLAS’S URBAN FOREST
                                                               Dallas’s urban forest, which include all trees within the city, are a capital
                                                               infrastructure asset, but unlike other capital assets, the value of the tree
                                                               resource increases over time. The City of Dallas is directly responsible
                                                  Tree Cover
     Non-Vegetated Cover                                       for managing the trees on street medians, parks, The Great Trinity Forest,
                     Pervious Land Cover                       and other City-owned properties. To protect this asset the City needs to
                  Figure 4. Dallas land cover
          Source: Texas Trees Foundation Urban Tree            consider not only those trees that are on public lands but support the
              Canopy Assessment Update (2019)
                                                               70% of trees that reside on private property, whose owners steward
                                                               the resource.

                                                               Urban Tree Canopy and Land Cover Summary
                                                               The amount, location, and distribution of tree canopy is the driving
                                                               force behind Dallas’s urban forest’s ability to produce benefits for the
                                                               community; as tree canopy increases, so do the benefits. In 2019,
                                                               the Texas Trees Foundation completed an updated urban tree canopy
                                                               assessment for communities in Dallas County, including the City of Dallas.
                                                               The assessment used 2016 aerial imagery to measure the amount of tree
                                                               canopy and other land cover across the city. Tree canopy is measured
                                                               as the layer of leaves, branches, and stems of trees and other woody
                                                               plants that cover the ground when viewed from above.

                                                               The following is a summary of tree canopy and land cover in Dallas
                                                               (Figures 4, 5, 6) (Texas Trees Foundation, 2019):
               Figure 5. Dallas land cover map
          Source: Texas Trees Foundation Urban Tree
               Canopy Assessment Update (2019)
            View larger map detail on pg. 121, Appendix A        •   32% of Dallas is covered by tree canopy.

                                                                 •   39% of the city is non-vegetated cover, which includes hard
                                                                     surfaces like roads, parking lots, and buildings (impervious
                                                                     surfaces) and bare soil.

                                                                 •   29% of Dallas is covered by pervious surfaces, like grass and
                                                                     vegetated open space.

                                                                 •   70% of Dallas’s tree canopy is on private
                                                                     residentially-zoned property.

                                                                 •   43% is the average tree canopy cover in Dallas parks.

                                                                 •   58% is the maximum tree canopy cover possible in Dallas if
                                                                     all open areas on public and private property were planted with
                                                                     trees. Important note: not all pervious land is suitable for tree
                                                                     planting, for example: recreational fields and utility corridors.
        Figure 6. Dallas urban tree canopy cover map
      Source: Texas Trees Foundation Urban Tree Canopy
                   Assessment Update (2019)
           View larger map detail on pg. 122, Appendix A

36                                                                                                                                             37
Dallas’s Tree Canopy Cover Compared to Other Cities
                                                                                                                Comparing tree canopy cover, regionally and nationally can help Dallas visualize what an

     BY THE NUMBERS
                                                                                                                increase in tree canopy cover could look like in the city and gain an understanding of how
                                                                                                                other communities preserve and make space for trees. Dallas, at 32%, is above both
                                                                                                                the average tree canopy cover for area communities (28%) and peer U.S. cities (27%)
     Benefits of Dallas’s Urban Forest                                                                          (Figures 7 and 8, respectively).

      DALLAS’S TREE CANOPY PROVIDES $239 MILLION IN BENEFITS EACH YEAR
      The UFMP introduction provided the benefits individual trees provide to Dallas. This section explores
      the cumulative benefits that all of the City’s trees, Dallas’s urban forest, provide to the community.                                  TREE CANOPY COVER: DALLAS AREA COMMUNITIES
                                                                                                               50
      The urban forest benefits were calculated by analyzing the 2019 urban tree canopy assessment using
                                                                                                                                                                                                                    45%
                                                                                                                     Average Tree Canopy Cover (28%)
      i-Tree Canopy and i-Tree Hydro, the USDA Forest Service programs that quantify tree benefits.
                                                                                                               40                                  38%
                                                                                                                                                                                                                                                                               37%

                                                                                                                                                                                       33%
               239 MILLION IN ANNUAL ENVIRONMENTAL BENEFITS                                                                      32%                                32%

               $179 in annual benefits per resident                                                            30
                                                                                                                                                           26%               26%                          25%                                                           25%
                                                                                                                                                                                                                                                   23%
                                                                                                                                                                                                  22%                                                        22%
               96,000 TONS                                                                                                                                                                                                     20%
                                                                                                                                                                                                                                           21%
                                                                                                               20                        19%
                                                                                                                                                                                                                                                                                           18%
               Amount of carbon absorbed by Dallas’s trees each year—helping to reduce the                           17%

               amount of greenhouse gases in the atmosphere
               Annual Value: $8.62 million                                                                     10

               1.3 BILLION GALLONS

                                                                                                                    n

                                                                                                                                       on

                                                                                                                                                  ill

                                                                                                                                                          l
                                                                                                                                                                 AS

                                                                                                                                                                          to

                                                                                                                                                                                    le

                                                                                                                                                                                              h

                                                                                                                                                                                                         nd

                                                                                                                                                                                                                    rk

                                                                                                                                                                                                                           ns

                                                                                                                                                                                                                                       g

                                                                                                                                                                                                                                                  r

                                                                                                                                                                                                                                                            tt

                                                                                                                                                                                                                                                                    e

                                                                                                                                                                                                                                                                               rk

                                                                                                                                                                                                                                                                                        er
                                                                                                                            gs

                                                                                                                                                         el

                                                                                                                                                                                                                                                 te
                                                                                                                    so

                                                                                                                                                                                             nc

                                                                                                                                                                                                                                     in

                                                                                                                                                                                                                                                                   al
                                                                                                                                                                                                                                                         le
                                                                                                                                               rH

                                                                                                                                                                                   vil
                                                                                                                                                                       So

                                                                                                                                                                                                                Pa

                                                                                                                                                                                                                                                                              Pa

                                                                                                                                                                                                                                                                                     ilm
                                                                                                                                                         pp

                                                                                                                                                                                                                          hi
                                                                                                                           rin

                                                                                                                                       llt

                                                                                                                                                                                                        rla

                                                                                                                                                                                                                                                 as
                                                                                                                                                                                                                                    Irv

                                                                                                                                                                                                                                                                   yv
                                                                                                                                                                                                                                                         w
                                                                                                                                                              LL
                                                                                                                di

                                                                                                                                                                                         ra
                                                                                                                                                                               an

                                                                                                                                                                                                                         tc
                                                                                                                                  rro

                                                                                                                                              da

                                                                                                                                                                      De
                                                                                                                                                    Co

                                                                                                                                                                                                                                                                                   W
                                                                                                                                                                                                                                                      Ro
                                                                                                                         Sp

                                                                                                                                                                                                   Ga

                                                                                                                                                                                                              nd

                                                                                                                                                                                                                                            nc

                                                                                                                                                                                                                                                                         ity
               Number of gallons of stormwater trees intercept and absorb in their canopies and

                                                                                                                                                                                                                                                              nn
                                                                                                               Ad

                                                                                                                                                                                       sB

                                                                                                                                                                                                                     Hu
                                                                                                                                                           DA

                                                                                                                                                                             nc
                                                                                                                                         Ce
                                                                                                                                 Ca

                                                                                                                                                                                                                                                                        rs
                                                                                                                                                                                                          la

                                                                                                                                                                                                                                        La

                                                                                                                                                                                                                                                             Su
                                                                                                                     h

                                                                                                                                                                          Du

                                                                                                                                                                                    er

                                                                                                                                                                                                                                                                    ive
                                                                                                                                                                                                         gh
                                                                                                                    lc
               roots—helping to reduce the amount entering Dallas’s storm sewer system

                                                                                                                                                                                   rm
                                                                                                                Ba

                                                                                                                                                                                                        Hi

                                                                                                                                                                                                                                                                   Un
                                                                                                                                                                               Fa
               Annual Value: $221 million                                                                                                                     Figure 7. Tree canopy cover in Dallas area communities
                                                                                                                                               Source: Texas Trees Foundation Urban Tree Canopy Assessment Update (2019)
               1.3 MILLION POUNDS
               Amount of air pollutants (ozone, nitrogen dioxide, sulfur dioxide, and carbon
               monoxide) trees remove from the atmosphere, helping to reduce atmospheric
               warming, improving air quality and public health effects from air pollution
                                                                                                                                                                 TREE CANOPY COVER: U.S. CITIES
               Annual Value: $5.3 million
                                                                                                               50          48%
               1.5 MILLION POUNDS                                                                                                                                                                                                     Average Tree Canopy Cover (27%)
               Amount of partiulate matter trees trap and remove from Dallas’s air each year,                                                                                                                                                                40%
               improving air quality and public health                                                         40                       38%
                                                                                                                                                                                                                                                                         37%

               Annual Value: $4.6 million                                                                                                                     32%
                                                                                                                                                                                                                                                                                     30%
                                                                                                               30
                                                                                                                                                                                              25%
                                                                                                                                                                                                              23%
                                                                                                                                                                                                                                     22%
                                                                                                               20                                  18%                             18%
                                                                                                                                                                                                                                                  19%
                                                                                                                                                                       16%
                                                                                                                                                                                                                         13%

                                                                                                               10

                                                                                                                         a

                                                                                                                                                  o

                                                                                                                                                          AS

                                                                                                                                                                     er

                                                                                                                                                                                   n

                                                                                                                                                                                             es

                                                                                                                                                                                                          s

                                                                                                                                                                                                                     x

                                                                                                                                                                                                                                    s

                                                                                                                                                                                                                                                 d

                                                                                                                                                                                                                                                            h

                                                                                                                                                                                                                                                                    ille

                                                                                                                                                                                                                                                                                   is
                                                                                                                                       in

                                                                                                                                                                                                         an

                                                                                                                                                                                                                    ni

                                                                                                                                                                                                                                bu
                                                                                                                         nt

                                                                                                                                               ag

                                                                                                                                                                               to

                                                                                                                                                                                                                                             an

                                                                                                                                                                                                                                                         rg

                                                                                                                                                                                                                                                                                ol
                                                                                                                                   st

                                                                                                                                                                    nv

                                                                                                                                                                                             el

                                                                                                                                                                                                                    oe

                                                                                                                                                                                                                                                                   sv
                                                                                                                     la

                                                                                                                                                                             us

                                                                                                                                                                                                                                                        bu
                                                                                                                                                         LL

                                                                                                                                                                                                                                                                               ap
                                                                                                                                                                                                        le

                                                                                                                                                                                                                               m
                                                                                                                                 Au

                                                                                                                                              ic

                                                                                                                                                                                                                                            el
                                                                                                                                                                                         ng
                                                                                                                                                                 De
                                                                                                                    At

                                                                                                                                                                                                                                                                   ui
                                                                                                                                                                                                   Or

                                                                                                                                                                                                                Ph

                                                                                                                                                                                                                               lu
                                                                                                                                             Ch

                                                                                                                                                                          Ho

                                                                                                                                                                                                                                        ev

                                                                                                                                                                                                                                                      tts

                                                                                                                                                                                                                                                                              ne
                                                                                                                                                    DA

                                                                                                                                                                                    sA

                                                                                                                                                                                                                                                              Lo
                                                                                                                                                                                                                          Co

                                                                                                                                                                                                                                      Cl
                                                                                                                                                                                                  w

                                                                                                                                                                                                                                                  Pi

                                                                                                                                                                                                                                                                          in
                                                                                                                                                                                   Lo

                                                                                                                                                                                              Ne

                                                                                                                                                                                                                                                                         M
                                                                                                                                                                    Figure 8. Tree canopy cover in select U.S. cities
                                                                                                                                                          Sources: Davey Resource Group and publicly available city data

38                                                                                                                                                                                                                                                                                               39
Tree Canopy Across the City
     Tree canopy varies across the city (Figures 9 and 10) with
     Council Districts ranging from 17% to 43% canopy cover.
     This variability highlights that there is not a one-size-fits-all
     solution to growing Dallas’s tree canopy and ensuring that
     all residents have access to the benefits trees provide.

     Southern Dallas where tree canopy cover is high, is also
     where the majority of undeveloped land is in the city. Focus
     in this area should be on preservation and protection of
     trees during development, proper maintenance of mature
     trees, and ensuring new trees are planted and property
     maintained to replace aging canopy. While in areas of
     Dallas with lower tree canopy cover, activities should
     target increasing canopy cover through tree planting,                                    Figure 9. Map of tree canopy cover by
                                                                                                    Dallas city council district
     young tree care, watering, and proper maintenance of
                                                                                              Source: Texas Trees Foundation Urban
     establishing and mature trees.                                                                   Tree Canopy Assessment
                                                                                              View larger map detail on pg. 123, Appendix A

                            TREE CANOPY COVER: DALLAS CITY COUNCIL DISTRICT
                                                                                        City-Wide Tree Canopy Cover (32%)
             50
                                                    43%
                                                                                                                      41%
             40                                                           37%
                                     35%    35%
                                                                   34%
                    32%                                                                             32%
             30                                                                          28%                 27%
                                                                                                                               26%

             20                                                                  19%
                            17%                            17%

             10

                    1       2        3       4      5       6      7      8       9      10         11       12       13       14

                                                 DALLAS CITY COUNCIL DISTRICT

                    Figure 10. Tree canopy cover by Dallas city council district compared to city-wide tree canopy cover
                                  Source: Texas Trees Foundation Urban Tree Canopy Assessment Update (2019)

40                                                                                                                                            41
Tree Canopy in City Parks                   completed in 2019, used 2016 aerial             removal of a large number of trees
     Parks provide opportunities for             imagery to map canopy cover. For this           for a single development project,
     residents to play, exercise, and interact   discussion, the aerial imagery years,           but rather the cumulative effect of
     with trees and nature. Well-managed         2008 and 2016, will be used to discuss          losing a small number of trees from
     city parks and greenspaces provide          canopy changes.                                 multiple development projects. This
     important mental and physical health                                                        highlights the important role that the
     benefits to urban residents. Investing in   Between 2008 and 2016, the City’s tree          preservation and protection of trees
     these spaces is estimated to provide        canopy cover increased from 29.5%               on all development projects, regardless
     $11.7 billion annually in avoided           to 32%. While this represents an                of size or the number of trees
     healthcare costs in the United States       overall increase of 2.5%, this increase         removed, can have on maintaining
     (Wolf, 2016).                               was not seen equally across Dallas.             and increasing tree canopy cover in
                                                 In fact, there were areas that saw              Dallas. Recognizing that tree canopy
     With 394 parks in Dallas, there are many    significant losses in tree canopy cover         changes at both large and small scales
     opportunities for parks and greenspaces     within the study period. Figures 11, 12         can help target tree planting, care, and
     to help improve the health and quality      and 13 display the absolute change in           preservation activities.                               Figure 11. Absolute tree canopy change
     of life of city residents. To begin                                                                                                                    by council district (2008-2016)
                                                 Dallas’s tree canopy cover between                                                                 Source: Texas Trees Foundation Urban Tree Canopy
     leveraging the benefits that trees and      2008 and 2016 at three different scales,                                                                      Assessments (2010 and 2019)
                                                                                                                                                         View larger map detail on pg. 124, Appendix A
     parks can provide, Dallas can focus tree    from largest (Figure 11 - council district)
     preservation, maintenance, and planting     to smallest (Figure 13 - census block).
     efforts on parks that are below the City    As these maps highlight, when data is
     park tree canopy average of 43%.            combined, the results may show a net
                                                 gain in tree canopy for the combined
     How Has Dallas’s Canopy                     area (e.g., council district). However, by
     Changed Since 2008?                         looking at smaller units of tree canopy
     Tree canopy changes over time,              data (e.g., census block), areas of both
     sometimes gradually and sometimes           tree canopy gains and losses within the
     abruptly, due to weather, climate, levels   combined area can be seen.
     of tree planting and care, insects/
     diseases, disinvestment, economics,         Tree canopy gains between 2008
     and development factors. To understand      and 2016 were primarily the result of
     how canopy has changed in Dallas,           growth of existing trees and new tree
     tree canopy data from two urban tree        planting; while tree losses were caused
     canopy (UTC) studies completed by the       primarily by development activities
     Texas Trees Foundation were analyzed.       (though the droughts of 2011 and 2015
     The first study, completed in 2010, used    also contributed to tree loss). The tree
     2008 aerial imagery to map Dallas’s         canopy losses seen in the southwest
     canopy cover. The second study,             areas of Dallas were not caused by the            Figure 12. Absolute tree canopy change               Figure 13. Absolute tree canopy change
                                                                                                           by Zip Code (2008-2016)                           by census block (2008-2016)
                                                                                               Source: Texas Trees Foundation Urban Tree Canopy     Source: Texas Trees Foundation Urban Tree Canopy
                                                                                                  Assessments (2010 and 2019) Update (2019)            Assessments (2010 and 2019) Update (2019)
                                                                                                    View larger map detail on pg. 125, Appendix A        View larger map detail on pg. 126, Appendix A

42                                                                                                                                                                                                       43
Impacts of Extreme Weather
     Events Continue to Change
     Dallas’s Tree Canopy
     Since the 2019 urban tree canopy
     assessment update was completed,
     Dallas experienced two extreme weather
     events: straight-line winds in June 2019
     and tornadoes in October 2019 that led
     to damage and loss of large mature
     trees. An analysis by Davey Resource
     Group estimated that approximately 200
     acres (0.70%) of tree canopy was lost                      Figure 14. City of Dallas Tree Canopy Loss
                                                                          October 2019 Tornado
     in north Dallas during the October 2019       Data Sources: City of Dallas post-tornado aerial imagery (October 2019);
                                                   Texas Trees Foundation Urban Tree Canopy Assessment Update (2019)
     tornadoes (Figure 14).
                                                                  View larger map detail on pg. 127, Appendix A

     Equitable Access to
     the Benefits of Trees
     Tree canopy cover, as discussed previously, is not evenly distributed across the city.
     Some areas like southern Dallas and the Great Trinity Forest have high tree canopy cover,
     while others like neighborhoods on the central and west side of the city have much lower
     tree canopy cover.

     Focusing tree planting, preservation, and care in areas with low tree canopy is one way
     to increase Dallas’s overall canopy cover. However, using areas of low canopy cover as
     the only criteria for deciding where these activities occur will not necessarily ensure that
     tree canopy and its benefits will be equitably distributed across the city. Understanding
     the extent and distribution of tree canopy related to economic, demographic,
     environmental, and health factors can identify high-need equity areas. These high-need
     equity areas are those with low or aging canopy cover and medically, socially, and/or
     economically vulnerable populations that may benefit most from tree canopy cover.

                                                                                                                              Photo courtesy of The Washington Post © 2017
44                                                                                                                                                                      45
Reading the Maps
                                                                                                 Figures 15 and 16 are called bivariate maps, because they display data
     As part of the development of the Urban Forest Master Plan, a study was conducted to
                                                                                                 for two different variables. To understand the maps, let’s take a closer
     examine how tree canopy cover in Dallas was related to the following factors:
                                                                                                 look at Figure 15 which maps average temperature and tree canopy
                                                                                                 cover in Dallas using Zip Codes as the geographic boundary.
       • Human Health, a composite of asthma, cancer, high blood pressure, general
         physical health, mental health, and obesity factors (Center for Disease Control         Figure 15’s legend displays the average high temperature on the x-axis
         and Prevention, 2019)                                                                   from low (left side) to high average temperature (right side) and percent
                                                                                                 tree canopy cover on the y-axis from low (bottom) to high canopy cover
                                                                                                 (top). Areas of lowest need are shown in the upper left corner – having
       • Average Temperature (Texas Trees Foundation, 2017)
                                                                                                 high tree canopy cover and low average temperatures. While areas of
                                                                                                 highest need are those shown in the blue and purple on the lower right
       • Average Electricity Spending (ESRI Living Atlas, 2019)
                                                                                                 side of the legend – having low to moderate tree canopy cover and
                                                                                                 moderate to high average temperatures.
       • Median Household Income (U.S. Census, 2018)

     Note: while some of these factors are correlated with tree canopy cover, correlation does
     not necessarily equal causation.

     Data for each factor was mapped against Dallas tree canopy cover from the Texas Trees
     Foundation’s 2019 assessment to identify areas of highest need for tree canopy.

          Low Tree Canopy Cover
      +   High Prevalence/Occurrence/Amount of Factor
          Areas of High Need for Tree Canopy

     Figures 15 and 16 provide examples of how tree canopy can be examined through
     a benefits lens by exploring canopy cover and average temperature and electricity
     spending, respectively. The areas on each map shaded in blues and purples are the
     areas with high prevalence of the factor (i.e., highest average temperature, highest              Figure 15. Areas of high average temperatures                               Figure 16. Areas of high electricity spending
                                                                                                                 and low tree canopy cover                                             and low canopy cover by Zip Code
     electricity spending) and low canopy cover. Maps for each factor studied can be found in       Areas shaded in purple and blue are those that have low                  Areas shaded in purple and blue are those that have low to
                                                                                                      to moderate tree canopy cover and moderate to high                     moderate tree canopy cover and moderate to high electricity
     Appendix A. This concept can be further explored in the future by examining the size and        average temperatures. Trees can reduce temperatures                       spending. Research from the U.S. Department of Energy
                                                                                                                     by up to 15°F in Dallas.                                 finds that properly placed trees around homes can reduce
     age of tree canopy related to different environmental, economic, demographic,                                                                                                               air conditioning costs.
                                                                                                    Data Sources: Texas Trees Foundation Urban Heat Island
     and health factors.                                                                              Management Study (2017) and Urban Tree Canopy                            Data Sources: ESRI Living Atlas (2019) and Texas Trees
                                                                                                                   Assessment Update (2019)                                  Foundation Urban Tree Canopy Assessment Update (2019)
                                                                                                           View larger map detail on pg. 128, Appendix A                              View larger map detail on pg. 129, Appendix A

46                                                                                                                                                                                                                                         47
ABOUT DALLAS’S TREES
     The Texas Trees Foundation’s 2015 State of the Dallas Urban Forest report provided
     the data and information for this section of the Urban Forest Master Plan. The 2015
     report was based on an i-Tree Eco field study that assessed over 6,500 trees in sample
     plots on public and private property throughout Dallas. The field data collected on Dallas’s
     trees was entered into the USDA Forest Service’s i-Tree Eco model to estimate the
     composition and benefits of the urban forest, both public and private trees.

     The City of Dallas does not have a comprehensive inventory of public trees growing
     in the right-of-way, along city streets and medians, or in City parks. Therefore, the
     composition, benefits, risk, and maintenance needs of the public tree resource was not
     analyzed in this section.

     Size and Age Composition
     The 2015 State of the Dallas Urban Forest report found that over 61% of the trees in
     Dallas are young or small in size (
You can also read