AIR QUALITY AND MOBILITY CHALLENGES IN HYDERABAD - CITIZENS' REPORT - New Delhi 2011 - Shakti Sustainable Energy ...
←
→
Page content transcription
If your browser does not render page correctly, please read the page content below
CITIZENS’ REPORT
AIR QUALITY AND MOBILITY
CHALLENGES IN HYDERABAD

      Centre for Science and Environment
      RIGHT TO CLEAN AIR CAMPAIGN

             New Delhi 2011

                                           >   i
Research and direction: Anumita Roychowdhury

     Research: Vivek Chattopadhyaya

     Inputs: Priyanka Chandola, Ruchita Bansal

     Cover photo: Vivek Chattopadhaya

     Design: Surya Sen

     Layout: Shri Krishan

     Production: Rakesh Shrivastava and Gundhar Das

     We are grateful to Climate Works Foundation for programme support
     To Swedish International Development Agency and Evangelischer
     Entwicklungsdienst e.V (EED for institutional support.

     © 2011 Centre for Science and Environment

     Material from this publication can be used,
     but only with proper acknowledgement.

     Published by
     Centre for Science and Environment
     41, Tughlakabad Institutional Area, New Delhi 110 062
     Ph: 91-11-29956110-5124-6394-6399 Fax: 91-11-29955879
     E-mail: anumita@cseindia.org / cse@cseindia.org
     Website: www.cseindia.org

ii   >
Contents
FROM GRASSROOTS iv
01. AIR QUALITY AND HEALTH 1
At risk of losing gains
02. VEHICLES: A SPECIAL PROBLEM 13
Toxic fume in breathing zone
03. MOBILITY CRISIS 19
Running to stand still
04. PEOPLE OF HYDERABAD WANT CHANGE 27
Scary future of our cities: Foretold
05. TAKE A BUS 35
Set the terms of action
06. INTEGRATE 41
Link them all to improve access
07. WALKING AND CYCLING 47
Make cities walkable
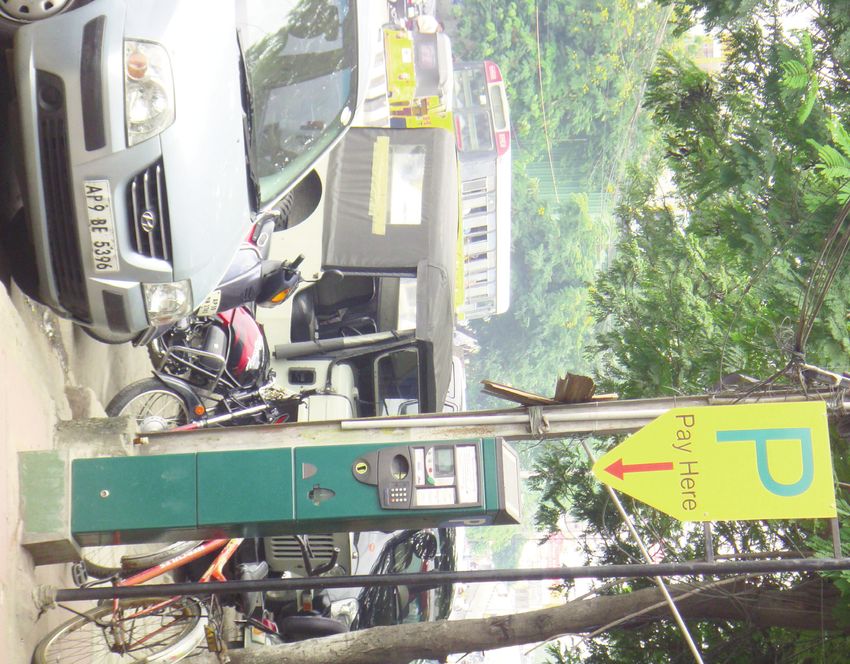
08. PARKING 63
Use parking to restrain car use
09. FISCAL SOLUTIONS 71
Tax the bad to fund the good
REFERENCES 76
> iii
From grassroots
     Cities are desperate to escape the choking haze of pollution, protect health and get out of crippling
     congestion. Big change is possible only if cities take charge, and deepen grassroots action. Cities can
     achieve clean air and become liveable if people in the city understand the risks and the solutions, and
     fire up public opinion to demand change. Success in cities will make the national goals of clean air,
     energy security and climate mitigation a reality.

     The energy and enthusiasm for change is possible if cities begin the conversation now to understand
     the issues of common concerns, share lessons, know what has worked and not worked and push
     action. To fulfill these needs this series of citizens’ report on grassroots action on clean air and
     mobility in cities has been initiated to capture local challenges and solution. This report on the capital
     city of Hyderabad in Andhra Pradesh is second in the sequence that looks at the challenges of one of
     the fastest growing metro cities in the country.

     The common challenge of all our cities is killer pollution and mobility crisis. Growing affluence,
     increased car ownership, car oriented infrastructure, urban sprawl, are increasing the share of
     motorized trips and travel distances in our cities. This is marginalizing walking, cycling, bus hopping
     and increasing harmful and warming emissions. How can cities break this spiral?

     It is important to act now when cities are expanding their infrastructure, taking funding decisions and
     discussing transportation policies at the national as well as local levels. While there are many common
     challenges across all cities, there are unique imperatives as well that must guide local action. A lot
     will depend on the way the cities will organise and design themselves and make travel choices. Only
     this can tame pollution, congestion and energy guzzling.

     So far public anger, judicial pressure and executive action have combined to trigger change. Indian
     federal structure allows cities to make wide technical and administrative choices and take decisions
     on transportation management, land-use planning, public transport and taxation policy, clean fuel
     and technology and in-use emissions control. This creates enormous opportunity for change. But this
     also demands that both national and local policy action are backed by informed choices and public
     support.

     The national government defines the framework for national air quality management and national
     urban transport policy. But cities decide and act. Cities have an advantage. They can respond quickly
     and effectively to local problems. They have the flexibility in decision making to meet local air quality
     targets and mobility management goals. They can enable cohesive coordination amongst different
     agencies for effective implementation. Take ownership, ensure accountability and transparency.
     There is no ‘one best way’. Solutions will have to be customized for each city according to its
     imperatives and uniqueness.

     Various national policies have begun to take shape to provide the national framework for clean air
     and sustainable mobility in Indian cities. The National Urban Transport Policy sets the framework for
     sustainable mobility; National Ambient Air Quality Standards issued under the Air Act sets the
     benchmark for clean air in cities. The mission on sustainable habitat framed under the National
     Climate Action Plan, provides for sustainable mobility action.

     This citizen’s report looks upward from the city to harmonise, and align with the larger national goals
     while assessing the unique solutions the city needs. This discussion in one flagship city of a state has
     become important not just for the benefit of one city but to create a template for a state level policy
     to leverage the change for the entire state. The city action is expected to inform and guide the
     development of state level policy for air quality and mobility.

     WHY HYDERABAD?
     Hyderabad is one of the rapidly growing metro cities in the country and reflects the dilemma of cities
     of the same genre. These cities will have to act fast to deal with the rapid growth and worsening of
     mobility crisis – growing pollution, congestion, energy guzzling, as public transport, walking and
     cycling are marginalized.

iv   >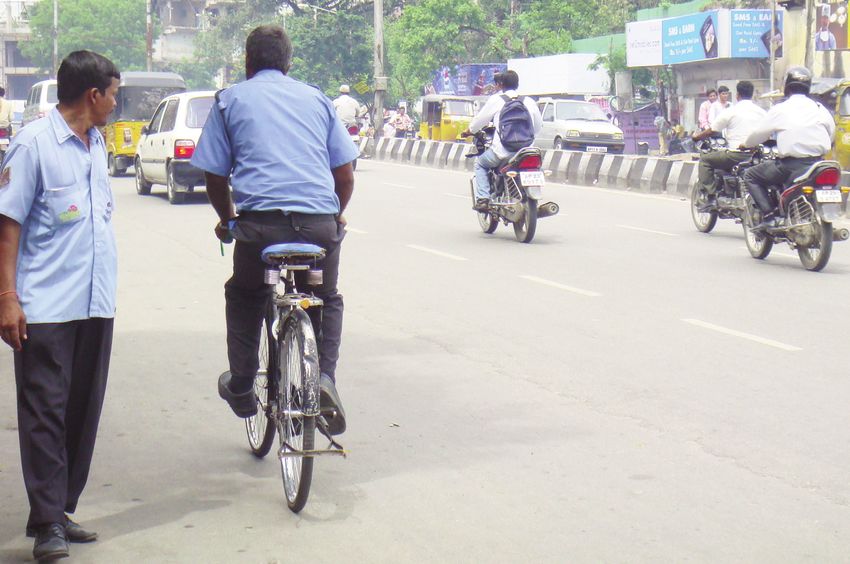
Hyderabad has a big metropolitan area. In 2007 it had amalgamated with the surrounding
municipalities and became as big as 1905 sq m. With nearly 8 million population today – more than
27 percent of the state population in Andhra Pradesh, the metropolitan area is expected to grow to
15 million by 2021. The Greater Hyderabad Municipal Corporation estimates that the city generates
10.3 million trips per day. A lot will depend on the travel choices in the city.

What is needed?

•   Meet clean air and energy saving targets: Like some other mega cities Hyderabad is also on the
    verge of losing the initial air pollution gains from the first generation action. It is facing multi-
    pollutant crisis. Public health implication is serious. Any further delay in strengthening the second
    generation action on public transport, walking and cycling and cleaner fuels and technologies and
    land-use planning can entail huge public health and energy costs. The city will have to
    immediately set the targets for meeting the clean air standards as well as define the energy saving
    targets for the transport sector. This is possible only with leapfrog technology roadmap and a
    mobility transition roadmap aimed at significant modal shift towards public transport and non-
    motorised transport.

•   Upscale public transport: The big cities have the opportunity to build to scale formal and diverse
    public transport systems. Hyderabad is already doing that. But the bus sector reforms will have to
    be accorded priority and accelerated to achieve high frequency, reliable and affordable bus service
    in the city. The approach to bus management has not been thought through well. The new
    JNNURM buses and the deluxe metro services are becoming more expensive whereas the
    conventional service is deteriorating in service and occupancy. The overall system integration for
    greater efficiency and occupancy at affordable rates is urgently needed to increase the ridership
    and keep it within the affordability of the urban majority.

•   Integrate informal systems with the formal public transport system: The city will also have to
    efficiently integrate its formal public transport with the informal intermediate public transport
    (IPT). The IPTs that are low occupancy but high frequency and a very affordable services are
    important part of public transport. These have enormous flexibility to cater to all hierarchy of
    travel trips and are more permeable. They are very effective feeders to formal public transport.
    Any erosion of these trips will see massive shifts to personal vehicles specially for short distance
    commuting. This should be prevented with well designed policy.

•   Integrate all forms of transport to maximime access: The bigger challenge is integration for
    optimal use of each mode to maximize public transport usage. But planning for physical and
    operational integration and efficiency is a challenge of planning and execution. Public transport
    ridership is 42 percent but is threatened to decline in the coming years. This will have to be
    prevented. Hyderabad has begun to take unique steps of integrated ticketing among others but a
    more composite planning is needed to meet its stated goal of increasing public transport ridership
    to 75 percent by 2021.

•   Walk and cycle more: Sustainability goal can remain elusive if the city fails to protect its walkers,
    and cyclists and increase their share of trips with well planned and safe infrastructure and design.
    This is the most neglected area. Even public transport cannot operate optimally if walking access
    is impeded and unsafe. This will require a shift in city planning that allows compact and transit
    oriented design with a clear walking network based on direct shortest route. The city needs street
    design guidelines for safe, usable and universal design. This is also needed to guide periodic audit
    of the pedestrian infrastructure that must be mandated.

•   Cities will have to change the spending pattern. In Hyderabad for instance more than 75 per cent
    of the transportation funds under the JNNURM programme has been spent on roads and flyovers.
    Fiscal regime – whether it is budgetary spending or taxation, favours the car over the bus. But the
    city has also created urban transport fund and is expected to identify a range of revenue streams
    – vehicles and fuel taxation, advertisement and parking policies, and even enhanced property tax
    from the liberalized building byelaws for extra built up area along the transit corridor – to build
    this fund. But these approaches will have to be guided with clear principles of travel demand
    management, transit oriented development and densification requirements.

                                                                                          >   v
•    Need compact dense cities: This needs network design for the area of influence to make it more
          walkable and transit oriented. But the strategy of allowing more built up area along the corridor
          and higher property taxes for land value capture without the target for densification, affordable
          housing and travel demand management measures can lead to more car ownership and usage.
          Therefore, the cities will have to develop transit oriented development policies to build these
          safeguards, and design guidelines to avoid unintended consequences.

     •    Metropolitan-wide view for all mitigation strategy: The scale of the problem is so big in these
          cities that the city would need to take a metropolitan-wide view for any mitigation strategy.
          Otherwise, any localized action inside the city can get overwhelmed by the metropolitan influence.
          Air quality and mobility will have to be managed on that scale. Small steps have been taken to
          achieve such goals including introduction of same emissions standards in the entire metropolitan
          region. But a more integrated planning is needed in which land-use and transportation plan are
          integrated for greater densification, compact city planning to prevent urban sprawl to reduce
          travel distances.

     •    Accelerate institutional reforms: Hyderabad has already created Unified Metropolitan
          Transportation Authority and is among the frontrunners to have done this under an enactment, It
          now remains to be seen how it is going to organise its executive and fiscal functions for high level
          coordination. But this is an opportunity for integrated planning.

     •    Need single landuse and transportation plan: Under the National Government led JNNURM
          programme the cities are now required to prepare City Mobility Plan. This plan is in the making
          in Hyderabad. But it is important to point out that the city should avoid duplicity of plans. Just for
          one JNNURM programme the city has prepared City Development Plan, and City Mobility Plan. At
          the same time under the Supreme Court led initiative on air pollution it has prepared a common
          minimum clean air and so on. It is advisable to have one integrated land-use and mobility plan
          with air quality and other environmental goals to guide action in the city. The specific thematic
          plan can be derived as sub plan from the integrated plan. This plan should be notified under the
          same Act as the master Plan. Only this can ensure effectiveness with adequate legal back up. This
          will also enable the city government to take ownership. Otherwise most other plans like the CDP
          etc will degenerate to becoming a project identification process only to source central government
          of funding and not guide local development.

     •    Cities should negotiate harder with the national government for tighter emissions standards to
          reduce toxic emissions. At the same time it would need to expand its programme for cleaner fuels
          – CNG and electric vehicles – with the right incentives and the infrastructure back up. Cities will
          also have to make a quick transition to an improved vehicle inspection programme and fleet
          management to lower in-use emissions.

     •    Build relevant and credible data bases for policy action: As we trooped out to the city to
          understand the information that exists on air quality and mobility it was very clear to us that
          currently, there is no established practice of generating data on the requisite sets of indicators of
          mobility crisis and action. Cities need protocol for data generation and management on key
          indicators to assess and monitor shift to public transport, walking and cycling. Regular surveys
          should be carried out to generate data on trends in vehicle kilometers traveled by mode, trip
          distances, fuel use by mode, changes in usage of different modes, performance indicators of public
          transport, NMT and IPT. Wide ranging indicators for system performance and so on are needed.
          Otherwise, setting target for modal shift, or reducing transport energy consumption, improvement
          in performance of public transport etc cannot be tracked and monitored. This will certainly have
          to be an area of reform in the city.

     Strong public opinion, judicial and executive actions have catalysed action in Hyderabad. Soft options
     have all been exhausted. This has created an opportunity for change. The second generation reforms
     will need tough action — plan cities for people not vehicles. This is the option for the city to cut killer
     pollution, crippling congestion, expensive oil guzzling and global warming impacts of vehicles.

                                                                        —Right to Clean Air Campaign Team

vi   >
AIR QUALITY AND HEALTH
At risk of losing gains
01
Hyderabad shares the same dilemma as that of other
mega city in India. It has started to take action to control
air pollution and seen results. But the city is also on the
verge of losing the air pollution gains.
The air quality challenge in the city is complex. Like
other southern cities of India overall levels of
particulate matter in Hyderabad are lower than the
northern cities where the influence of dust is high. But
scientists caution that most of the particulates here are
from the combustion sources that are more toxic and
health damaging.
The city is also in the grip of multi-pollutant crisis.
While the particulate pollution continues to be the
primary concern other pollutants – especially ozone –
have also begun to rise. The average NOx levels show a
declining trend. But this is deceptive as in key locations
their levels exceed the permissible limits. Air toxics are
dangerous even at trace amounts.
With increase in population, vehicle numbers, and
fuel consumption pollution levels are also increasing in
the city. Only sulphur dioxide levels have decoupled
from the growth trend due to change in the energy
matrix in the city.
Hyderabad has its own evidences on insidious health
effects of air pollution. Scientists have found high level
of oxidative stress, lung function impairment,
respiratory ailments due to air pollution.
Drug sales related to respiratory symptoms in key
locations of Hyderabad have increased. Studies have
predicted significant lives savings if air pollution is
controlled. The city needs aggressive and sustained
action to protect public health.
CITY ACTION
Centre for Science and Environment
RIGHT TO CLEAN AIR CAMPAIGN● Tiny particles are rising in the air. The levels
are about 1.3 times the standards and falls in
high pollution class – according to the air
pollution classification of the Central
Pollution Control Board.
● During the winter months the tiny particles
PM2.5 shoot much beyond the standards.
They go deep inside the lungs.
● The recent tightening of the national ambient
air quality standards have changed the air
quality status of the locations in the city.
Some of them have moved from low and
moderate to high pollution bracket.
● Air toxics like benzene that are strong
carcinogen have recorded levels above the
permissible limit.
● Highest number of drugs related to air
pollution linked ailments have sold in
Punjagutta and Abids zone that have also
recorded highest PM1 and PM10 levels.
● Hyderabad faces the second generation
challenge. It will have to take stock and
refocus. It will have to leap ahead to keep
ahead of the problem.
2 >01
AIR QUALITY AND HEALTH
AIR QUALITY CHALLENGES
What is the daily dose of poison that the city dwellers breathe in
Hyderabad? About 21 monitoring stations track air pollution in Hyderabad.
These regularly monitor sulphur dioxide (SO2), nitrogen dioxide (NO2), and
particulate matter of less than 10 micron size (PM10). Carbon monoxide
(CO) is monitored on a limited scale. Others under limited scanner include
ozone, PM2.5, and a range of air toxics benzene, toluene and xylene. The
city is now preparing to expand monitoring for PM2.5, ozone, lead,
benzene, Benzo (a) Pyrene (BaP), arsenic and nickel that have been notified
under the new National Ambient Air Quality Standards in 2009. The
emerging data paints a daunting challenge.
Killer particles: Like the rest of the country particulates remain the most
serious concern. The levels of particulate matter of less than 10 micron size
have continued to increase and are about 1.3 times higher than the
standard (see Graph 1: PM10 levels in Hyderabad). This brings the city to
the high pollution bracket – according to air quality classification of the
Central Pollution Control Board (CPCB). Without aggressive measures the
city may lose its breathing space.
The city average levels do not reflect the crisis in different locations of
the city: Paradise, Charminar, C.I.T.D. Balanagar, and Uppal that have
recorded PM10 annual average levels in the range 106 microgramme per
cubic metre to 119 microgramme per cubic metre. These fall in ‘critical
range’ as per the air quality classification system of the CPCB.
Also the annual average trends are often not good indicators of actual
exposure to pollution on a daily basis. Even if annual average levels decline,
the number of days exceeding the standards may increase subjecting. This
means people are exposed to higher pollution on a greater number of days
RIGHT TO CLEAN AIR CAMPAIGN
Centre for Science and Environment
Graph 1: PM10 levels in Hyderabad
Rising levels of PM10 in the city
90
80
Microgramme per cubic metre
70
60
50
40
CITY ACTION
30
20
10
0
2002 2003 2004 2005 2006 2007 2008 2009
PM10 annual average Linear (PM10 annual average)
Source: CSE computation based on data provided by Central Pollution Control Board
> 3in a year. PM10 monitoring in Charminar shows that 80 percent of days the
levels exceed the 24-hourly standard – reflecting high exposure of
populations to deadly particles on a daily basis. In Paradise and CITD
Balanagar about two third of days exceed the standard. The levels of
exceedances are increasing in other locations as well. (see Graph 2: Many
locations have critical levels of PM10)
Graph 2: Many locations have critical levels of PM10
140
120
Microgramme per cubic metre
100
80
60
40
20
0
C.I.T.D. Nacharam Uppal ABIDS Circle Charminar Jubilee Hills Paradise Tarnaka Zoo
Balanagar Park
Source: CSE based on NAMP data
However, the particulate levels in the southern cities like Hyderabad are
not as high as those noticed in the Northern and Western cities where the
effect of the natural dust is higher (Graph 3. The PM10 levels in key cities).
But the state pollution control board scientists caution that in the southern
cities most of the particulates come from combustion sources that are more
toxic in nature and therefore more harmful.
Even tinier particles of less than 2.5 micron size that come mostly from
the combustion sources are high especially during the winter months (See
Graph 4: Tiny particles: PM2.5). These go very deep into the lungs and are
a serious health threat. National air quality monitoring programme is now
shifting towards tracking this pollutant in the major cities.
Graph 3: The PM10 levels in key cities
240 2002 2003 2004 2005 2006 2007 2008
Microgramme per cubic metre
180
120
60
0
Ahmedabad Bangalore Chennai Delhi Hyderabad Kolkata Mumbai Pune
Source: Based on CPCB data
4 >Graph 4: Tiny particles: PM2.5
01
AIR QUALITY AND HEALTH
120
Indicative comparison with annual
average standard 40 microgramme
100 per cubic metre
Microgramme per cubic metre
80
60
40
20
0
Jul-09
Aug-09
Sep-09
Oct-09
Nov-09
Dec-09
Jan-10
Feb-10
Mar-10
Apr-10
May-10
Jun-10
Source: CSE based on data from SPCB
NOx mixed trend: The trend in nitrogen oxides (NOx) show a downward
trend in the city and have remained below the standard. It is not possible
to explain this trend as the traffic volume is steadily increasing in the city.
Studies carried out in India have shown that about 60-70 percent of NOx
can come from vehicles. However, there are location-wise variations in the
city. Charminar and Paradise have relatively higher levels at about 34
microgram per cubic metre and are close to the standard of 40 microgram
per cubic metre. Further assessments of road side NOx levels in the city are
also needed to understand the exposure levels of city dwellers. (See Graph
5: Consistent and falling ambient levels of NO2).
All cities need to be careful of NOx not only because it is harmful in itself
but also is a major contributor to the formation of another very harmful
pollutant in the air – ozone. NOx triggers reaction amongs other volatile
organic compounds in the air under the influence of sunlight that creates
ozone.
RIGHT TO CLEAN AIR CAMPAIGN
Centre for Science and Environment
Graph 5: Consistent and falling ambient levels of NO2
Do we know enough about kerbside NOx levels?
40
35
Microgramme per cubic metre
30
25
20
CITY ACTION
15
10
5
0
2002 2003 2004 2005 2006 2007 2008 2009
Source: based on CPCB database
> 5Emerging threat - Ozone: Ozone hitherto an unknown threat is emerging
as a problem. Limited data indicate that ozone has begun to exceed
standards in the city especially during the summer months (See Graph 6:
Ozone: an emerging threat). As mentioned earlier, ozone is not emitted
directly by any source. It is formed when other gases in the air – NOx and
other volatile compounds react with each other under the influence of
sunlight. To control ozone other gases will also have to be controlled. Even
a short term exposure to high level of ozone can have a lethal effect on
those suffering from asthma and respiratory conditions.
Graph 6: Ozone: an emerging threat
250
200
1-hourly standard
Microgramme per cubic metre
150
100
50
0
Jul-09
Aug-09
Sep-09
Oct-09
Nov-09
Dec-09
Jan-10
Feb-10
Mar-10
Apr-10
May-10
Jun-10
Source: CSE based on the SPCB data
Changing air quality status of locations: Even before the city could reduce
its pollution levels effectively the clean air benchmark has become tighter
changing the air quality status of many locations in Hyderabad. The recent
tightening of the air quality standards by the Ministry of Environment and
Forests has changed the air quality status of the locations in Hyderabad.
(See Table 1: Change in air quality status of monitoring location in
Hyderabad after the new National Ambient Air Quality standards)
For particulate pollution Nacharam has moved from low to moderate
level. C.I.T.D. Balanagar and Uppal have moved from moderate to critical
bracket. Paradise and Charminar have continued to remain critical.
For nitrogen dioxide levels Tarnaka, C.I.T.D. Balanagar, Uppal locations
have moved from low to moderate levels. About 66 per cent of the
monitoring locations of the city – reported under the National ambient air
quality monitoring programme have high pollution problem. This exposes
a large number of people to very high pollution levels. (See Graph 7:
Comparison of PM10 and NO2 levels with new air quality standards).
Air toxics: These are a range of toxic gases that are mostly carcinogens and
are harmful even at a trace level and in small doses. Hyderabad has begun
to generate data on air toxics. Available data on ambient benzene levels
during July 2009 to June 2010 shows that the monthly average levels
(based on one hourly average) exceed the annual average limit of 5
microgram per cubic metre set by the Central Pollution Control Board.
During winter months the levels are comparatively higher and reach as
high as 8.1 microgram per cubic metre. (See Graph 8: Benzene levels in
Hyderabad (July 2009 to June 2010)
6 >01
Table 1: Change in air quality status of monitoring location in Hyderabad after the new National Ambient
Air Quality standards
Monitoring Locations RSPM (or PM10) Nitrogen dioxide
Previous air New air Previous air New air
AIR QUALITY AND HEALTH
quality status quality status quality status quality status
Nacharam Low Moderate Low Low
C.I.T.D. Balanagar Moderate Critical Low Moderate
Uppal Moderate Critical Low Moderate
Paradise Critical Critical Moderate Moderate
Charminar Critical Critical Moderate Moderate
Tarnaka High High Low Moderate
ABIDS Circle High High Moderate Moderate
Jubilee Hills Moderate Moderate Low Low
Zoo Park High Moderate High Moderate
Source: CSE analysis based on CPCB ambient air quality data
Graph 7: Comparison of PM10 and NO2 levels with new air quality standards
140
PM10 level NO2 level
120
Microgramme per cubic metre
100
80
60
40
20
0
C.I.T.D. Nacharam Uppal ABIDS Circle Charminar Jubilee Hills Paradise Tarnaka Zoo
Balanagar Park
RIGHT TO CLEAN AIR CAMPAIGN
Centre for Science and Environment
Source: CSE analysis based on CPCB ambient air quality data
APPCB has also started monitoring of ammonia, lead and nickel in
ambient air since October 2010 and is preparing for more regular
monitoring of a few other new parameters including Benzo(a)pyrene and
Arsenic.
Assessment of aldehyde and formaldehyde (probable human
carcinogen) at 6 locations in Hyderabad reveals that the levels are highest
in Mehadipatnam followed by Nagarjuna Circle and Lakdikapool. The levels
have been recorded as high as 32.7 microgram per cubic metre.
Overall, the complex mixture of pollutants may vary over time and
CITY ACTION
place, depending on the sources and meteorological conditions. This is a
serious challenge in our cities where several pollutants together can exceed
standards on any single day and hence the city needs to take tough and
quick measures to control growing air pollution.
Growth and pollution: The biggest challenge that any city faces is
decoupling of economic growth from the pollution trend. How can it grow
and travel sustainably without increasing pollution and energy guzzling?
The growth indicators in Hyderabad show that the vehicle numbers,
transport fuel consumption, population in the city are constantly growing
> 7Graph 8: Benzene levels in Hyderabad (July 2009 to June 2010)
180
Avgerage (of 1-hr levels) Maximum (of 1-hr levels)
160
140
Microgramme per cubic metre
120
100
80
60
40
20
0
Jul-09
Aug-09
Sep-09
Oct-09
Nov-09
Dec-09
Jan-10
Feb-10
Mar-10
Apr-10
May-10
Jun-10
Source: Analyzed from data provided by the Andhra Pradesh Pollution Control Board
Along with that the key pollutants are also rising. The pollutant that has
decoupled from growth is sulphur dioxide. This is largely because of the
change in the energy matrix in the city. But the challenge of delinking PM,
NOx and ozone from motorization and growth will have to drive the change.
(See Graph 9: Pollution and Growth in Hyderabad (Percentage change
during 2002-2008).
Graph 9: Pollution and Growth in Hyderabad (Percentage change during 2002-2008)
Only trend SO2 trend delinked from economic growth. Other pollutants rising.
+75% PM10
+73% NO2
Bus fleet
No. of vehicles
+35% Fuel consumption
+25% Population
+18% SO2
+2%
–37%
2002 2008
Note: population data pertains to 2001 and 2007, as sourced from MOUD, Wilbur Smith Associate report Study on Traffic & Transportation Policies and
Strategies in Urban Areas in India.
Source: CSE estimates
Hyderabad has already initiated action to control air pollution (See Box:
First generation reforms in Hyderabad).. The action has targeted both
vehicles and industry. The state government has initiated local action plan.
The directives from the Supreme Court have further given the impetus.
Along with these air quality management programmes as well as mobility
policies and investments plans under the urban renewal mission of the
National government has set the terms of action in the city. But the game
of pollution control cannot be won by catching up, but only by leaping
ahead.
8 >FIRST GENERATION REFORMS IN HYDERABAD
01
AIR QUALITY AND HEALTH
Exhausted all soft options
Action on vehicles:
• Implemented the Auto Fuel Policy and moved quickly to Bharat Stage IV norms in the entire area of
Greater Hyderabad Municipal Corporation which includes 12 municipalities in Rangareddy and Medak
Districts as well.
• Strengthened pollution under control system with new equipment and norms for in-use vehicles. It has
introduced networking of PUC centres for data analysis and audits Out of 164 pollution testing
stations licensed in Hyderabad and Rangareddy Districts, 107 stations have been networked. A special
drive on Air and Noise pollution during 2010 has led to penalty cases of 10410 and a fine amount of
Rs. 35,60,750.
• Introduced LPG programme (40 LPG stations and about half of auto fleet runs on LPG) and small scale
CNG programme targeting autos and buses (There are about 2,727 CNG vehicles – largely autos).
• Battery operated three wheelers are being encouraged.
• New buses have been introduced;
• Pre-mix oil dispensers installed in HUDA area for two-stroke engines and most oil dispensing units do
not sell loose 2T oil.
• Multi-modal transit system – which is mainly the local trains designed for passenger comfort and with
increased frequency – are connected with the APSRTC city services through common ticketing system.
Action on industry
• Most of the industries located in the city have provided pollution control systems such as cyclones,
scrubbers and bag filters and non-complaint industries have been identified. There are large number
of small and medium scale industries located in Hyderabad/ Secunderabad. Industrial units in industrial
areas of Azamabad, Chandulal Baradhari, Sanath Nagar and scattered units in Amberpet,
Bahadurpura, Candrayangutta and Musheerabad. All these units are surrounded by residential area.iii
HYDERABAD GASEOUS FUEL PROGRAMME
Bhagyanagar Gas Limited is operating 4 CNG stations which have become operational in Hyderabad and
2 more stations are under construction. The average daily sale is 7500-8000 kg. The CNG is presently being
supplied from Vijaywada mother station. BGL has received CGD authorization from PNGRB. GoI has
allocated 0.1 MSCMD Natural Gas for Hyderabad. The CNG pipeline connectivity is likely shortly. A mother
RIGHT TO CLEAN AIR CAMPAIGN
Centre for Science and Environment
station is under construction in Hyderabad. 60 stations are planned to be set up in 3 years. Three exclusive
CNG stations are being set up for three APSRTC depots and 20 more such stations are planned in 3 years.
APSRTC is ready to convert their buses to CNG mode and is waiting for CNG supply commissioning.
Number of CNG vehicles in Hyderabad & Rangareddy District is – (4 wheelers 162 & 127, respectively
and 3 wheelers 2630 & 98, respectively). 43 auto LPG stations (35 oil companies and 8 private) are
operational. 12 more stations are under construction (10 oil companies and 2 private). Number of LPG
vehicles in Hyderabad & Rangareddy District are – (4 wheelers 14601 & 13759, respectively and 3 wheelers
31255 & 1846, respectively)
Any replacement of auto rickshaw is permitted with LPG/CNG operation mode only.
As on October 2010 the BGL is operating 4 CNG Stations in Hyderabad at R.P.Road, Nagole, Nampally,
Meer pet. The present off take from each of these outlets is 1500-2000 Kgs/day. On an average a quantity
of 7500 Kgs/day is sold. CNG is being transported from Mother Station at BGL-Vijayawada through Light
CITY ACTION
Commercial Vehicles(LCV) having a capacity of approx.450 Kgs.
The city needs to adopt a CNG pricing policy that will maintain an effective differential between CNG
and diesel prices – city authorities should also waive off the VAT applicable on CNG to promote it as a
cleaner fuel. But at the same time the city will have to develop a robust periodic and mandatory safety
and emissions inspection for the on-road CNG vehicles, as Delhi has done.
The AP government is preparing to put in place an effective CNG infrastructure for a large scale CNG
programme in the city. According to reports the state government in Feb 2011 directed the APSRTC to
ensure that at least one-third of the 6,000 buses which it intends to purchase over the next 36 months have
to run on CNG (compressed natural gas). The govt. agencies expect that deploying of CNG buses will
continue…
> 9accrue multiple benefits in the form of reduced fuel expenditure, which currently accounts for 37% of the
total expenditure of the corporation and less maintenance, apart from significantly creating an eco-
friendly atmosphere through reduced vehicle emissions.
Presently, less than 100 CNG buses are being run in the state, most of them in Vijayawada. The RTC
runs 22,000 buses in the state including 3,500 in Hyderabad. Its fuel bill is approximately Rs 1,850 crore per
annum and it buys 45 crore litres of diesel per annum. The minister said this would go a long way in
ensuring healthy profits for the RTC through savings on fuel. The proposed savings for RTC on fuel bill and
maintenance through the use of CNG could be in the range of 17% and 23%. Now that two exclusive CNG
stations at Hakimpet and Medchal would be made available for RTC, the effectiveness of CNG buses would
be more visible in the coming days according to transport minister’s statement to press. The government
also directed the RTC MD to prepare a detailed proposal to establish CNG stations in as many depots as
possible, duly giving preference to the CNG supply routes already identified in the state.
Table: Number of CNG vehicles in Hyderabad
Vehicle Type Number of CNG Vehicles
Hyderabad Rest of the state Total
Auto 2,632 4,254 6,886
Cabs 23 19 42
Cars 83 232 315
Buses *224 253 477
HGV 27 152 179
Total 2,989 4,910 7,899
Source: Andhra Pradesh Pollution Control Board 2010, Present status of the action plan for lowering of air pollution
in the city of Hyderabad, October 07, presented at the Hyderabad city dialogue jointly organized by APPCB and CSE
PUBLIC HEALTH: EMERGING EVIDENCES
Discussion on air pollution is relevant only because it affects our health.
While the global health community have spawned enormous range of
clinching evidences on health effects of air pollution based on studies of
massive scale – covering millions tracked over 15 to 18 years to assess the
effects, Indian cities have also begun to produce their own evidences.
Studies have shown increased hospitalisation for asthma, lung diseases,
chronic bronchitis and heart damage. Long-term exposure can cause lung
cancer.
Hyderabad has also produced its own evidences. It is known quite
widely that the estimated health effects of air pollution in India are quite
similar to those found in the extensive studies of the western countries. But
the grass root action gains credence and strength from the valuable local
evidences. The city based studies have helped to deepen the understanding
of the nature of the risk. The local evidences have the power to build public
awareness and help to convince that adverse health impacts lead to
increased use of medication, increased visits to the doctor, more hospital
admissions and premature deaths.
The lethal effects of air pollution on the residents of Hyderabad have
been proven by numerous studies. The Andhra Pradesh Pollution Control
Board has conducted a study that shows how respirable particulate matter
(with its benzene, PAH and aldehyde as its components) and CO cause
“ventilatory defects” in residents near traffic areas. Data collected from
1998 to 2000 from hospitals in areas representing four high air pollution
pockets of the twin cities of Hyderabad and Secunderabad showed higher
prevalence of heart attacks in the 30-40 year age group.
Another drug off-take study was conducted by doctors of S V S Medical
College to gather data for 56 different drugs being sold within a 5-km
radius of the air quality monitoring stations at five of the most polluted
zones in the city. It showed that since 1998, the highest drug sale had
10 >occurred in Punjagutta and Abids zones of the twin cities which have also
recorded highest PM1 and PM10 levels.
01
AIR QUALITY AND HEALTH
Researchers at Clinical Immunology and Biochemistry department of LV
Prasad Eye Institute have assessed exposure of traffic police to air
pollutants. This group is at a higher occupational risk. This study concluded
that the traffic police of Hyderabad city have lower level of antioxidants in
the RBC lysate such as catalase, superoxide dismutase and glutathione
peroxidase. These findings indicate that exposure to air pollutants can
increase oxidative stress and reduced levels of antioxidants and nitric oxide
in the body. This imbalance in the oxidant/antioxidant system may lead to
lung damage and is likely to cause respiratory problems in individuals
exposed to air pollution.
Another group of scientists have assessed the health risk for the city of
Hyderabad due to air pollution and estimated inhalation transfer factors
and population inhalation factors for ambient and line source pollution in
Hyderabad. The population inhalation of respirable particulate matter was
found to be the highest at an average of 4.46 grams per hour. The study
also correlated this with the number of persons with respiratory and lung
infections observed in Hyderabad during the study period. The number of
pollution related diseases observed in different seasons clearly reveals the
significance of pollution in triggering health ailments in Hyderabad.
Institute of Health Systems, Hyderabad estimated the health effects in
different air pollution scenarios under the Integrated Environmental
Strategies programme (IES). They assessed the magnitude of health
impacts in relation to PM10 exposure to calculate the health risk and
percentage increase in mortality and morbidity per unit increase in air
pollutant concentration. The study has found that transportation sector is
the largest contributor to air emissions (about 70 per cent of the total load)
in Hyderabad. The study has suggested that effective bus transit mitigation
can result in one third reduction of PM10 concentrations compared to BAU
levels. This can also result in most significant decreases in mortality and
occurrence of cardio vascular diseases and other respiratory diseases.
The involvement of the state pollution control board and the local
research institutes in generating local health evidences is an important step
forward. These initiatives will have to be nurtured and supported to drive
policy action and public opinion in the future.
Cities will have to set the terms of action for proper risk assessment and
RIGHT TO CLEAN AIR CAMPAIGN
Centre for Science and Environment
reduce risks:
Set targets to meet air quality standards in cities: Make National Ambient
Air Quality Standards legally binding. The quantum of central assistance to
states for implementation of the city action plan for clean air should be
linked with the progress in implementation of pollution control measures.
For this verifiable benchmark and monitoring system should be developed.
Introduce elements of incentive and disincentives for meeting air quality
standards. Health imperative can help to identify the mechanics for
enforcement of the National Ambient Air Quality Standards in a time bound
manner to protect public health.
CITY ACTION
Targeting emissions source to meet air quality standards: The national
air quality planning and city action plan would need roadmaps for each
source of pollution. Cities should carry out pollution source inventory and
apportionment studies to refine their action plans. Air quality management
should at the same time prioritise interventions to minimize exposure and
address the growing toxic risk of air pollution.
Account for the health cost in decision making: A better valuation of acute
and chronic illnesses linked to air pollution needs to be carried out in India
and integrated with decision making. The estimation of monetary value of
> 11health benefits associated with changes in air pollutants can serve as an
input for the cost benefit assessment of the air pollution-control strategies.
Such approaches are critical to build the rationale for policy intervention.
Develop programme for health risk assessment to inform policy making:
Scale up studies and track health effects on an ongoing basis to inform air
pollution mitigation policies. This will also make regulations more
responsive and dynamic. Give special attention to the effect of a range of
modifiers – poverty, high level of pollution, mixture of pollution etc. Use the
evidences from toxicological and epidemiological research for policy
making.
Need strong baseline data on diseases and deaths as well as robust
protocol to support health risk assessment: Indian cities need health
information management standards with clear definitions, protocols and
acceptable values for recording data in all medical institutions. The
technical network available in the country for disease surveillance needs to
get stronger. Computerization of health database would be the first step to
better data management. Trained personnel need to be employed in this
field. The data recorded should be accurate, consistent and comprehensive.
Air quality monitoring to enable health assessment: As the
epidemiological studies measure the relation between ambient
concentration and health response, the surveillance system should be able
to capture the variation in the level of air pollution and health status more
intricately across different locations and over time. Air quality monitoring
should be well designed to enable such studies.
Build public information system on daily air quality with health
advisories: Globally, governments have developed air quality index to
inform people about the daily air quality through easily understood air
quality bands and issue health advisories for those who are especially those
who are vulnerable to air pollution. Some governments even frame
pollution emergency measures to reduce the pollution peaks to more
tolerable level.
12 >VEHICLES: A SPECIAL PROBLEM
Toxic fumes in breathing zone
02
A city has many sources of pollution. But vehicles are
the fastest growing source of pollution in our cities.
Cities can relocate industry and power plants but not
vehicles.
People living or working in close proximity to heavily
traveled roadways are vulnerable to high level of
exposure. A large number of studies show that vehicles
cause severe health damages. From health standpoint
vehicles need special attention to cut emissions at
source.
Motor vehicles emit some of the most health
damaging air pollutants and the deadliest carcinogens
and compounds. Indian cities are also in the grip of
aggressive dieselization of car segment. Diesel
emissions are more toxic and cancer causing. Studies in
Indian cities have looked at the connection between
high exposure to vehicular fume and health effects.
Hyderabad has also generated its own evidences on this
insidious link especially in high traffic areas of the city.
Very high respiratory symptoms have been noted in the
locations close to traffic areas.
Vehicles are also emerging as a major energy guzzler.
Projections show that the vehicles will be the major
propeller of the energy demand. Personal vehicles
already account for half of the energy demand in the
transportation sector in Hyderabad. This is also pushing
up the emissions of the heat trapping carbon-dioxide
emissions in the city.
The emerging evidences can help people to
understand the growing risk and demand stronger
regulatory action on vehicles.
CITY ACTION
Centre for Science and Environment
RIGHT TO CLEAN AIR CAMPAIGN● Hyderabad has carried out its own
estimations of contribution of vehicles to the
pollution load and energy guzzling in the city.
Such evidences are important to drive
regulations at the grass roots.
● Vehicles are a major contributor to air
pollution. They contribute nearly 70 percent
of the total pollution load in the city.
● Vehicles are the significant contributor to
particulate pollution as well. Studies have
shown that vehicles in Hyderabad can
contribute 38 percent to 58 percent of the
PM10 and 38 percent to upto 68 percent of the
PM2.5.
● Effect of traffic is most evident from the study
that showed dramatic drop in pollution during
the truck strike in January 2009. The strike
resulted in a significant drop — about 57
percent in black carbon, 60 per cent in
particulate matter, 40 per cent in carbon
monoxide and 50 per cent in ozone during that
period.
● Vehicles are also the major energy guzzler.
Cars and two-wheelers burn up 50 percent of
the energy in the transportation sector in
Hyderabad. The total transportation energy
in Hyderabad is about 60 percent of the
transport energy used in Delhi.
14 >02
VEHICLES: A SPECIAL PROBLEM
VEHICLES: A SPECIAL CHALLENGE
From public health perspective vehicles pose a special problem because
vehicle emissions take place in the breathing zone of people. This
contributes significantly to human exposure to air pollutants. People living
or working in close proximity to high traffic roadways have high levels of
exposure.
The US based Health Effect Institute scientists have shown in their
studies in Indian cities like Delhi that in densely-populated Indian cities
more than half of the people living or working close to the roadside are
most exposed to the vehicular pollution. This has ominous implications for
all densely built Indian cities where more people are expected to live within
the influence zone of the high traffic roads. Air pollution data show a
marked gradient among local, regional and roadside levels. Roadside levels
of respirable suspended particulates, NOx and NO2 are reported to be much
higher than the ambient levels.
Hyderabad is a city of mixed activities but most of the air pollution
comes from rapidly growing number of vehicles. A series of intensive
monitoring programme was undertaken during 2005-06 at three locations
to address the issue of elevated pollutant levels in the city. Diverse land use
areas were chosen for the purpose of monitoring, i.e. residential,
commercial, high traffic areas and background areas with minimal
pollution. The study was supported by the Integrated Environmental
Strategies program and was carried out in collaboration with Andhra
Pradesh Pollution Control Board, US National Renewable Energy
Laboratory, and the US Environmental Protection Agency.
The study has generated valuable evidences for the city and policy
action. The contribution of vehicles has been found to be significant. This
varies from 38 per cent to 58 per cent for PM10, and 38 per cent to 68 per
cent for PM2.5. The fugitive dust (included soil dust, wear and tear from
RIGHT TO CLEAN AIR CAMPAIGN
Centre for Science and Environment
tires, and construction dust) which is the second largest source of PM10,
varies between 19 per cent and 44 per cent and between 5 per cent and 26
per cent in PM2.5. Coal combustion varies between 0 to 36 per cent,
showing large uncertainties and incidences of long range transport of
industrial sources outside the city center. (See Graph 10: PM10 and PM2.5
Source Apportionment Study)
According to Andhra Pradesh Pollution Control Board, vehicles
appeared as a major source of particulate matter with average contribution
of around 50 per cent at these locations. The PM2.5 which are the tinier
fraction and a subset of the particles in the air are about half of the PM10.
The major components of the PM10 are silica and aluminum while for
PM2.5 organic carbon and ions (nitrates, sulphates) are the major
CITY ACTION
contributors. This indicates that the small particles come mostly from
combustion sources. Other major sources are re-suspended soil (likely to
originate from re-entrainment of paved and unpaved road dust), biomass
burning and coal combustion (from industrial and cooking sources).
Evidences make it clear that vehicles need special attention in the city for
public health protection.
A very interesting study was carried out in the city during the month of
January in 2009 to see the effect of the nation-wide truck strike on the
pollution levels in the city. (See Graph 11: Impact of truck strike on air
pollution (5–12 January, 2009). Hyderabad based National Remote Sensing
> 15Graph 10: PM10 and PM2.5 Source Apportionment Study
Mobile sources are the predominant contributors to PM10 and PM2.5
Coal (4%) Cement (2%) Cement (2%)
Coal (16%)
Biomass burning (4%)
Secondary
particulates (8%)
Vehicles (49%) Vehicles (50%)
Biomass
burning (7%)
Road dust (33%) Secondary Road dust (11%)
particulates (14%)
Source: Andhra Pradesh Pollution Control Board 2010, Present status of the action plan for lowering of air pollution in the city of Hyderabad, October 07
Centre had studied the influence of this nationwide truck strike during 5–12
January, 2009. The assessment tracked the impact on black carbon
aerosol, trace gases and ground reaching solar radiation. The results
showed a significant drop of about 57 per cent in black carbon, 60 per cent
in particulate matter, 40 per cent in carbon monoxide and 50 per cent in
ozone during that period. This reflects the high correlation between
pollution concentrations and truck traffic in Hyderabad that also run on
diesel. These studies reflect that black carbon and particulate matter
concentrations in Hyderabad are highly correlated with vehicular traffic –
especially diesel vehicles. The levels are significantly higher than low-
pollution rural areas. Diesel emissions have serious health risks – and are
blamed to cause even cancer and other serious non-cancer effects in the
exposed populations.
Though precise numbers are not available guess estimates from the
transport departments indicate that the share of diesel cars is increasing in
the city. This is consistent with the national trend that shows that diesel
cars are close to 40 percent of the new car sales. Cities immediately need
a strategy to curtail dieselization given the fact that diesel emissions have
been branded as a human carcinogen by agencies like the WHO,
International Agency on Cancer Research etc. While the national
government will have to be pushed to introduce clean diesel fuel and
technology (diesel fuel with 10 ppm sulphur level used with advanced
particulate traps and NOx control) the state governments also need to
adopt policies to disincetivise diesel cars.
One of the emerging good practices is in Delhi where an environmental
cess has been imposed on per litre of diesel sold to create a dedicated fund
for pollution control. Also the road tax on diesel cars has been increased to
disincentivise its use. Other cities need to develop similar fiscal strategies
to reduce the public health risks.
These evidences in public domain can help to build public awareness
and push for action.
VEHICLES THREATEN ENERGY SECURITY
Vehicles not only pollute air but they also threaten energy security.
Transportation policies will have to address energy security challenge.
Vehicles in India currently use up nearly half of petroleum products.
International Energy Agency has predicted that the future increase in fuel
consumption in the road transport sector of India will largely be driven by
16 >Graph 11: Impact of truck strike on air pollution (5–12 January, 2009) in
02
Hyderabad
VEHICLES: A SPECIAL PROBLEM
Black carbon PM CO Ozone
–0%
–10%
–20%
–30%
–40%
–40%
–50%
–50%
–60% –57% –60%
–70%
Source: Source: Anu Rani Sharma et al 2010, Influence of vehicular traffic on urban air quality – A case study of
Hyderabad, India, Transportation Research Part D: Transport and Environment, Volume 15, Issue 3, May 2010
light-duty vehicles, mainly cars growing at an annual average growth of 10
per cent by 2030. Cars will burn up nearly the same amounts of total
energy consumed by the entire transport sector today, even though heavy-
duty vehicles will splurge the most. This is unaffordable as nearly 80 per
cent of our crude oil needs are imported at exorbitant rates and will
increase further by 2030. Asian Development Bank has predicted that
transport energy use will increase six times by 2020.
This makes for the case that energy imprint of motorization will have to
reduce in each city. The grass root action is vital for national energy
security.
RIGHT TO CLEAN AIR CAMPAIGN
Centre for Science and Environment
CITY ACTION
> 17Hyderabad is a high growth area. Rapid motoriastion has already taken
off in this city. The total transport energy consumption in Hyderabad in
2008 was estimated by the SIM Air study to be about 1.4 MTOE which is
about 60 per cent of that of Delhi. Personal vehicles will drive this trend in
the future. Already cars and two wheelers together use up about 50 per
cent of the total transport energy consumption in the city. If the dependence
on personal vehicles continues to increase the oil consumption will increase
twice by 2030 with largest increase is forecasted to be from four wheelers.
More energy guzzling will lead to higher emissions of heat trapping
carbon dioxide. This is contrary to the goals set by the National Climate
Action Plan. Among all oil-consuming sectors, CO2 emissions from
transport are increasing at the fastest rate in India – at more than 6 per
cent per annum. This is daunting for any national combat plan for climate.
The growing use of personal vehicles in Hyderabad is increasing carbon
dioxide emissions from the transport sector of the city. The SIM Air study
projections show that the carbon dioxide emissions will increase
substantially from four wheelers by 2030 – as much as 3 times. The city will
have to carefully assess these new challenges to refine regulatory action.
Cities need aggressive technology roadmap: The combined goals of clean
air and energy security will have to drive the technology roadmap in our
cities and the rest of the country. State governments will have to push the
national government to firm up the post-2010 emissions standards and fuel
economy roadmap to reduce emissions and energy impacts of motorization
in cities.
• Post-2010 roadmap should introduce uniform and tighter fuel quality
and emissions standards across the country. Otherwise polluting
vehicles and trucks from outside will undermine the efforts in the city.
• Enforce effective fiscal strategies to discourage diesel cars to reduce
toxic emissions.
• Expand and strengthen CNG programme for the public transport for
environmental gains.
• Incentivise electric vehicles to increase their market share. Hyderabad
already has this policy. Provide infrastructure support as well.
18 >MOBILITY CRISIS
Running to stand still
03
Mobility crisis begins to build up when a large share of
daily trips is made by personal vehicles that occupy
more road space but carry fewer people, pollute more,
and edge out walkers, bicycles, buses. The sign of this
crisis is already evident in Hyderabad.
The city is fighting a losing battle to calm traffic. It is
stepping up expenditure on roads, parking facilities. But
it cannot solve the problem with more roads.
Though vehicle numbers are still a lot less than Delhi
the congestion index is close to that of Delhi. The
densely built compact cities are not designed for
motorized vehicles. But the traffic count and volume
assessed for the key central business districts in the city
are comparable with that of Delhi.
Journey speed during the peak traffic hours have
already dropped significantly. Key commercial areas are
severely affected and gridlocked.
The most worrying are the evidences that the share
of public transport is steadily declining and will slide in
future. This will make the city incur enormous health
and energy costs.
Instead of reversing this trend by scaling up public
transport and non-motorised transport the maximum
investments has gone into roads and flyovers. Learn
from the mistakes of Delhi. Even with the maximum area
under roads Delhi has the worst congestion problems in
the country. The city will have to reinvent mobility for
sustainability and liveability.
CITY ACTION
Centre for Science and Environment
RIGHT TO CLEAN AIR CAMPAIGNYou can also read


