Investing in Michigan's Infrastructure: Building for Economic Growth - Leading Practices in Infrastructure Planning, Funding & Financing with Key ...
←
→
Page content transcription
If your browser does not render page correctly, please read the page content below

Investing in Michigan’s
Infrastructure: Building
   for Economic Growth

 Leading Practices in Infrastructure Planning, Funding & Financing
                        with Key Findings for the State of Michigan
TABLE OF CONTENTS
 1   Executive Summary                                                             3

 2   Current State of Infrastructure Planning, Funding & Policy in Michigan        15

 3   Infrastructure Planning, Funding & Policy Leading Practices Research          26

 4   Key Findings                                                                  36

 5   Appendices                                                                    45
       Leading Practices Research Supporting Case Studies
       Summary of Potential 21st Century Infrastructure Technical Solutions
       Infrastructure Investment Index Prioritization Criteria & Scoring Results
       Project Work Plan
       Infrastructure Subject Matter Expert Interview List
       Report Endnotes

                                                                                        2
1 EXECUTIVE SUMMARY

PROJECT SCOPE & METHODOLOGY
The project scope included a review of Michigan infrastructure data, industry stakeholder
interviews, Infrastructure Commission workshops and a global review of leading practices.

                    Project Focus: Infrastructure Planning, Funding and Financing in the State of Michigan

             INFRASTRUCTURE IN SCOPE                     PROJECT APPROACH                      STUDY INPUTS

                                                     1    Michigan Infrastructure
                                                          Data Review                       30 Industry Experts Interviewed
     Transportation                 Water
                                                     2    Deloitte Infrastructure
        •    Roads             •   Drinking Water                                          15 U.S. Locations Researched
                                                          Expert Interviews
        •    Bridges           •   Dams
        •    Rail              •   Sewer
        •    Airports          •   Storm Water       3
                                                          Infrastructure Industry
                                                          Expert Interviews                15 Global Locations Researched

                                                     4    Global & U.S. Leading
             Energy            Communications             Practices Research               19 Leading Practices Identified
    •       Electricity        •   Fixed Broadband
                                                          BLM / Infrastructure
    •       Gas                •   Mobile Networks   5
                                                          Commission Workshops
                                                                                           28 Leading Practice Case Studies
    •       Alternative Energy •   Telephone

                                                                                    Executive Summary                         4
CURRENT STATE OF MICHIGAN INFRASTRUCTURE –
PHYSICAL LIMITATIONS
Michigan has a major need to rehabilitate deteriorating water, transportation and energy infrastructure.
Communication infrastructure is relatively new and well maintained by the private sector.
                                                                          Current State of Michigan Infrastructure Related
                  Michigan Infrastructure Condition Grades
                                                                                               Issues
                                                           U.S.    Public Health and Safety Risks
                                              Michigan
              Infrastructure Types                       Average
                                               (2009)              • Some critical infrastructure at risk of failure.
                                                          (2013)
              Roads                               D        D       • Significant under-investment in some basic essential services.

              Bridges                             D        C+      Future Economic Growth Risks
              Rail                                D+       C+      • Soo Locks upgrade required to increase logistics reliability.
              Aviation                            C        D       • Limited public transportation options in major cities.
              Navigation / Ports                  C–       C       • Detroit Airport expansion to leverage undeveloped land.
              Public Transport                    D+       D       • Waste water overflows into natural waterways.
              Drinking Water                      D        D       • Broadband speed and coverage expansion required to
                                                                     support economic growth.
              Waste Water                         C        D

              Storm Water                         D+       D–      Infrastructure Funding Risks

              Energy                              C–       D+      • Infrastructure funding gaps are growing rapidly, potentially
                                                                     creating a large burden on future generations.
              Communications                      N/A      N/A
                                                                   • Limited new sources of funding, increasing the role of private
              Overall                             D        D+        investment.
                       C = Mediocre, Requires Attention
                              D = Poor, At Risk
    Source: American Society of Civil Engineers

                                                                                             Executive Summary                        5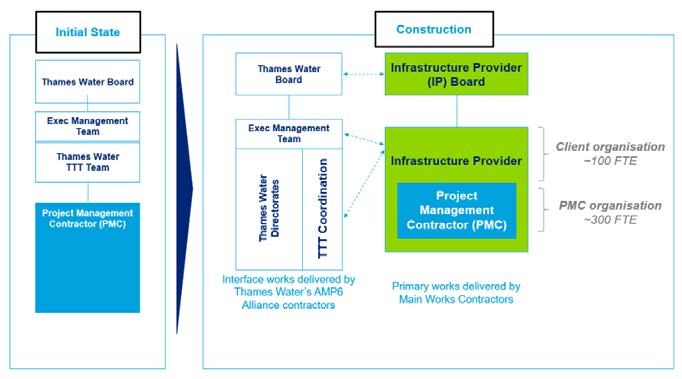
PEER INFRASTRUCTURE SPENDING COMPARISON
There appears to be under-investment in Michigan when compared to similar states and
the U.S. average and this has led to significant current state infrastructure funding gaps.
          State and Local Capital Spend (% of Total Expenditure)                                                   State and Local Functional Spend per Capita
                       Annual Average 2010 – 2014                                                                          Annual Average 2010 - 2014
                                                                                                             U.S. Average                            $795
       U.S. Average                                                             10.6%                           Michigan                   $470

                                                                                           Transportation
                                                                                                               Wisconsin                          $649
                                                                                                                       Ohio                    $553
          Michigan                                     6.4%                                                  Pennsylvania                                $935
                                                                                                                    Illinois                              $978
                                                                                                                   Indiana                 $481
         Wisconsin                                               8.5%                                           New York                                                       $1,651
                                                                                                             U.S. Average                   $536
                                                                                                                Michigan                  $446
              Ohio                                                   9.2%                                      Wisconsin                $395
                                                                                                                       Ohio              $421

                                                                                           Water
                                                                                                             Pennsylvania                 $450
   Pennsylvania                                                         9.4%                                        Illinois             $424
                                                                                                                   Indiana             $358
                                                                                                                New York                     $563
            Illinois                                                     9.8%                                U.S. Average            $274
                                                                                                                Michigan        $107
                                                                                                               Wisconsin           $189

                                                                                           Energy
           Indiana                                                        9.9%                                         Ohio     $92
                                                                                                             Pennsylvania      $72
                                                                                                                    Illinois    $100
         New York                                                                  11.3%                           Indiana           $278
                                                                                                                New York                $341

   Source: U.S. Census Bureau                                                              Note: Chart shows functional spend (Capital Expenditure + Operational Expenditure)
                                                                                           Source: U.S. Census Bureau
   Observations
                                                                                           Observations
   •    Michigan had the lowest % capital spend compared to similar states at 6.4%
                                                                                           •                Transportation: $325 per capita less than the U.S. average (Ranking: 51st)
   •    Michigan spent 4.2% less than the U.S. Average and would need to
        increase (2014) annual capital spending by $4 billion to align                     •                Water: $90 per capita less than the U.S. average (Ranking: 18th)
   •    Michigan spent 2.4% less than the Great Lakes Average and would need to            •                Energy: $167 per capita less than the U.S. average (Ranking: 40th)
        increase (2014) annual capital spending by $2.5 billion to align                   •                Communications spending data not publicly available

                                                                                                                                        Executive Summary                                6
LEADING PRACTICE EXAMPLES –
INFRASTRUCTURE PLANNING & COORDINATION
Innovative infrastructure planning and coordination practices are deployed to increase
accountability, transparency and collaboration in major asset investment decision-making.

            Coordinated Infrastructure Planning        Coordinated Infrastructure Procurement

            Infrastructure Victoria has been         Infrastructure Ontario is an independent
         established to publicly release a 30-year   infrastructure procurement body set up to
          Infrastructure Strategy detailing short,     support the government’s initiatives to
           medium and long-term infrastructure         modernize and maximize the value of
                   needs and priorities.                   public infrastructure and realty.

                Asset Management Practices                   Incentives for Coordination

           Ontario’s Rural Asset Management               The State of Connecticut’s
          Program was launched to help eligible         Regional Performance Incentive
          municipalities and local services boards        Program helps municipalities
          improve and increase their capacity to            reduce costs through the
            manage their infrastructure assets.            regionalization of services.

                                                                     Executive Summary           7
LEADING PRACTICE EXAMPLES –
INFRASTRUCTURE FUNDING SOURCES
Infrastructure funding sources are government cash flows that can be used to support the
construction and operation of infrastructure via. the repayment of infrastructure financing.
Direct / Indirect Taxation User Fees
Oregon has implemented the first Washington DC Water has
voluntary pilot program for Vehicle implemented a Water System
Miles Travelled (VMT) Tax in America. Replacement Fee to recover costs
This program taxes on miles driven associated with renewing and replacing
rather than gallons of gas purchased. water service lines.
Land Value Capture Infrastructure Leasing
Toronto’s Metrolinx Project administered The State of New South Wales in
a fee to property owners, including Australia leased part of its electricity
developers and home buyers, to capture network to raise money for an
the increase in property value due to the infrastructure development fund and
new transportation infrastructure. then “recycled” the investments.
Executive Summary 8LEADING PRACTICE EXAMPLES –
INFRASTRUCTURE FINANCING STRATEGIES
Infrastructure financing strategies are the debt and equity investments that can be made to pay for
projects now, but are then repaid with a minimum return using cash flows over the life of the asset.
Infrastructure Bonds State Infrastructure Banks
The Commonwealth of Pennsylvania
In 2014, Washington DC Water issued
has established separate transportation
$350 million in taxable, green century
and water infrastructure investment
bonds to finance a portion of the $2.6
authorities to leverage Federal & State
billion DC Clean Rivers project to reduce
funds and make low-interest loans for
waste water overflows to waterways.
improvement projects.
Public-Private Partnerships Other Sources of Private Capital
Virginia and Florida are two U.S. states The State of Alaska initiated a public-
that have led the way with the private research effort to find more
implementation of large scale and affordable ways to deliver drinking water
innovative Toll Road Public-Private and sewage disposal services in rural
Partnerships to improve infrastructure areas, including the potential invention of
condition and boost capacity. innovative decentralized water systems.
Executive Summary 9MICHIGAN INFRASTRUCTURE MATURITY / GAP ASSESSMENT
Michigan’s infrastructure planning, funding and financing practices are at diverse levels of
maturity across its different infrastructure platforms, when compared to leading practices.
“Average” “Good” “Leading Practice”
W C E T
Asset
Management Limited asset data Statewide Asset Management Integrated asset data inventory
Practices collection and analytics Framework and Guidelines and risk-based decision-making
T W E C
Coordinated
Infrastructure Limited cross-sector collaboration Committee to determine statewide Independent planning body and
Planning in infrastructure planning infrastructure priorities state infrastructure strategy
T W C E
Reviews &
Approvals Major capital investments Robust business cases, funding Capital investment guidelines and
reviewed on case by case basis allocated to high value investments funding allocation framework
T W E C
Coordinated
Infrastructure Limited cross-sector collaboration in State department dedicated to Independent procurement body
Procurement the procurement of major projects procurement of major projects and facilitate private investment
W T E C
Financing
Strategies Traditional forms of financing like Alternative infrastructure Private financing is introduced
loans, grants and municipal bonds financing models are piloted through public-private partnerships
T W E C
Funding
Mechanisms Traditional forms of taxation and Funding sources diversified with Funding leverages full asset value
user fees utilized as funding source deployment of new mechanisms and integrates true cost to serve
T Transportation Infrastructure W Water Infrastructure E Energy Infrastructure C Communications Infrastructure
Executive Summary 10MICHIGAN INFRASTRUCTURE PLANNING &
PROCUREMENT FINDINGS
States are increasingly addressing infrastructure needs more holistically, with greater
emphasis on coordinated planning, asset management and funding high value projects.
Asset Management Framework, Systems & Processes Coordinated Infrastructure Planning
• Design and implement a statewide • Analyze the statewide
Asset Management Framework and infrastructure priorities to reduce
Guidelines. risk and fuel economic growth.
• Support utilities and local government • Develop a long-term statewide
with implementation of asset infrastructure strategy.
management practices.
• Make infrastructure investment
Operations &
• Build and maintain a statewide Asset Maintenance recommendations to the
Database with analytics. Strategy & Governor and legislature.
Planning
Capital
• Measure improvements in
Investment performance.
Lifecycle
Construction
Procurement
Infrastructure Plan Approval
Coordinated Infrastructure Procurement
• Design and implement major
• Leverage Federal & State Funds.
capital investment guidelines.
• Identify and implement long-term
• Release standard business
innovative funding strategies.
case analysis template.
• Support financing of major projects.
• Agree on a capital
• Facilitate private investment and the prioritization framework to
set up of public-private allocate funding across
partnerships. statewide needs.
Executive Summary 11MICHIGAN INVESTMENT FINDINGS
It is recommended that Michigan raise current annual infrastructure spending levels by
an additional $4B per year to close the investment gap with the U.S. average.
Transportation Water Energy Communications
Michigan Infrastructure • Approximately $2.7B per • Approximately $0.5B per • N/A – largely private • N/A – largely Federal and
Forecast Investment Gaps(1) year year utility funding private funding
• Raise the gas tax • Water Rate Increase
• Energy Rate Increase • Federal Funding
Likely Sources of Funding • Pilot VMT tax • Water Infrastructure
• Private Ownership • Private Ownership
• User Fees Replacement Fee
Michigan vs Great Lakes • Annual Average Capital Spending as a % of Total Spending between 2010-2014 was 2.4% less than the Great Lakes average.
Annual Investment Gap(2) • Michigan would need to increase 2014 annual capital investment levels by $2.5B to match the Great Lakes average.
Michigan vs U.S Average • Annual Average Capital Spending as a % of Total Spending between 2010-2014 was 4.2% less than the U.S. average.
Annual Investment Gap(2) • Michigan would need to increase 2014 annual capital investment levels by $4B to match the U.S. average.
• Michigan to close the annual investment gap with the U.S. average over 5 years.
Michigan Investment
• Our research concludes that the minimum Michigan should increase annual infrastructure spending is $4B to close the
Recommendations
Michigan Infrastructure Investment Gap.
Sources:
(1) Investment Needs & Funding Gaps Defined by Michigan Infrastructure Commission (December, 2016)
(2) Annual Investment Gaps, Michigan vs Great Lakes and U.S. Average, based on Capital Spending data between 2010 – 2014 from the U.S. Census Bureau (see Page 19 of this report for details)
Executive Summary 12RECOMMENDED INFRASTRUCTURE INVESTMENT
PRIORITIZATION CRITERIA
Based on our experience with implementing capital investment frameworks in public sector
organizations, we recommend the criteria below to assist with the prioritization of funding needs.
Expected Value Investment Risk
Compliance / Basic Essential Service / Current and Estimated Future Funding
Public Safety and Well Being at Risk Gap
Alignment with Michigan’s Economic High Capital Cost and Long-term
Goals Implementation Schedule
Building a New
Michigan
Availability of Potential Funding Sources
Rehabilitation of Aging Infrastructure to Address Funding Gap
Public Demand and Unmet Needs Level of Complexity
Other Anticipated Benefits including
Reputational Risk, Public and
Public Visibility, Environmental and
Stakeholder Support
Social Views
Raw
Score 1 2 3 4 5 1 2 3 4 5
Scales Low Value High Value High Risk
Low Risk
Executive Summary 13MICHIGAN’S INFRASTRUCTURE INVESTMENT INDEX
Results show that water infrastructure may provide the greatest expected value on
average, however this infrastructure platform also contains the highest level of
investment risk. Roads and bridges are the highest ranked infrastructure sub-categories.
Michigan’s Infrastructure Investment Index Scoring Results Summary
Highest Infrastructure Infrastructure Expected Invest.
Value Starting Point Roads Plan[Limiter]
Now / Platforms Sub-Categories Value Risk
Bridges
‘Quick-Wins’ Mitigate Risks Roads 5.0 3.4
5 Electricity Drinking Water Bridges 5.0 3.2
Rail 3.6 4.0
Storm Water Sewer Transportation
Airports 3.0 3.6
4 Mobility Dams Ports 2.8 3.4
Mobility 3.6 2.4
Broadband
Expected Gas Rail Drinking Water 4.6 3.4
3
Value Airports Water
Sewer 4.2 3.4
Mobile Storm Water 4.0 2.6
Networks Alternative
Dams 4.0 4.4
2 Energy
Ports Electricity 4.2 3.0
Energy Gas 4.0 2.8
Telephone
Alternative Energy 3.2 2.2
1
Consider Reassess Broadband 3.4 1.8
Lowest Funding Investment Communications Mobile Networks 3.0 1.8
Value Alternatives Needs Telephone 2.2 3.0
Lowest 1 2 3 4 5 Highest Transportation Infrastructure Water Infrastructure
Risk Investment Risk
Risk Energy Infrastructure Communications
Infrastructure
Note: Size of bubble = relative scale of
estimated annual funding gap.
Executive Summary 142 Current State of Infrastructure
Planning, Funding & Policy in the
State of MichiganPROJECT BACKGROUND – THE CASE FOR CHANGE
The Infrastructure Funding and Policy Strategy is intended to address Michigan’s current
and future infrastructure needs and will also provide the guideposts for political and
business leadership in Michigan to assist the state prepare for future economic growth.
2015 2016
Road and Bridge Funding Package Michigan Water Crisis
The State of Michigan, like many states Drinking water supply and
across the country, is currently facing infrastructure issues in Flint
significant infrastructure challenges. In culminated in a lead contamination
2015, Michigan Governor Rick Snyder emergency in 2015 and early 2016.
signed into law a broad road and bridge This issue is still currently being
funding package, however many addressed.
acknowledge that a more holistic Michigan Infrastructure
solution is required to address the 21st Century Infrastructure Commission Funding and Policy Strategy
State’s infrastructure needs. In response to these high profile infrastructure BLM launches a complementary
issues, Governor Snyder created the 21st initiative in March 2016 designed to
Century Infrastructure Commission in March identify actions that can be taken to
2016 as a means of studying the State’s jump-start infrastructure
infrastructure needs and identifying “strategic improvements, by identifying leading
best practices to modernize” transportation, practices other states or nations have
water and sewer, energy and communications taken to address their infrastructure
infrastructure in the state so Michigan’s needs and making recommendations
infrastructure remains safe and efficient now for policy and business leaders
and into the future. (including finance, policy and
administrative actions).
Current State Assessment 16CURRENT STATE OF MICHIGAN INFRASTRUCTURE –
PHYSICAL LIMITATIONS
Michigan has a major need to rehabilitate deteriorating water, transportation and energy infrastructure.
Communication infrastructure is relatively new and well maintained by the private sector.
Michigan Infrastructure Condition Grades Current State Michigan Infrastructure Related Issues
U.S. Public Health and Safety Risks
Michigan
Infrastructure Types Average
(2009)
(2013) • Some critical infrastructure at risk of failure.
Roads D D • Significant under-investment in some basic essential services.
Bridges D C+
Future Economic Growth Risks
Rail D+ C+
• Soo Locks upgrade required to increase logistics reliability.
Aviation C D • Limited public transportation options in major cities.
Navigation / Ports C– C • Detroit Airport expansion to leverage undeveloped land.
Public Transport D+ D • Waste water overflows into natural waterways.
Drinking Water D D • Broadband speed and coverage expansion required to
Waste Water C D
support economic growth.
Storm Water D+ D– Infrastructure Funding Risks
Energy C– D+ • Infrastructure funding gaps are growing rapidly, potentially
creating a large burden on future generations.
Communications N/A N/A
• Limited new sources of funding, increasing the role of private
Overall D D+ investment.
C = Mediocre, Requires Attention
D = Poor, At Risk
Source: American Society of Civil Engineers
Current State Assessment 17THE NEED TO INVEST IN NEW INFRASTRUCTURE TO
SUPPORT ECONOMIC GROWTH
Business Leaders for Michigan has identified six key assets and opportunities to accelerate the
economy and each infrastructure platform plays a role in driving economic growth.
Six Assets and Opportunities to Accelerate Michigan’s Job, Personal Income and Economic Growth
Six Higher Education Health & Medical
Assets
Engineering Talent Geographic Location Automotive Industry Natural Resources
System Expertise
Global Engineering Higher Education Natural Resources
Opportunities Gateway to the Midwest Life Sciences Hub Global Center of Mobility
Village Marketplace Economy
Invest in infrastructure
Lead in sustainable mobility
Strengthen quality, that promotes natural
&multi-modal systems
affordability, productivity resources industries
●
& economic impact Create a Hub for bio- ●
Brand the engineering Consolidate logistics base Lead in vehicle/
● pharmaceutical R&D Expand & promote MI’s
sector into Michigan infrastructure technology
Potential Grow university ● tourism and outdoor
● ● ●
ways to enrollment Become the center for recreation amenities &
Grow engineering Scale Aerotropolis Ensure MI remains a top
leverage the ● research, testing & services
education capacity ● three region for global R&D
assets Grow industry & university medical labs ●
● Invest in strategic trade- spending and employment
funded R&D ● Focus public and private
Grow engineering firms related infrastructure ●
● Grow medical tourism R&D activities on
Catalyze growth in advance
Grow commercialization sustain-able natural
and interactive, smart,
of R&D resources products and
connected transportation
processes
Source: BLM Building a New Michigan Framework
Infrastructure Impacting the Ability to Grow the Economy
Six Higher Education Health & Medical
Assets
Engineering Talent Geographic Location Automotive Industry Natural Resources
System Expertise
Transport High Impact High Impact High Impact High Impact High Impact High Impact
Water Low Impact Medium Impact Low Impact Medium Impact Medium Impact High Impact
Energy Low Impact Medium Impact Low Impact Medium Impact Medium Impact High Impact
Communic-
ations
High Impact Medium Impact High Impact High Impact High Impact Medium Impact
Current State Assessment 18PEER INFRASTRUCTURE SPENDING COMPARISON
There appears to be under-investment in Michigan when compared to similar states and
the U.S. average and this has led to significant current state infrastructure funding gaps.
State and Local Capital Spend (% of Total Expenditure) State and Local Functional Spend per Capita
Annual Average 2010 – 2014 Annual Average 2010 - 2014
U.S. Average $795
U.S. Average 10.6% Michigan $470
Transportation
Wisconsin $649
Ohio $553
Michigan 6.4% Pennsylvania $935
Illinois $978
Indiana $481
Wisconsin 8.5% New York $1,651
U.S. Average $536
Michigan $446
Ohio 9.2% Wisconsin $395
Ohio $421
Water
Pennsylvania $450
Pennsylvania 9.4% Illinois $424
Indiana $358
New York $563
Illinois 9.8% U.S. Average $274
Michigan $107
Wisconsin $189
Energy
Indiana 9.9% Ohio $92
Pennsylvania $72
Illinois $100
New York 11.3% Indiana $278
New York $341
Source: U.S. Census Bureau Note: Chart shows functional spend (Capital Expenditure + Operational Expenditure)
Source: U.S. Census Bureau
Observations
Observations
• Michigan had the lowest % capital spend compared to similar states at 6.4%
• Transportation: $325 per capita less than the U.S. average (Ranking: 51st)
• Michigan spent 4.2% less than the U.S. Average and would need to
increase (2014) annual capital spending by $4 billion to align • Water: $90 per capita less than the U.S. average (Ranking: 18th)
• Michigan spent 2.4% less than the Great Lakes Average and would need to • Energy: $167 per capita less than the U.S. average (Ranking: 40th)
increase (2014) annual capital spending by $2.5 billion to align • Communications spending data not publicly available
Current State Assessment 19RECENT MAJOR INFRASTRUCTURE PROJECTS IN MICHIGAN
Select state agency major capital improvement plans and projects greater than $100M
implemented over the last five years between 2011 – 2016.
I-96 Improvements US-23 Improvements
I-94
$285M for reconstruction Improvements $123M for reconstruction and modernization
and new interchange $218M for M-1 Rail (Qline)
reconstruction and $131M reconstruction of M1 to
modernization include rail line
Upper Peninsula Region Southfield Freeway
$124M for reconstruction and
Electronic Transmission Infrastructure Power Growth
new alignment in 2015
$2.6B investment to improve grid performance
and reliability and connect new generations Ambassador Bridge Gateway
M-231; US-31 NB / I-96 / M-104 Improvements $254M for new alignment in 2012
$151M for new construction (M-231) and reconstruction Northeast
Freeway Lighting
Region
Northwest Freeway Lighting as a public-private
Combined Sewer Overflow (CSO) Region
partnership in a $123M investment for
$250M investment in CSO in Grand Rapids
LED lighting
Grand Rapids Stormwater Management System East Blue Water Bridge Toll Plaza
$37M to upgrade the stormwater management system Central
Region $588M to build a new toll plaza
East
Passenger Rail Corridor West
Region
Region Detroit Energy Overhaul
$430M to acquire and upgrade passenger rail $200M replace and renovate portions
between Kalamazoo and Dearborn South of Detroit’s energy
Central Detroit
Ann Arbor Wastewater Treatment Plant Region Metro
Detroit Wastewater Treatment Plant
Region
$110M for wastewater treatment plant process upgrades $150M for wastewater treatment
Southwest Southeast plant process upgrades
Ann Arbor Solar Farm Region Region
I-75 (Rouge) Monroe County
$2B total investment in solar
$235M for modernization and
farm completed in 2015
reconstruction of road and bridges
Current State Assessment 20FORECAST MAJOR INFRASTRUCTURE PROJECTS IN MICHIGAN
Select state agency major capital improvement plans and projects greater than $100M
forecasted between 2016 – 2020.
Soo Locks
$1B+ for construction of the new lock
could generate as many as 15,000
construction jobs in the eastern
Upper Peninsula
Upper Peninsula Region Flint Water Infrastructure
$195M budgeted for water
infrastructure including replacing
lead pipes
I-75 Oakland and Wayne Counties
Northeast Work commences on $1.3B of
Region
Northwest modernization and reconstruction
Region improvements to I-75
Detroit Intermodal Freight Terminal
New Holland Natural Gas Plant
East $1B for consolidation of freight
$144M to create a new 114-megawatt energy Central facilities and rail improvements
plant in Holland, MI Region
East
West
Region
Region Gordie Howe International Bridge
$2B bridge to connect Canada
South
Detroit
and Detroit. U.S. and Canadian
Central
Region Metro Governments are sharing costs in
Region
a public-private partnership
Ann Arbor Capital Improvements Plan
Southwest Southeast
$901M for 349 projects in 6 years Region Region I-94 Wayne County
ranging from water systems to Work commences on $2.9B of
parking facilities modernization improvements to I-94
Current State Assessment 21TRANSPORTATION INFRASTRUCTURE –
CHALLENGES & OPPORTUNITIES
Michigan recently raised its gas tax, however the expected future revenues will not be
sufficient to pay for the projected costs to build new and upgrade old transportation assets.
Transportation Infrastructure Challenges in Michigan Transportation Infrastructure Opportunities in Michigan
• Road funding allocations still determined using old and outdated formulas. • MDOT is a leader in asset management, a risk management approach that
• Public transport is heavily subsidized, particularly in the Detroit area. can also help negotiate political funding for critical infrastructure projects.
• Bridges that require funding either structurally deficient or functionally obsolete. • Michigan's rail forms a gateway to the mid-west from Ontario, Canada.
• There are 696 structurally deficient bridges in Michigan, all on local roads. • The Michigan Ports Strategy was recently released in June 2016.
• Soo Locks are very old and critical to Michigan's logistics industry. • Detroit Lighting was innovative P3, lower energy costs and better service.
• Estimate about $86.5B necessary over 25 years, doubles current funding level. • Michigan Governor is applying pressure to move Soo Locks Upgrade forward.
Transportation Infrastructure Spending & Funding Indicators
Highway Spending - Capital Outlay State Gas Taxes & Fees (cents per gallon)
(2010 – 2013) (2012 – 2016)
$3,000,000,000 60
Highway Capital Outlay ($)
$2,500,000,000
Gas Tax (Cents per gallon)
50
$2,000,000,000
$1,500,000,000 40
$1,000,000,000
30
$500,000,000
Michigan Highway Spending Ranking (2013): 25th
Michigan Gas Tax Ranking (2016): 18th
$- 20
2010 2011 2012 2013 2012 2013 2014 2015 2016
Illinois Indiana Michigan New York
Michigan Great Lakes Average U.S. Average Ohio Pennsylvania Wisconsin U.S. Average
Source: U.S. Census Bureau Note: Rates do not include the 18.40 cent/gallon federal excise tax on gas
Source: Taxfoundation.org
Current State Assessment 22WATER INFRASTRUCTURE – CHALLENGES & OPPORTUNITIES
There is limited data available on Michigan’s aging underground water infrastructure
network and investment levels appear to be lower than other infrastructure platforms.
Water Infrastructure Challenges in Michigan Water Infrastructure Opportunities in Michigan
• Limited water asset data inventory due to old underground infrastructure. Aged • Create uniform standards and funding mechanisms to replace failed systems.
lead lines are a major issue in parts of the State.
• Improve water asset data inventory, particularly for storm water assets.
• Water pricing may not incorporate full cost to serve customers, including cost
to rehabilitate or replace aging infrastructure. • Investigate application of MDOT Asset Management Framework to water assets.
• Private wells are often abandoned, improperly constructed, and contaminated • Maximize Federal Loan Programs for water projects e.g. About $800B Federal
from groundwater runoff. Can lead to contamination of local waterways. money has been delivered to roads/bridges and only $500M to water.
• Estimate about $1.2B - $1.5B annual underinvestment in water infrastructure. • Analyze the true cost to serve water customers and potentially adjust rates.
Water Infrastructure Spending & Funding Indicators
Drinking Water State Revolving Fund Allotments Annual Household Water Bill
(2011 EPA 20-Year Drinking Water Needs Survey) of Public and Private Utilities
(2009)
6.0% $60.0 $500
Michigan DWSRF Allotment Ranking (2016): 7th
Michigan Water Bill Ranking (2009): 16th
4.8% $450
20-Year Drinking Water Needs $B
5.0% $50.0
% of Funds Available to States
4.2%
$400
4.0% $40.0
3.2% 3.1% $350
3.0% 2.8% 2.7% $30.0
$300
1.7% 1.9%
2.0% 1.6% $20.0 $250
1.0% $10.0 $200
US AVG MI IL WI IN OH PA
0.0% $0.0
NY PA IN IL OH WI MI Great U.S.
Municipal or Local Government Owned Private or Investor Owned
Lakes Average
Average
Source: U.S. Environmental Protection Agency Source: Foodandwaterwatch.org
Current State Assessment 23ENERGY INFRASTRUCTURE – CHALLENGES & OPPORTUNITIES
A large majority of Michigan’s electricity and gas infrastructure assets are managed by
private utilities.
Energy Infrastructure Challenges in Michigan Energy Infrastructure Opportunities in Michigan
• Increasing disruption to power supply in recent years from weather so system • Vital to repair and replace energy assets due to the direct connection between
resilience and building in redundancy are critical. electricity and water as well as communications.
• Many providers across the State. • There is an opportunity to fund natural gas pipelines at same time with water,
• Difficult for Michigan to lean on other states for power, geography is a limitation. sewer pipelines, roads and communications assets.
• Michigan has many high risk cast iron lines, 30 year cycle before all is replaced. • Modern technological updates in energy e.g. smart meters to analyze outages.
• Closing a number of power generation units due to new environmental standards. • Onshore wind and solar are becoming more economical and cost effective.
Energy Infrastructure Spending & Funding Indicators
CapEx Incremental Investment: Electricity & Natural Gas Energy Source Used for Home Heating (Share of Households)
(2012 - 2015) (2015)
$2.0 120%
$1.8
CapEx Incremental Investment:
Share of Household (%)
Electricity & Natual Gas ($B)
$1.6 100%
$1.4
80%
$1.2
$1.0 60%
$0.8
$0.6 40%
$0.4
20%
$0.2
$0.0 0%
Generation Distribution Storage Transmission Distribution Michigan U.S. Average
(2015) (2015)
Electricity Natural Gas
2012 2013 2014 2015 Natural Gas Fuel Oil Electricity Liquefied Petroleum Gases Other/None
Note: Values are capital expenditures by DTE Energy & Consumers Energy are are approximate Source: U.S. Energy Information Administration (EIA)
Source: Michigan Agency for Energy, Michigan Public Service Commission, May 2016
Current State Assessment 24COMMUNICATIONS INFRASTRUCTURE – CHALLENGES & OPPORTUNITIES
Michigan’s communications assets are relatively new and the highest priorities right now
are improving school and public access to high speed internet and new technology.
Communications Infrastructure Challenges in Michigan Communications Infrastructure Opportunities in Michigan
• Broadband is 90% is privately owned and only present in parts of the State. • Technology boom has only been the last 20 years, so very new infrastructure.
• There are about 145 private providers and schools are Federally funded. • Copper infrastructure encourages companies to switch to fiber due to
• Access on phone can be faster than home connection. maintenance costs.
• Long-term communications goals for Michigan are currently unclear e.g. is it • Opportunity to become a national leader in communications innovation,
100MB universal access and then where are the gaps? particularly if Michigan is to lead autonomous vehicles, smart highways.
• Assets often built in isolation, limited coordination with other infrastructure types. • What speeds and accessibility levels are appropriate for Michigan?
Communications Infrastructure Spending & Funding Indicators
Household Broadband Download Speeds Household Broadband Penetration
(2015) (2015)
100.0% 95.0% 92.9%
95.2%
95.0% 93.6% 90.0%
92.9% 88.0%
90.0% 85.0% 81.9% 87.8% 80.1%
82.8%
85.0% 80.0%
85.3% 86.4%
80.0% 75.0%
75.0% 70.0%
72.0% 71.9%
70.0%
65.0%
66.6%
65.0% 64.8%
60.0%
60.0% Percent of Households with Percent of Rural Households Percent of Rural Households
10 Mbps / 1 Mbps 25 Mbps / 3 Mbps 100 Mbps / 3 Mbps Access to at Least Two with 10 Mbps / 1 Mbps with 25 Mbps / 3 Mbps
Carriers (10 Mbps / 1 Mbps) Available Available
Michigan Great Lakes Average U.S. Average
Michigan Great Lakes Average
Source: Connect Michigan, National Broadband Map Source: Connect Michigan, National Broadband Map
Current State Assessment 253 Infrastructure Planning,
Funding & Policy Leading
Practices ResearchPROJECT SCOPE & METHODOLOGY
The project scope included a review of Michigan infrastructure data, industry stakeholder interviews,
Infrastructure Commission workshops and a global review of leading practices.
Project Focus: Infrastructure Planning, Funding and Financing in the State of Michigan
Infrastructure in Scope Project Approach Study Inputs
1 Michigan Infrastructure
Data Review 30 Industry Experts Interviewed
Transportation Water
2 Deloitte Infrastructure
• Roads • Drinking Water 15 U.S. Locations Researched
Expert Interviews
• Bridges • Dams
• Rail • Sewer
• Airports • Storm Water 3
Infrastructure Industry
Expert Interviews 15 Global Locations Researched
4 Global & U.S. Leading
Energy Communications Practices Research 19 Leading Practices Identified
• Electricity • Fixed Broadband
BLM / Infrastructure
• Gas • Mobile Networks 5
Commission Workshops
28 Leading Practice Case Studies
• Alternative Energy • Telephone
Leading Practices Research 27LEADING PRACTICE RESEARCH & ANALYSIS PLAN –
OVERVIEW
The recommended strategies are based on a combination of existing Michigan data,
stakeholder interviews, Commission workshops and a global review of leading practices.
Research Guiding Elements Research & Analysis Approach
• Innovative Solutions – search
1 Preliminary 2 Stakeholder 3 Final Data 4 U.S. Leading
for creative and recent
Data Request Interviews Request Practices
infrastructure planning, funding
Capture all of the Gain additional Create a final Research
and policy solutions that have
been recognized as leading existing relevant qualitative data and data request Research
practice. data available insights on current following strategies
from State of state challenges discussions deployed by Great
• Holistic Solutions – search Michigan Agencies and opportunities about available Lakes states, then
for solutions that have been on the current during interviews data in look at other U.S.
designed to address multiple state of Michigan’s with key project stakeholder states with similar
issues across different infrastructure stakeholders interviews characteristics to
infrastructure categories. Michigan
• Successful Solutions –
search for solutions that have
been proven to be successful 8 Recommended 7 Data 6 BLM / 5 Global Leading
in dealing with challenges Strategies Analysis Commission Practices
related to specific infrastructure Workshops Research
Summarize and Complete high level
categories. prioritize and discrete pieces Test research and Research
recommended of analysis as analysis findings with strategies
• Applicability to Michigan – the Infrastructure deployed by
search for solutions that align strategies based on required to evaluate
alignment with current state and to Commission to nations or states
with current state infrastructure confirm applicability with similar
issues in Michigan (see next overarching vision determine viability
for State of Michigan of strategies and gain additional characteristics to
page for benchmark insights Michigan
locations)
Leading Practices Research 28LEADING PRACTICES RESEARCH & ANALYSIS PLAN –
BENCHMARK LOCATIONS
The initial search for solutions focused largely on the 30 benchmark locations outlined
below, so that the research process and applicability to Michigan could be streamlined.
Similar Similar Infrastructure Infrastructure Innovative
Infrastructure Economy Spend Grade Infrastructure
Description Similar Infrastructure Economic Largest % Best Quality Most Innovative
Assets Competitors Infrastructure Spend Infrastructure Infrastructure
Comparison Peers Peers Leading Leading Leading
Latest Infrastructure Industries % Capital Investment Infrastructure
Presence of Tech
Measures Categories Present of Total Spend Condition Grades
Region USA
Rank - #1 Illinois Tennessee South Dakota Colorado New York
Rank - #2 Indiana Georgia North Dakota Utah California
Rank - #3 Ohio Alabama Alaska Texas Florida
BLM Benchmarking BLM Benchmarking U.S. Census Bureau ASCE Reports 100 Most Innovative
Data Sources
Report Report Data (2013)1 (2013)3 Infrastructure Projects5
Region Global
Rank - #1 Ontario, Canada Sunderland Region, France Hong Kong, China London, UK
North-East England
Rank - #2 Quebec, Canada Lower Saxony, Switzerland Singapore, SE Rotterdam, The
Germany Asia Netherlands
Rank - #3 New South Wales, Shiga Prefecture, Germany United Arab Barcelona, Spain
Australia Japan Emirates
Data Sources Internet Research – Internet Research- Standard & Poor’s World Economic 100 Most Innovative
Similar Infrastructure Manufacturing Hubs Report (2015)2 Forum Report (2015)4 Infrastructure Projects5
Region Rest of the World
– additional locations will be identified as required through further research & interviews with Subject Matter Experts.
Notes: 1 Census Bureau data on capital spending include the costs of construction and of the purchase of buildings, equipment, and land and of major alterations.
2 Standard & Poor’s Ratings Services, Global Infrastructure Investment Report, 2015.
3 Latest U.S. American Society of Civil Engineers Report Card by State utilized from 2013.
4 World Economic Forum Global Competitiveness Report, 2014-15.
5 KPMG 100 Most Innovative Projects, World Cities Edition, 2012.
Leading Practices Research 29LEADING PRACTICE OBSERVATIONS – OVERALL SUMMARY
Our leading practice research has shown that State Governments are increasing their focus on key
elements of the capital investment lifecycle to direct funds towards high value, high risk projects.
Infrastructure Asset Management Framework, Systems & Processes
Infrastructure Planning Body
• Coordinated organizational activities designed to realize the full value of assets over the
whole lifecycle, from monitoring asset performance, identifying investment needs, • Focus is on high value and high risk needs.
rehabilitation of old assets, construction of new assets to ongoing maintenance. • Typically a multi-sector view.
• State Governments are designing and implementing standard frameworks, systems and • Traditionally coordinated by in-house state
processes for asset management activities to ensure a coordinated approach. department, however control is recently being
• A coordinated approach can be used to manage large and small assets, to capture and transferred to an independent statutory authority to
analyze asset data and to develop investment priorities in a consistent manner. coordinate integrated planning efforts.
• Adherence to asset management standards can provide • This move is designed to remove political influence
the State Government with assurance that state over infrastructure planning processes and to increase
agencies and municipalities understand the current transparency to investment decision-making process.
make-up, condition and risks of their asset base and that • Independent statutory authority completes a long-term
capital investment priorities being put forward for Operations & 20-30 year infrastructure plan and tables high priorities
evaluation have been prioritized based on asset value Maintenance for the state.
and risk. Strategy &
• A capital investment framework is typically used to
Planning
prioritize recommendations.
• Coordinating body liaises with relevant state agencies
Capital
and regional representatives on infrastructure needs.
Investment
• Plan is typically updated every 5 years.
Lifecycle
• Planning process includes economic development
Infrastructure Delivery Body indicators and statistics.
Construction
• Focus is on high value and high risk needs. • State citizens are engaged in development of the plan.
• Can be either a multi-sector or sector specific view. Procurement
• Traditionally coordinated by in-house state department, Infrastructure Plan Approval
however control is recently being transferred to an
independent statutory authority to coordinate infrastructure • State Government reviews and challenges long-term
financing, identify alternative funding sources, encourage infrastructure plan priorities and recommendations.
private investment activity and realize expected benefits. • Final approval of the long-term infrastructure plan is
• If sector specific, delivery body can sit within the relevant retained by the State Government.
state department. • State Government decides how much funding to
• Set up of a delivery body can send a signal to the markets commit to the plan and execution timing.
that public-private partnerships are a priority. • State Government reviews and approves major
• A delivery body can coordinate sale of assets in addition to projects as they are developed and progress through
construction of new assets. a pre-defined state gate process.
Leading Practices Research 30LEADING PRACTICE OBSERVATIONS –
INFRASTRUCTURE PLANNING AND COORDINATION
Innovative infrastructure planning and coordination practices can be deployed to increase
accountability, transparency and collaboration in major asset investment and delivery decisions.
Leading Practices Description High Level Examples Case Studies
Long-Term Preparing and publishing a long-term Infrastructure Strategy at the State Government level, • State infrastructure strategies and plans. • UK National
Infrastructure Needs detailing short, medium and long term infrastructure needs and priorities. Collective view across • Long-term planning horizon 30 years. Infrastructure Plan.
broad range of infrastructure categories, which is extending to include social infrastructure. Refresh • Typically 5-year update cycle. • New York Works Task
the strategy every 5 years and engage the public as a key stakeholder to provide feedback on plan. • Broader definitions of infrastructure. Force.
• Online interactive infrastructure maps.
Coordinating Bodies Creation of an independent statutory authority to provide expert research and advice to • Dedicated Independent Infrastructure • Infrastructure Victoria.
governments on infrastructure needs, planning priorities and to assist with the development of Bodies in Australia and Canada. • Infrastructure Ontario.
project procurement in cooperation with private investors. These coordinating bodies are often led • Detailed business case reviews and
by a board comprising members from both the private and public sectors. investment advice to government.
• Bundling projects together for private
investment.
Infrastructure Asset Cascading Infrastructure Asset Management Frameworks & Guidelines from State Government • Asset Management Program Mandates. • Asset Management in
Management down to Municipal level to set standards for asset inventory data collection and risk based asset • Regulators enforcing global standard for Australia.
Frameworks & planning / capital expenditure program decision-making. asset management ISO-55000. • Ontario’s Rural Asset
Processes • Michigan Transportation Asset Management Plan.
Management Council.
Capital Investment A capital investment framework is becoming more common at the state government level as a tool • Capital investment framework developed • Virginia DOT Smart
Decision-Making for scoring of projects by value and risk and this process allows an infrastructure investment collaboratively by key state government Scale Program.
committee to assess, rank and prioritize projects across different infrastructure types. With the stakeholders and published online for the
limited availability of funding, there is becoming an increasing need to consider the economic public to view and provide feedback.
returns when selecting our infrastructure investments and to prioritize high return investments. • State-wide capital investment guidelines.
A capital investment framework can be a powerful and transparent approach to overcome political
interests, focus on critical priorities and to balance the overall portfolio of projects, particularly the
competing priorities between rehabilitating existing infrastructure vs. investing for economic growth.
Incentives for Creating incentives to encourage greater collaboration between infrastructure planning agencies • Reward organizational operational • Connecticut Regional
Coordination and utilities so that productivity/efficiency gains can be achieved. efficiency gains with grants or funding. Performance Incentive
• Regionalize or integrate services between Program.
Also consider incentivizing industries and organizations to become more efficient at spending large and small utilities.
infrastructure funding by reviewing operational performance and also seeking opportunities to • Synchronization of state-wide project
achieve industry consolidation to ease burden on smaller utilities. permitting and reviews/approvals.
• Encourage industry collaboration.
Regulatory Reform Regulatory reform can also unlock better usage of existing infrastructure and use of multi-sectoral • Reducing infrastructure demand • South Africa Renewable
long term strategies can reduce complexity and time between planning and implementation. Rates • Policies that enable full or partial private Energy.
are regulated and asset/risk management standards are enforced by public utility commissions. ownership of assets.
Leading Practices Research 31LEADING PRACTICE OBSERVATIONS – INFRASTRUCTURE
FUNDING SOURCES
Infrastructure funding sources are government cash flows that can be used to support the
construction and operation of infrastructure via the repayment of infrastructure financing.
Leading Practices Description High Level Examples Case Studies
Direct/Indirect Taxation Use of direct or indirect taxation as a payment of funds for the use of infrastructure. Many states • Many states targeting an increase in the • NJ & Illinois Gas Tax,
Revenues in the U.S. have found it difficult to gain approval to raise taxes as a method for paying for gas tax to pay for roads and bridges. Oregon Vehicle Miles
infrastructure in previous years, however public appetite seems to be improving. Traveled Tax.
User Fees User fees allow cities and other local jurisdictions to impose fees to cover the cost associated • Create road user license fees. • Transportation Pricing in
with funding services and enhancements to increase the quality of life and cover administrative • Congestion pricing. Colorado.
and regulatory processes. • Road usage surcharges.
Full-Cost Pricing Consider appropriate pricing of related/substitute infrastructure services such as public transport • Water utility pricing and/or public • DC Water System
which is currently subsidized, to enable ongoing funding while at the same time meeting transport pricing may be subsidized. Replacement Fee.
social/equity objectives. • Incorporating the full cost to serve
customers, including the upgrade of
aging and failing infrastructure.
Land Value Capture Land Value Capture is a way to capture the increase in the value of land and development • Added value generated around the • Metrolinx Land Value
generated by the improved accessibility of transportation. Improved access has value which is development of transit stations. Capture in Toronto.
reflected in land and property values just like property which has waterfront views.
Infrastructure Leasing Also known as “asset recycling”. A state or local government leases (for 50 to 99 years) existing • Use funds from long-term leases to pay • Rebuilding NSW in
revenue-producing infrastructure assets (airports, seaports, toll roads, electric utilities, for other asset investments e.g. cash Australia.
transmission grids, etc.) to investment funds and pension funds—and uses the proceeds from the from port sale into rail.
lease to pay for needed new infrastructure projects.
Partial Asset Sales Some assets may show potential for capital reform should certain criteria be met such as a • Full or partial sale of land or other public • Port Covington
materiality threshold, overall utilization, operating costs, condition rating and if there is a assets. Redevelopment in
precedent for treatment of similar assets. • Sale of obsolete ports to developers. Baltimore.
Full Privatization of Transfer of public companies to private owners and operators as a method for increasing • Introduction of Independent Power • UK Water Industry
Infrastructure efficiency and creating competition in a particular sector. Producers to create competition. Privatization.
• Private ownership of water assets.
Leading Practices Research 32LEADING PRACTICE OBSERVATIONS – INFRASTRUCTURE
FINANCING STRATEGIES
Infrastructure financing strategies are the debt and equity investments that can be made to pay for
projects now, but are then repaid with a minimum return using cash flows over the life of the asset.
Leading Practices Description High Level Examples Case Studies
Federal Grants & Loans The federal government funds highway construction primarily with grants, while it • TIFIA (Transportation Infrastructure • Texas Central High Speed Rail.
subsidizes drinking water and wastewater projects with low-interest loans. The Federal-Aid Finance and Innovation Act)
Highway Program (FAHP) funds a large majority of the costs for Interstate System and • WIFIA (Water Infrastructure Finance
non-Interstate System projects with states covering the remaining costs. Administered at and Innovation Act)
the state level, the EPA’s Drinking Water State Revolving Fund (DWSRF) and Clean Water • RRIF (Railroad Rehabilitation &
State Revolving Fund (CWSRF) provide low interest loans for drinking water and Improvement Financing)
wastewater infrastructure projects. • Water State Revolving Funds (SRFs)
State Infrastructure Infrastructure banks provide low-interest loans to help fund projects in the State with the • Low-interest loans from Federal and • California & Pennsylvania
Banks overarching objectives of leveraging State and Federal funds, accelerating priority projects, State sources for transportation and Infrastructure Banks.
driving economic development and assisting local government needs. The banks can be water projects.
set up with a focus on supporting projects in one particular infrastructure sector or they can
also have a multi-sector focus.
Infrastructure Bonds Infrastructure bonds are borrowings to be invested in government funded infrastructure • Tax-exempt municipal bond market • DC Water Green Bonds.
projects. They are issued by governments or government authorized infrastructure that is unique to the U.S.
companies or non- banking financial companies. New types of infrastructure bonds • Direct pay taxable bonds (Build
designed with environmental incentives are becoming more common in the U.S. market. America Bonds or BABs)
• Tax-exempt qualified Private Activity
Bonds (PABs)
• Green Infrastructure Bonds.
Public Private Public Private Partnerships (PPPs) are agreements between a public agency (federal, • Many toll roads are built and operated • Virginia & Florida Road PPPs.
Partnerships state, or local) and a private-sector entity that uses the specific skills and assets of each as PPPs. • Detroit / Canada Bridge PPP.
sector and balances the project risks between all parties. Fundamentally, a PPP is the • Some bridges, airports, water and • Pennsylvania Rapid Bridge
payment of a lump-sum to the public entity in exchange for the stream of future revenues. energy assets are also redeveloped as Replacement PPP Program.
PPPs. • Bayonne, NJ Water PPP.
• PPPs typically involve private company • Denver Airport Link PPP.
investors (contractors / operators),
private equity infrastructure funds
and/or institutional investors.
Special Purpose Setting up a brand new infrastructure operating company specifically to build, operate and • A unique infrastructure financing model • Thames Tideway Tunnel, London.
Infrastructure Providers own major infrastructure. Levering private money to finance major infrastructure and was recently developed for the Thames
funding it under a regulated environment. Tideway Tunnel project in London, UK.
Other Sources of Direct private investment in infrastructure is increasing and other sources of private capital • Venture capital funds. • Alaska Water & Sewer Challenge.
Private Capital include; venture capital funds, seed capital from crowdfunding and investments from • Crowdfunding. • Missouri Solar Road Crowdfunding.
private companies with an interest in developing specific infrastructure. • Private developers. • LinkNYC Wi-Fi.
Leading Practices Research 33LIST OF SUPPORTING CASE STUDIES (1/2)
# Case Studies* Leading Practice Description
• The National Infrastructure Plan sets out what will be built and where, focusing specifically on nearly £300 billion
1 UK National Infrastructure Plan Long-Term that will be delivered over the next 5 years to 2020-21. It also includes housing & social infrastructure.
Infrastructure
Needs • The task force brings together finance, labor, planning and transportation professionals to coordinate a
2 New York Works Task Force
statewide infrastructure plan and strategic allocation of capital investment funds.
• Once established, Infrastructure Victoria will be required to publicly release a 30-year Infrastructure Strategy
3 Infrastructure Victoria
Coordinating detailing short, medium and long-term infrastructure needs and priorities. It will be updated every 5 years.
Bodies • Infrastructure Ontario is an Independent Infrastructure Authority set up to build, manage, finance, and enhance
4 Infrastructure Ontario
the value of Ontario public assets. There is a strong focus on procurement through public-private partnerships.
Infrastructure Asset Management in • Pressure to prioritize capital and operating budgets with limited funding and the increasing risks from an aging
5 Infrastructure Asset
Australia asset base are the largest drivers of asset management frameworks in Australia.
Management
• The governments of Canada and Ontario launched an Asset Management Program component of the Canada-
Ontario’s Rural Asset Management Frameworks &
6 Processes Ontario Municipal Rural Infrastructure Fund. An investment of up to $6 million to help eligible municipalities and
Plan
Local Service Boards with asset management planning and capacity building.
Capital Investment • In 2014, Virginia changed the way transportation projects are selected. Political wish lists have been replaced
7 Virginia DOT Smart Scale Program
Decision-Making with an objective, data-driven and transparent decision process, making the best use of limited state funding.
Connecticut Regional Performance Incentives for • The State of Connecticut’s Office of Policy and Management administers a State Grant program to help
8
Incentive Program Coordination municipalities reduce costs through the regionalization of services.
South African Renewable Energy • The Renewable Energy IPP Program is a flagship program through which a total of 4,322MW has been
9 Regulatory Reform
Independent Power Producers procured in less than four years to reduce reliance on fossil fuels and stimulate the renewable energy industry.
• New Jersey currently considering cut to sales tax by 1 percentage point for raising the gas tax by 23 cents per
NJ & Illinois Gas Tax & Oregon
10 Direct Taxation gallon. Illinois currently considering a 30 cents per gallon hike. Oregon is piloting a voluntary VMT tax which has
Vehicle Miles Traveled (VMT) Tax
technology installed to record sum of distances traveled by all vehicles in a specified system of highways.
• Colorado’s ‘FASTER’ Program generates $200m per year for state transportation projects to counter a low gas
11 Transportation Pricing in Colorado User Fees
tax and increase in fuel efficient vehicles. Funds are from registration fees, bridge surcharges and rental fees.
Washington DC Water System • In 2015, DC water implemented a new charge to help pay for repairing and replacing the city’s aging water
12 Full-Cost Pricing
Replacement Fee pipes, which expected to generate $40m annually and is based the size of pipes serving homes and businesses.
Metrolinx Land Value Capture in • This project recognizes that improved connectivity from new transit systems and facilities generates increased
13 Land Value Capture
Toronto, Canada land and development value and that a portion of this increased value should go towards funding the project.
‘Rebuilding NSW’ Asset Recycling Infrastructure • Asset recycling is a new, efficient form of financing which is monetizing old assets to pay for the new. NSW,
14
in Australia Leasing leased part of electricity network to raise money for infrastructure development fund. Process repeats over time.
* Note: Please refer to the Appendix for the Supporting Case Studies
Leading Practices Research 34You can also read