Support tool (toolbox) for overall design of low-carbon Value-Added Services for freight and people - Interreg Central Europe
←
→
Page content transcription
If your browser does not render page correctly, please read the page content below
WPT2
Innovative Tools to increase acceptability and effectiveness of low-
carbon mobility policies for city centers

Activity A.T2.2
Identification and detailed design of Value-Added services for LEZ

Deliverable D.T2.2.2                                      Version 1
Support tool (toolbox) for overall                         11 2017
design of low-carbon Value-Added
Services for freight and people
Author:
    Comune di Torino

    Version:                                   Date of version:
    Final version                              30/11/2017

    Project:
    SOLEZ

    Duration of the project:
    36 Months

    Project coordination:

    Comune di Vicenza

    The sole responsibility for the content of this document lies with the authors. It does
    not necessarily reflect the opinion of the European Union

    A T 2.2
2
TABLE OF CONTENTS

    1 Introduction ............................................................................................4
    2 How to use the SOLEZ supporting tool (toolbox)..................................................6
       2.1 SOLEZ toolbox for design and implementation of VA services in FUAs..…………………..……6
    3 SOLEZ supporting tool: Value-Added services / pull measures .................................7
       3.1 Passenger and freight transport Value-Added services ............................................... 7
       3.2 Carpooling integrated with public transport (innovative apps) ...................................... 9
       3.3 Innovative services in passenger transport interchanges ........................................... 16
       3.4 Mobility as a Service (MaaS) schemes .............................................................. 27
       3.5 Multi-users lanes (priority bus lanes sharing with freight vehicles) ................................ 39
       3.6 Alternative delivery services for shoppers (B2C last-mile delivery by cargo bikes) ................ 44
       3.7 Green last-mile logistics services (B2B last-mile delivery by cargo bikes) ......................... 50
    4 Towards Value-Added services application in the pilots ....................................... 59
    5. References........................................................................................... 62
    6. Annexes .............................................................................................. 64
          Annex I - SocialCar self-assessment tool (Source: socialcar-project.eu) ..................... 64
          Annex II - MaaS Readiness Level Indicators (Source: CIVITAS ECCENTRIC) .................... 68
          Annex III - Multi-users lanes regulation (City of Turin) ........................................ 68
          Annex IV - Cycle logistics business planner (Source: cyclelogistics.eu)....................... 74
          Annex V - Summary of costs of cargo bike versus traditional van (Source: cyclelogistics.eu)
          ...................................................................................................... 80

    A T 2.2
3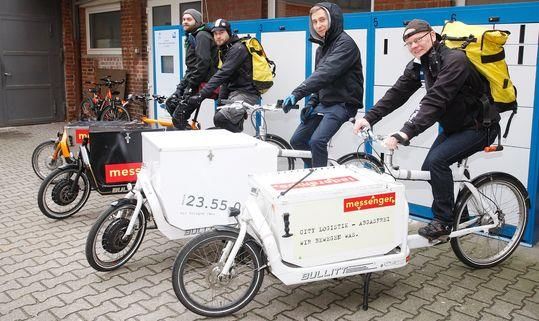
1 Introduction

    This document provides overall and transferable supporting tool (toolbox) for passenger
    and freight value-added mobility services self-assessment and design as pull measures. The
    document provides technical design of value-added mobility services enabling to reduce
    disadvantages produced by traffic restriction policies (e.g. LEZ, LTZ, pedestrian areas,
    etc.) to people living, working or visiting the concerned Functional Urban Areas (FUAs) and
    to increase business opportunities of mobility services suppliers (including sustainable
    passenger and freight mobility services such as carpooling integrated with public transport,
    green last-mile delivery, etc.).

    The overall aim of the SOLEZ toolbox for value-added services is to support Public
    Authorities, transport providers as well as business operators in designing and set-up low-
    carbon mobility services at FUA level enabling to increase LEZ / LTZ / pedestrian areas
    attractiveness and accessibility for people and goods, well-fitting local-based needs and
    patterns, regulatory framework and relevant Action Plans for integration of LEZ policies
    and low-carbon measures in the mobility planning in FUAs.

    VA mobility services are to be considered as organizational measures enabling to incentive
    and promote low-carbon mobility services in target FUAs as an effective alternative
    mobility solution to conventional fossil-fueled transport modes such as private cars, more
    polluting heavy commercial vehicles (HCV) and light commercial vehicles (LCV), more
    polluting urban and peri-urban buses, etc.

    Value-Added (VA) mobility services have to be considered as pull measures being
    organizational interventions to encourage alternative mobility solution to common fossil-
    fuelled transport service.

    The SOLEZ toolbox provides an overall description of most promising, innovative and
    effective pull measures in terms of low-carbon VA services, covering both passenger and
    freight transport in FUAs.

    The SOLEZ toolbox has been elaborated combining top-down and bottom-up approaches in
    order to provide an effective and transferable technical supporting tool for relevant
    stakeholders (including both public and private sector) to design and implement low-
    carbon mobility service for target FUAs including, carpooling system (apps) integrated with
    public transport, promoting the use of public transport interchanges by offering value-
    added services, green last-mile logistics services by Urban Consolidation Centre (UCC) /
    Urban Distribution Centre (UDC) and cargo bike deliveries, multi-user lines (sharing of
    public transport reserved lines with freight traffic), Mobility as a Service (MaaS), etc.

    A T 2.2
4
A T 2.2
5
2 How to use the SOLEZ supporting tool (toolbox)
    2.1 SOLEZ toolbox for design and implementation of VA services at target
    FUAs
    This document provides transferable guidelines for passenger and freight transport in
    urban and peri-urban areas by technical design and specification of Value-Added mobility
    services enabling to reduce disadvantages produced by traffic restriction policies to people
    living, working or visiting the concerned areas (FUAs) and to increase business
    opportunities of mobility services suppliers.

    Value-Added mobility services have to be considered as pull measures being organizational
    interventions to encourage alternative mobility solution to common fossil-fuelled transport
    service.

                  Figure 1: Toolbox for SOLEZ Value-Added mobility services design and assessment

    Value-Added services design and self-assessment for pull measures implementation has
    been developed to enable competent Public Authorities and professionals in target FUAs to
    assess and evaluate technical, organizational and financial applicability of proposed
    mobility services well-fitting sites-based needs and patterns, regulatory/market framework
    and Action Plans. This document provides an overall description of most promising,
    innovative and effective pull measures in terms of low-carbon VA services, covering both
    passenger and freight transport in FUAs.

    Each identified low-carbon VA service (distinguishing between passenger and freight
    transport) is herewith presented and in-depth analyzed based on three key issues / topics
    as follows:

         •    introduction
         •    preliminary self-assessment (readiness level)
         •    overall technical design
    The selection of passenger and freight Value-Added services which are included in the
    toolbox is based on relevant technical knowledge achieved by previous and ongoing
    European research and development projects (within EU Framework Programme, CIVITAS,
    Intelligent Energy Europe, Horizon 2020, etc.) dealing with innovative and low-carbon
    mobility services and ICT-based solutions.

    A T 2.2
6
On the other hand, final selection of passenger and freight Value-Added services to be
    included in the SOLEZ toolbox has been achieved (bottom-up approach) through a
    continuative and structured consultation process implemented in the project target FUAs
    (feeding the elaboration of the respective SOLEZ Action Plan) through the identification,
    design and implementation of Value-Added services respectively in the target FUA of
    Vicenza, Graz, Turin, Sárvár as well as Gdansk.

    3 SOLEZ supporting tool: Value-Added services / pull measures
    3.1 Passenger and freight transport Value-Added services
    Regulations (push measures) adopted in the SOLEZ Functional Urban Areas (FUAs) include
    among the others: Low Emission Zone (LEZ), Limited Traffic Zone (LTZ), Pedestrian Areas
    (PAs), Zone 30, etc.

    Value-Added services are all about pull measures covering both passenger and freight
    transport as follows: car sharing services, carpooling system, traditional and free floating
    bike-sharing services, promoting the use of public transport interchanges by offering Value-
    Added services, green last-mile logistics services by electric vehicles and Urban
    Consolidation Centre (UCC), last-mile logistics services by cargo bikes, multi-user lines
    (multimodal transport corridors), home delivery and/or parking delivery of goods
    purchased in LEZ/LTZ/pedestrian areas, Mobility as a Services (MaaS), etc.

              Figure 2: Examples of Value-Added mobility services: passenger and freight transport

    SOLEZ Value-Added (VA) services will be organizational measures enabling to incentive
    and promote low-carbon mobility services in target FUAs as an effective alternative
    mobility solution to conventional fossil-fueled transport modes such as private cars, more
    polluting heavy commercial vehicles (HCV) and light commercial vehicles (LCV), more
    polluting urban and peri-urban buses, etc.

    The gradual phasing out of conventionally-fuelled vehicles (referring to vehicles using
    internal combustion engines - ICE) using clean and energy efficient vehicles represents one

    A T 2.2
7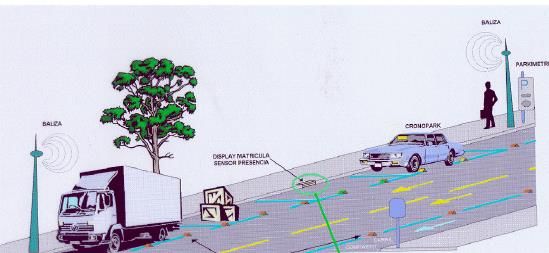
of the key actions addressed to reach a sustainable and low-carbon transport system in
    FUAs, including road passenger vehicles, buses as well as freight vehicles.

    The different transport modes require different options of alternative fuels: road transport
    could be powered by electricity for short distances, hydrogen and methane up to medium
    distance and biofuels/synthetic fuels, hybrid, Compressed Natural Gas (CNG) as well as
    Liquefied Petroleum Gas (LPG) up to long distance. The overall objective is to reduce the
    carbon intensity of transportation.

    Russo and Comi (2012) defined sustainable city logistics as a holistic approach to city
    logistics, that goes beyond zero-carbon and includes social and economic aspects such as
    congestion and quality of life. The table below outlines the impact of different modes of
    transport on economic, social and environmental goals, ranging from negative (-), neutral
    (0) up to positive (+).

              Figure 3: From low-carbon to sustainable city logistics. Based on Russo and Comi (2012)

    Collaborative Economy is a major disruption. “Disruptive innovation, a term coined by
    Clayton Christensen (Harvard Professor) describes a process by creating products\services
    that addresses a market that previously couldn’t be served (a new-market disruption) or it
    offers a simpler, cheaper or more convenient alternative to an existing product (a low-end
    disruption).”

    Currently the Collaborative Economy is a major disruption, which is about sharing and
    creating physical goods and services instead of buying new things, people are sharing
    products with each other in an emerging societal shift called the Sharing Economy. The
    sharing economy is recognised as a global phenomenon influencing many consumer sectors,
    enabling new means of connecting people to share opportunities, assets and markets. The
    term ‘sharing economy’ refers to a market situation in which people share among them
    items and use of different services or resources. In contrast to owning all required
    equipment (like vehicles, flats or commodities) oneself, the sharing economy is gaining
    more attention and acceptance as people increasingly respect an effective use of resources
    and demand to omit maintenance, storage, insurance and/or high operating costs.

    Based on an effective bottom-up approach implemented in SOLEZ by local stakeholders’
    consultation meetings - held for the SOLEZ Action Plans elaboration in the different target
    FUAs – by the results of Steering Committee meetings in Graz (22nd-24 th of February 2017)

    A T 2.2
8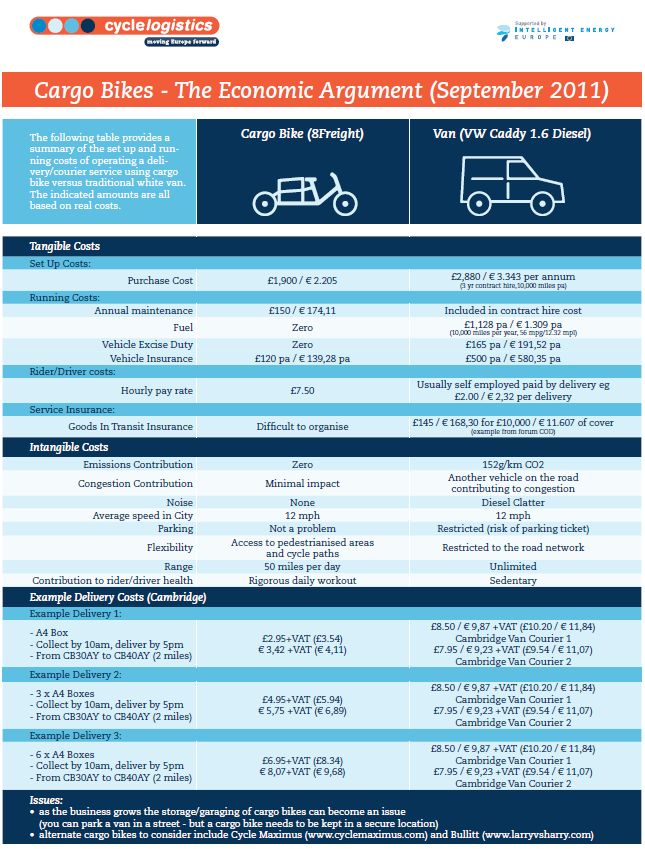
and in Turin (18nd-20th of October 2017), most promising low-carbon passenger and freight
    mobility services selected are listed below.

         •    Carpooling integrated with public transport (innovative apps),
         •    Innovative services in passenger transport interchanges,
         •    Mobility as a Service (MaaS) schemes,
         •    Free access to public transport lanes (multimodal transport corridors),
         •    Alternative delivery services for shoppers (B2C last-mile delivery by cargo bikes),
         •    Green last-mile logistics services (B2B last-mile delivery by cargo bikes).

    3.2 Carpooling integrated with public transport (innovative apps)
    Introduction
    Ride-sharing or carpooling is the sharing of car journeys so that more than one-person
    travels in a car. Ride Sharing happens mostly spontaneous, however technology is used to
    connect people to share their rides. The target groups of ride-sharing systems can roughly
    be divided into the following categories, where individuals can belong to one or several
    groups:

         •    Commuters (trips between home and place of work) with regular or varying times
         •    Business trips (usually during working hours and with start and finish at place of
              work)
         •    Regular everyday trips (to leisure activities for instance)
         •    Occasional everyday trips (to the dentist etc.)
         •    Shorter holiday trips (to IKEA and so on)
         •    Longer holiday trips (to an event or a tourist facility and so forth)
    In public transport, apps have been in use for a relatively long time. Journey planners for
    instance, have been available in many regions for a number of years. Several research
    projects have already exhaustively addressed the features of the different carpooling
    modalities. The step ahead is the integration of carpooling services offering with public
    transport supply (including bus, metro, etc.).

    A T 2.2
9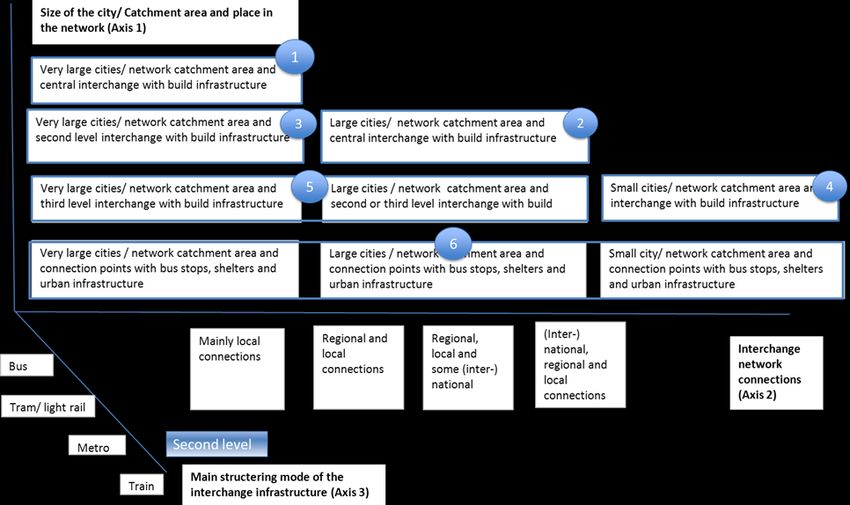
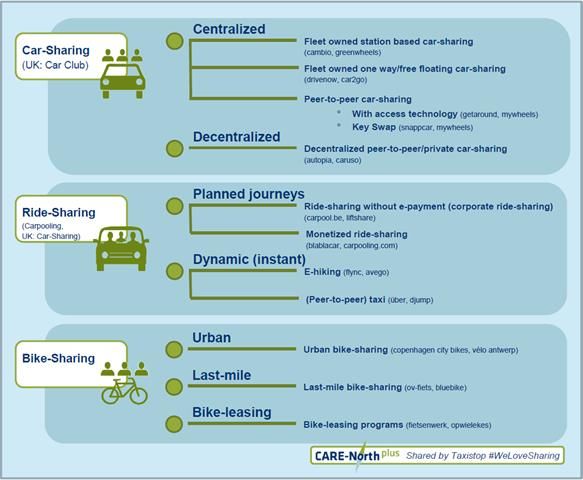
Figure 4: Classification Shared Mobility (Source: Care-North+)
     Carpool success factors:
        • trust
        • information
        • communication
        • costs

     Trust in the organizational structure is very important. This can be obtained through the
     size of the community and the frequency of use. Connection to social media allows
     carpoolers to use their own community to realize a shared ride. Trust related to the
     organization includes: size of community, reputation of the operator (link with local
     authority or public transport could support this), frequency of use, privacy policy,
     verification of user profiles, information on website, communication with organization via
     contact forms, or direct. Trust related to the peer-to-peer experience includes: gender
     segregation, personalization of user profiles (picture, link with social media, music,
     smoking, social media profile), user evaluation by ratings or open textual evaluation, social
     relationship.

     Information features are another important component. If users can’t easily obtain the
     knowledge on how to use a matching platform, this leads to uncertainty. Information
     features are divided into contact form, direct information given on the platform,
     experience reports, forum, assessment tool.

     Communication facilities (e.g. direct personal messages, a blog, a discussion board, etc.)
     are very important for carpooling matching platforms, as they reduce uncertainty and
     information asymmetry existing among carpoolers when deciding on a certain platform.

     A T 2.2
10
Offering the website in multiple languages can further reduce bargaining and information
costs because all users of the community receive all relevant information, and no one feels
excluded. This is especially important for providers offering their services in different
countries. Implementation of Google Maps helps carpoolers to easily check meeting points
and travel route. The main motivation to carpool is to save cost.
No purchase costs are recommended. Paid usage (or a set amount that goes to the
provider) can increase transaction costs and avoid that carpoolers decide to use this
matching platform. The type of payment method can also be relevant. A variety of
payment methods (cash, credit card, PayPal or direct debit authorization) might decrease
transaction costs and increase usage of selected matching platform, since drivers and
passengers select the most suitable payment method.
Preliminary self-assessment (readiness level)
Before the potential design and implementation of this innovative ICT-based solution
enabling to offer multimodal mobility trips at urban and peri-urban level (reducing cars
traffic and increasing public transport use), it is recommended to undertake a preliminary
self-assessment of its applicability and readiness in the target FUAs where the VA services
should be implemented.
A relevant and easy-to-use tool has been developed in the ongoing (06/2015-05/2018)
SocialCar project (Open social transport network for urban approach to carpooling), MG-
7.1-2014 (Connectivity and information sharing for intelligent mobility). SocialCar is an
Intelligent Transport System based on an innovative approach to transport demand
management, and to carpooling in urban and peri-urban areas. SocialCar’s main objective
is developing a new communication network for intelligent mobility, sharing information of
car-pooling integrated with existing transport and mobility systems.
Driving Inconvenience
15
12
Pre-booking, integrated ticket 9
PT Attractiveness
and payment functions
6
3
0
Communications Carpool Status
Data Availability
Figure 5: SocialCar Implementation Roadmap Tool (Source: SocialCar project)
A T 2.2
11Driving conditions
1) Does the city centre experience regular congestion?
2) Do the main routes / corridors into the centre experience regular congestion?
3) How often do other areas of the city experience bad congestion?
4) Are there access restrictions for private vehicles in city centre?
5) Typically, what is the difficulty of finding a parking space in the city centre?
6) What best describes the parking charges in the city centre?
7) Typically, what is the difficulty parking in the other areas of the city?
8) What best describes the parking charges in the other areas of the city?
Public Transport service provision
9) In general, how would you describe public transport (PT) services in the city?
10) In general, how would you describe PT services in the areas surrounding the city?
11) Is there high frequency segregated* services on the main corridors into the city?
12) What best describes Public Transport fares in the city and surrounding areas?
13) How are PT services provided in the city and surrounding areas?
Carpool status in your city/region
14) Regional/citywide public carpool service is provided by the city transport authority
15) A Regional/citywide carpool service is provided by a commercial operator
16) Presence of dedicated (closed) carpool schemes to employment sites
17) Overall, what best describes the carpooling schemes in operation
18) Carpooling has been tried in the past, but no carpool schemes currently operate
19) Do on-demand car services such as Uber or instant (real-time) carpooling services exist?
Data availability
20) Access to accurate static PT data
21) Access to real time PT data
22) Access to planned road network disruptions
23) Access to real time traffic/congestion data
24) Access to real time parking data
25) Access to existing carpool trip offer data
26) Access to mapping data which App developers can utilise
Communications
27) Reliability of mobile network coverage across your Region
28) Availability of free WIFI on PT services
29) Availability of free WIFI in Region
30) Use of Social Media by authorities & PT operators to communicate with travellers
Pre-booking, integrated ticket and payment functions
31) Structure of PT fares applied
32) Is PT journey fare data available?
33) What best describes the level of ticket integration between PT services
34) Is single journey e-tickets / m-tickets available to book & purchase via an app?
35) Can carpool trips be booked and paid for via an app?
Journey Planning (JP) and Travel Information Tools
36) Does the municipality / transport authority offer a well-established journey planning app?
37) Does the main PT operator offer a well-established journey planning app?
A T 2.2
1238) Is there a well-established independent travel info/journey planning app specific to your
Region?
The self-assessment tool is provided in the Annex I - SocialCar Implementation Roadmap
EXCEL Tool
Overall technical description
System architecture consists of programmable hardware elements and included software
components. The SocialCar System Architecture includes the definition of the software
components and their functionality at both ends, the detailed hardware specification of
the multiplatform client side and server side, and the database deployment at the back-
end.
The figure below shows the overall view of the SocialCar system architecture, the two
client applications on top, the used communication protocols in the middle, and the cloud
component at the bottom. The cloud comprises backend and algorithm components as
backend-external services.
Figure 6: SocialCar Architecture overview (Source: SocialCar project)
The frontend, the client side, can consist of an application for Android OS and another for
iOS.
Both applications include the following software components:
• User interface and controllers
• Map interface
• Location service
• SocialCar protocol
• Payment module
A T 2.2
13• Social media interfaces (Facebook, Google+)
• Authentication
• HTTP protocol
The backend (server side) comprises all the modules that implement the business logic of
the system through a few dedicated, typically resource demanding computational
processes. It provides the middleware for connecting the three main algorithmic solutions
(i.e. route planning, destination tagging and reputation assessment) with the frontend, as
well as the back-end services support, such as user profile maintenance and update,
authentication services, database management etc.
A service orchestrator module is also part of the back-end in order to properly map any
incoming requests from the frontend, to the corresponding service, or algorithmic
solutions.
The implementation of the back-end modules is based on the REST design principles and
the JSON format for data interchange. The back-end also manages the data stored in the
database and the communication with the database server, as well as import and
necessary conversion of external data sources, through appropriate wrappers. The backend
platform comes with the following operating system images installed as standard on
dedicated cloud VMs: Ubuntu 16.04, Windows server 2012 R2 as well as Windows 10. The
server-side hardware architecture is cloud based and consists of several virtual machines.
The back-end algorithmic solutions and services are hosted in the cloud as well. The
backend architecture diagram provides an integrated view of all modules, as well as
details on how they communicate with each other in terms of the information they
exchange.
Figure 7: SocialCar backend architecture (Source: SocialCar project)
A T 2.2
14The communication between the frontend and the backend is built on HTTP (HTTPS when
sensitive data is transmitted) and uses a proprietary protocol modelled through a
REST/RPC architecture; message protocol are represented by JSON format and eventually
a compressed encoding is used to optimize bandwidth usage. The communication
mechanism is generally synchronous, except for push-messaging. The application uses a
caching mechanism to avoid wasteful queries.
The backend acts as the pivotal point of all transport related information aggregated by
the system from external sources (e.g., user positions from devices, rides from external
carpool providers, etc.), or service-oriented metadata (e.g., routing results, user
evaluations, etc.) stored and continuously updated within. All these raw data and
metadata are then at the disposal of the core services: the Route Planning service aims to
integrate public transport with private services including carpooling, car sharing and other
on-demand services. The Ride Matching service is designed to distribute potential seat
requests on carpooling vehicles and if needed, to dynamically assign travellers to car
poolers. The Destination Tagging service collects and analyses user trajectories for
different purposes, e.g. search for common sub-trajectories among users (travelling peers’
suggestion), or identify the nature of these trajectories (home-work, work-home, home-
leisure, etc.).
The Reputation Evaluation service helps users to decide on whether carpooling with
another person or not. The aforementioned services exchange data with the backend
server by using HTTP requests in a RESTful way. The Route Planner consists of three data
sources, and eight main components:
• GTFS Database: is where all the public transport information is stored following The
General Transit Feed Specification.
• DB Builder: builds the basic data base structure, reads and stores the raw text
“csv” files provided in GTFS into the database.
• OSM XML File: an XML file describing the map following Open Street Map standard
format.
• Carpooling Data: information about the offered carpools, such as routes, starting
date and time of the trip, and maximum capacity offered.
• GTFS Parser: an interface that communicates with the database to parse the raw
data and converts it into the model used by planner.
• OSM Parser: an interface that reads the XML file, and converts the raw data into
the model used by the planner.
• Carpooling Parser: and interface that fetches the carpooling data and converts it
into the model used by the planner.
• Road Network: contains all the information about the current state of the map,
which includes road information, public transportation connections, and carpooling
routes.
• Map Matcher: matches raw GPS coordinates to physical nodes in the road network.
• Spatial Tree: Provides fast access to process a smaller part of the Road Network.
A T 2.2
15• Router: contains the routing algorithm which finds a route between two given
points using the desired forms of transportation.
The Route Planner allow multiple GTFS feeds. GTFS stands for General Transit Feed
specification. It defines a common format to describe schedule, route, stop, fare, and
calendar data for fixed route transit services. GTFS allows public transit agencies to
publish their transit data and developers to write applications that consume that data.
GTFS feed is formed by multiple files. The routes file contains information about the
routes of the transit agency. The calendar and calendar dates files contain schedule
information. The trips and stop times files contain information about the order of visitation
of bus stops for a particular route according to a particular schedule. The shapes file
contains the spatial representation of a route alignment so it can be accurately drawn on a
map.
For business model development, the following objectives should be addressed:
• Minimise subsidy – revenue options should be explored in order that any
requirements for public sector subsidy of the service are minimized.
• Refine a customer-oriented service – adopting a business planning approach helps to
focus attention on: what are the benefits to your users that will attract them to use
the service; and how are you going to communicate with users and retain them as
customers.
• Build beneficial local partnerships to offer traveller incentives – business models
could involve offering incentives to carpoolers (e.g. discount vouchers), based on
an advertising partnership with local businesses that attract users.
3.3 Innovative services in passenger transport interchanges
Introduction
A transport interchange is considered as the driver of urban development in the
neighbourhood. Larger interchanges enable to combine multiple functions, while smaller
interchanges are becoming more important due to land availability and network
development. Travelers need interchanges to be easy to use, accessible and comfortable.
Interchange experience adds to the quality of daily living.
For the intermodal operations and information provision, smart and integrated ticketing as
well as complete and integrated information (covering all available transport modes) are
considered relevant key aspects. Provision of both pre-trip and on-trip information as well
as individual and collective information should allow to increase intermodal journeys
properly using available transport modes. The environmental footprint of transport
interchanges is a key issue for environmental efficiency of interchange operations, and
local energy production for energy efficient operations. Local authorities are key
stakeholders with regards to environmental/energy efficiency.
A T 2.2
16Accessibility to a transport interchange by means of smooth transfers from one mode to
another determines the attractiveness and a high accessibility for all users. An effective
and inclusive interchange should give specific priority to pedestrians and cyclists as the
most vulnerable travelers.
A lively interchange is active both during the day and night and during the entire week and
year. A mix of functions and activities at different times of the day and a service offer
with longer hours are essential. There should be possibilities for both activities and for
resting at lively interchanges.
The NODES (New tOols for Design and OpEration of Urban Transport InterchangeS) tools
enable every interchange manager to create a more efficient, effective and inclusive
urban transport system, bringing together all elements of a clean, energy-efficient, safe
and intelligent transport.
A tool in the NODES project (10/2012 – 09/2015) was defined an item or implement used to
achieve an improved interchange design, building and management. In SOLEZ, the focus is
about VA services as organizational measures (pull measures) enabling to incentive and
low-carbon mobility solutions.
Preliminary self-assessment (readiness level)
A specific benchmark tool for interchanges has been developed in NODES project to allow:
• each interchange authority/operator to classify his interchanges,
• each interchange authority/operator to identify the package of performance
indicators,
• benchmarking his performance in comparison with other similar stations.
Every transport interchange is at a different life cycle stage. It can be in the planning
phase, even not yet been realised. It can also be an old interchange that underwent a
large reconstruction. Each stage in the life of a transport interchange requires a different
set of tools. Identification of interchange type is quite important for performing a
preliminary self-assessment of own respective interchange.
In this respect, six (6) interchange types have been defined within the NODES project as
follows:
1. Long distance interchanges, that are the central interchanges with build
infrastructure in very large cities/wider catchment area (i.e. over 1 million in
habitants);
2. Large size interchanges, that are the central interchanges with build
infrastructure in large cities/ wider catchment area (i.e. between 200.000 and 1
million inhabitants)
3. Second level interchanges, that are second level interchanges with build
infrastructure in very large cities/ wider catchment area;
4. Small city interchanges, that are interchanges with build infrastructure in small
cities/ wider catchment areas (i.e. smaller than 200.000 inhabitants);
A T 2.2
175. Intermodal areas, that are secondary interchanges with build infrastructure in
large cities and tertiary level in very large cities/ wider catchment area.
6. Connecting points, that are all interchanges without physical infrastructure.
Figure 8: Transport interchange types (Source: NODES project)
Creating an account for the NODES benchmark tool allows to benchmark the overall
performance and different aspects of and interchange(s) based on specific indicators.
A T 2.2
18Figure 9: Transport interchange assessment (readiness level diagram), Source: NODES project
Figure 10: Benchmark Gdańsk Wrzeszcz: CUSTOMER NEEDS (Source: NODES project)
A T 2.2
19Figure 11: Benchmark Gdańsk Wrzeszcz: INTERCHANGE OBJECTIVES (Source: NODES project)
References
https://benchmark.nodes-toolbox.eu/register/
Overall technical description
A T 2.2
20The NODES toolbox is a catalogue of integrated planning, design and management tools of
whose aim is to help to build modern urban interchanges. The tools in the toolbox will
allow each interchange manager to have an informed decision making, enabling an
integrated and balanced realisation process from the initial planning phase of an
interchange, up to the actual management of the station, surrounding area, and
information provision to the traveller and citizens in the catchments area. The tools can
be selected based on:
• type of transport interchange considered of use,
• the life cycle stage of the interchange,
• pursued performance objective of the interchange,
• type of stakeholder accessing the toolbox,
• type of tool searched.
The NODES toolbox linked with the benchmark tool will allow users to set targets for the
performance of their new and upgraded interchange, and therewith select the right tools
to reach those targets. The toolbox brings together 83 different tools all tested within the
project.
To allow the toolbox user to find the tool(s) that are best suited for his interchange(s) and
local-based situation, two functionalities have been added to the toolbox. Firstly, there is
a free search function. This allows finding the relevant tools based on any keyword chosen
by the toolbox users. In case the toolbox user has no specific search, user can search based
on a combination of characteristics of the interchange, life cycles stage and/or objectives
filter and access the tools that could be of specific interest for their interchange.
The following characteristics are integrated in the toolbox:
• interchange type,
• life cycle stage of the interchange,
• pursued performance objective,
• specific type of interchange stakeholder.
In the SOLEZ project, focus is about VA services as organizational measures (pull measures)
enabling to incentive and promote low-carbon mobility. Thereby supporting tools proposed
for the target FUAs and beyond are mostly dealing with “management” tools and
methodologies, enabling to offer low-carbon solutions strengthening and boosting public
transport as well as sustainable mobility.
1) Multimodal journey planner
A trip with multiple transport modes requires a coordination of these. The interchanges
are just the physical places of the change between modes. But in advance, the trips must
be planned. A multimodal journey planner, which can provide timetables, routing,
ticketing, reservation systems and other travel information, is a great addition. A
multimodal journey planner enables people to view the overall journey from a starting
point to their ultimate destination. A journey may use a sequence of several modes of
A T 2.2
21transport, meaning that the system must know about different public transport services
available (e.g. bus, tram, metro, train, car sharing, carpooling, bike sharing, etc.) and
about transportation networks (roads, footpaths, cycle routes) for private transportation
(automobile, walking, bicycle). To get a good use of the journey planner, different
involved parties have to participate. On the one hand, the will to bring the journey
planner into a running mode has to be present. Then, the necessary data must be provided
and kept up to date. At least the costs of the journey planner have to be split up between
involved modes. It is very important to cooperate with IT-experts if a multimodal journey
planner is supposed to be developed. Moreover, the availability of data is a crucial
question for interchanges’ managers to develop and improve their multimodal journey
planner with information about all mobility services present at the interchange.
Cooperation of the different interchange stakeholders providing their own data is
essential.
Expected potential interchange’s performance improvement
• improved quality of changes between traffic systems,
• faster travel speed due to reduced transition times,
• less waiting time due to optimized transition times.
References
http://www.econnect-germany.de/hubs/econnect-osnabruck/
http://www.hacon.de/hafas-en?set_language=en
http://www.vvs.de/rundum-mobil/
2) Smart ticketing system & transport integrated fares
Smart Ticketing Systems allow an improved, more efficient and integrated use of public
transport by travellers, while they enable transport operators to better collect a great
amount of data which may play an important role to develop and innovate ways of
management. Contactless card that allows:
• quicker, more comfortable accesses,
• different kinds of tickets charged electronically within a single physical card,
• good example of new possibilities is restitution of tickets in case of loss or theft,
• improve management, marketing and transport planning thanks to a new database.
In addition, integration of all transport services into one single ticket (valid for any
transport mode) is quite crucial for successful interchange management. This is crucial to
promote an easy-to-understand, attractive public transport system. Integrated fares make
the whole travelling experience simpler and easier, thus more attractive. They make
possible easier transfers, which is crucial to achieve a seamless trip experience. Travellers
A T 2.2
22can get tickets without knowing the distribution of their trips per modes, so they perceive
the system as more reasonable and attractive.
Expected potential interchange’s performance improvement
• quicker, more attractive and simple travel experience with impact on travel
demand,
• boosting system integration and inter-modality,
• It makes possible other good practices such as tickets-selling at one-point, multi-
modal spaces (waiting areas, etc.) or complementary facilities (park&ride, car
sharing, etc.).
References
http://www.tfl.gov.uk/fares-and-payments/oyster
http://www.navigo.fr/
http://www.tisseo.fr/les-tarifs/obtenir-une-carte-pastel
http://www.crtm.es/servlet/RedTransServlet?xh_ACCION=1&xh_TIPO=7
http://www.crtm.es/red_transportes/tarifas/red_tarifas.jsp?CODPANTALLA=1&CODBOTON
=203
http://www.londontravelpass.com/http://www.tfl.gov.uk/fares-and-payments/oyster
http://www.ratp.fr/fr/ratp/c_20585/titres-tarifs/
3) Business case for Park & Ride facilities
Business cases for different modes of passenger transport or funding streams have their
own set of circumstances and demands for detail which can make the underlying process of
decision making opaque. To ensure decision makers receive the right information on which
to draw their conclusions, all investment decisions are required to follow the same high-
level process. This allows for objective comparisons of proposals for investment within and
between projects and modes. The land owner investigates the most appropriate business
case, to operate Park and Ride (P&R) facilities near or at the interchange. The facilities
can be managed in several different ways:
1) Management by the transport authority; this can facilitate integration with other
modes (public transport, bicycle);
2) Management by a mixed public-private partnership;
3) Sub-contraction to a private entity.
A T 2.2
23P+R should intensify the use of public transport and minimize the traffic volume in the
inner city:
• No P+R terminals within the main circular road,
• P+R should be located as close as possible to the home of the user,
• Small and middle-sized P+R terminals (up to 300 – 400 spaces) for regional demand,
• big terminals at the city boundary for national demand.
Basis for the parking fees should be the distance to the city centre (the closer to the
centre, the higher). In this way, the environmental result of P+R is improved, because fees
lead users to switch earlier to public transport. Parking fees contribute to reduce
municipalities’ financial burden.
Expected potential interchange’s performance improvement
• increase the attractiveness of an passenger transport interchange,
• smooth connection with the public transport means served at the interchange,
• ensuring of safety and security both for users and vehicles.
References
http://www.ashford.gov.uk/park-and-ride-study
http://lara.inist.fr/bitstream/handle/2332/1678/CERTU-RE_10-07.pdf?sequence=1
https://www.gov.uk/government/uploads/system/uploads/attachment_data/file/85930/d
ft-transport-business-case.pdf
http://www.trm.dk/~/media/files/publication/2012/traengselskommission/konference-
den-1-oktober-2012/2-angelika-deisenrieder.pdf
4) Business case for the integration of bike-sharing and car-sharing services
The overall objective is to help landowner evaluation of the availability of bike-sharing
and car-sharing facilities at passenger transport interchange as well as potential for
contractual agreements with sharing mobility service provider. It supports the investigation
of the most appropriate business case to integrate bike and car-sharing services at the
transport interchange. Bike and car-sharing facilities can significantly increase the
available opportunities for transport at a passenger interchange. The drop–off
point location and the network coverage are crucial factors for the success and cost
efficiency of the scheme. The facilities can be managed in several different forms such as:
1) Management by the transport authority to facilitate this integration of public
transport with soft modes and alternative modes such as car sharing, carpooling,
etc;
2) Management by a mixed public-private partnership;
3) Sub-contraction to a private entity.
A T 2.2
24Car-sharing and bike-sharing services are mobility services intended for city dwellers.
While the bike share services target short duration and short distance travel, car-sharing
may respond to travel needs that go from 30 minutes to 48 hours, either covering short or
longer distances. These services are complementary to the public transport network. The
stations are located in public spaces, especially at interchanges or close to major tramway
or metro stations. Access to car-sharing requires prior registration. The bike-sharing
service can be used by anyone with a credit card.
To offer an increased number of modes of sustainable transport to users, local authorities
are contributing to the integration and financing of bike and car-sharing services through
contractual agreements between real estate owners and the service provider in the form
of subsidies by making real estate available or by taking part in the construction.
Concerning integration of bike-sharing services more specifically, the Transport
Organising Authority could sign an advertising contract requiring the service provider to
pay royalties for use of public space through an agreement for temporary occupation of
public space. In terms of time for implementation, one year should be counted as from the
government (advertising) contract being signed and one year of initial works (then the time
for the construction of new stations over the following months/years). Concerning
integration of car-sharing services, generally through the creation of a co-operative
society of members and subscribers, two years of studies need to be counted and one year
to implement the provision (then the time for construction of new stations over the
following months/years). Two types of bike and car-sharing services co-exist as follows:
• stationary service: pick-up and return bike/vehicle to the same parking space;
• free-floating service: pick-up bike/vehicle from parking space A and return it to
parking space B or pick-up and leave bike/vehicle everywhere based on GPS
tracking system.
Moreover, it should be noted that the electrical distribution operator is to be involved if
car-sharing service includes hybrid electrical vehicles or making charging stations available
for electric vehicles.
Key issues can be identified for local authorities when implementing public bicycle sharing
schemes including limitation of operating costs, reduction of exposure to risk of vandalism,
reduction of maintenance and control costs as well as proposal of an integrated transport
offer. Some conditions to be met for success are: i) A dense network of cycle stations, ii)
Fleet size of at least 150 bicycles; iii) efficient service and communication; iv) total cost of
service to include the number of journeys generated plus theft and vandalism risk.
Expected potential interchange’s performance improvement
The integration of bike and car-sharing services can increase the attractiveness of a
transport interchange by offering an increased number of transport modes (pull measures)
at the interchange.
A T 2.2
25If well managed and properly rated, the bike-sharing / car-sharing service will:
• increase customer fidelity to a combined mobility offer (tram + bus + bike + car
sharing etc.) information availability, pricing, ticketing and marketing,
• generate new trips with very low carbon footprint,
• complete the PT offer in time (24/7 service) and space (where the PT offer is low),
• attract new customers to combined mobility (students, young people, car drivers
switching to e-bikes etc.),
• increase the catchment area of stations.
References
http://mobilpunkt-bremen.de/index.php/english/
Toulouse car sharing scheme
Toulouse bike sharing scheme
5) Station Experience Monitor
The overall objective is to measure passenger station experience. Most interchanges are
having a functional design. The lack of considering the users’ travel and waiting
experiences is often obvious.
The Station Experience Monitor (SEM) is used in the Netherlands, UK and several
interchanges across Europe to measure passenger station experience. The experience at
the larger stations are measured every three months, the smaller ones, once a year.
At every station, passengers are selected randomly when waiting at the stations platforms.
To have a good overview of the experiences during peak and off-peak hours it is
recommended to have about 300 questionnaires filled in total per station. Besides larger
refurbishment and redesign of the interchanges, it was found that often very simple low-
cost interventions can already have a large impact on the waiting and travel experiences of
the interchange users.
The questions and weightings are based on a long experimenting of the tool over time. The
present instrument allows a correct analysis and appreciation of results.
The SEM is a valuable and helpful standard instrument for measuring, monitoring and
comparing customer experiences on a European level. The SEM was successfully applied at
12 different stations in 7 cities (Madrid, Rome, Budapest, Birmingham, Reading, Toulouse
and Thessaloniki).
Expected potential interchange’s performance improvement
A T 2.2
26The SEM helps to identify interchange performance in respect to customer experience. It
gives an in-depth insight in what the travel really wants. It allows the management to
steer interchange performance on what really matters, as to say the customers’
experiences and needs.
References
https://nodes-toolbox.eu/tools/customer-stakeholder-satisfaction-evaluation/
3.4 Mobility as a Service (MaaS) schemes
Introduction
Mobility as a Service (MaaS) is a mobility distribution model in which customer’s major
transportation needs are met thanks to one single integrated service provider combining
transportation infrastructures, travel information, payment services and more1. MaaS
provides a new way of thinking in terms of how the delivery and consumption of mobility is
organized and managed.
Why Mobility as a Service? MaaS will enable to reduce the use of private cars with direct
impacts in terms congestion and parking as well as to reduce emissions produced by
conventionally-fuelled vehicles (referring to vehicles using internal combustion engines -
ICE). Furthermore, MaaS will enable to highly reduce the need for 2nd private car as well
as to enhance first/last-mile accessibility.
MaaS is a new concept aiming to provide consumers with flexible, efficient, user-oriented
and ecological mobility services covering multiple modes of transport on a one-stop-shop
principle. MaaS could offer multimodal route planners and different services under one
fare and on the same ticket2.
MaaS is all about multimodal passenger transport, shared mobility, multimodal traveler
information, integrated booking/ticketing/payment, etc. MaaS is fed by scheduled public
transport services, public/private parking, private sharing mobility services, on-demand
public transport services, etc.
What is Mobility as a Service? Many varying definitions are available as follows:
1. The original definition stems from Sonja Heikkilä’s master thesis from 2014
in Helsinki:
“Mobility as a Service (MaaS) - a system, in which a comprehensive range of
mobility services are provided to customers by mobility operators.”
2. Working paper from the Swedish knowledge centre on public transport K2:
“Integrated mobility service” (IMS) to describe a service that not only
1 Source: M, FINGER (2015) ‘Mobility as a service: from the regulation of transport tot the regulation of transport as a service’, European
Transport Regulation Observer).
2 Source: http://www.vtt.fi/sites/maasifie
A T 2.2
27integrates a range of mobility services, both public and private, but also
provides one-stop access to all services through a common interface (hence
creating a seamless customer experience, i.e. the service).”
3. Article on transportation services: “Buying mobility services as packages
based on consumers’ needs instead of buying the means of transport. Via
‘Mobility as a Service’ systems consumers can buy mobility services that are
provided by the same or different operators by using just one platform and a
single payment.”
4. S. Hietanen, CEO of MaaS Global Oy (2014) describes MaaS as: “A mobility
distribution model in which a customer’s major transportation needs are met
over one interface and are offered by a service provider. … The central
element of Mobility-as-a-Service requires a mobility platform that offers
mobility services across modes”.
5. MaaS definition by MAASiFiE (2016) - “Multimodal and sustainable mobility
services addressing customers’ transport needs by integrating planning and
payment on a one-stop-shop principle”.
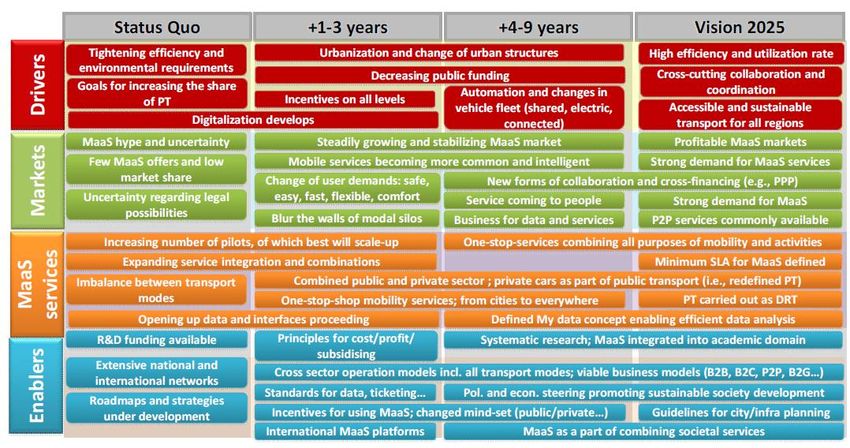
Figure 12: European MaaS Roadmap 2025
(Source:http://www.vtt.fi/sites/maasifie/PublishingImages/results/cedr_mobility_MAASiFiE_deliverable_2_revised_final.p
df)
MaaS comprises the following three main components that enable integrated mobility
services:
• shared mobility,
• booking/ticketing,
• multimodal traveller information.
A T 2.2
28Shared mobility is needed to intensify the transport system by reducing the number of
private cars commuting daily on the road network, and promoting alternative options like
carpooling, ridesharing or bike sharing as first/last-mile options. The aim is to reduce the
number of ‘second car’-households (or ideally even some ‘first car’-households) and enable
a seamless transition from individual to multimodal public transport without needing to
own a private car. ICT technology and especially the provision of smartphone or web-based
applications can facilitate an easier access to available, shared mobility resources and
services.
Booking/ticketing is also an integral part of MaaS. With more sophisticated ticketing, the
customer experience can better meet customer expectations, which can foster co-modality
and intermodality.
In this respect, ticketing could contribute to the overall improvement of the transport
network level of services and accessibility, with the main aim to facilitate and increase the
use of alternative transport and contribute to the overall sustainable transport goals.
Ticketing as a MaaS component especially requires integration with other MaaS service
components to be effective. Finally, individualized multimodal transport information
provided by integrated and multimodal traveller information services via web-based and
app-based solutions is a key factor for seamless door-to-door multimodal mobility. Some
services incorporate for instance: real-time information on public transport schedules,
routing information for different transport modes, including journey times, fares or even
information on sharing facilities.
A T 2.2
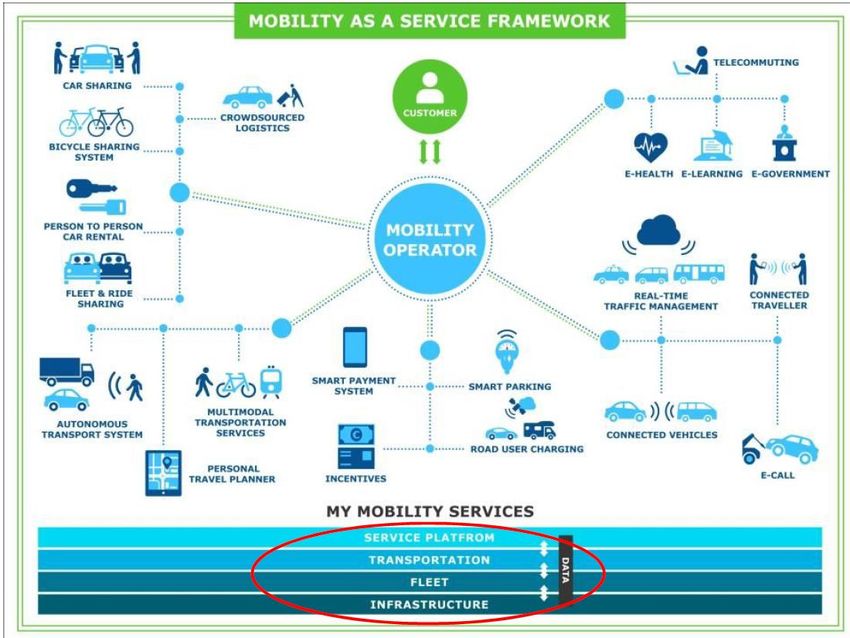
29Figure 13: MaaS framework (Source: The Ministry of Transport and Communications of Finland)
As the deployment of MaaS strongly relies on the provision of ICT technologies, the focus
within this document is on the related requirements. In this respect, already employed
technologies within MaaS and MaaS-related services have been identified and described for
effective design of MaaS.
A T 2.2
30Figure 14: The MaaS ecosystem. Source: Adapted from Movia notat 2016-08-18
Preliminary self-assessment (readiness level)
Before the design and implementation of this innovative ICT-based solution enabling to
offer MaaS at urban and peri-urban level, it is recommended to undertake a preliminary
self-assessment of its applicability and readiness in the target FUAs where the VA services
are planned be implemented.
The MaaS Readiness Level Indicators Framework was developed within the CIVITAS
ECCENTRIC project (2016-2020) where Madrid, Stockholm, Munich, Turku and Ruse are
working together to tackle the challenges of mobility in suburban districts and clean, silent
and CO2-free city logistics.
• MaaS readiness level indicators highlight the different aspects of MaaS
development that are identified to showcase the local authorities’ current situation
for establishing MaaS in the local context;
• Readiness level indicators are aimed as a starting point for local authorities;
• MaaS readiness level indicators give a cross-sectoral view on how prepared each
local authority is for the change and what sort of decisions it has already made
regarding transportation and how these supports the implementation of the new
transport services.
A T 2.2
31MaaS indicators consist of eight different components:
STRATEGIC READINESS
• Strategic readiness
Strategic focus
– Strategic focus
Parking policy
– Parking policies
• Internal use INTERNAL USE
– Travelling guidelines Travelling guidelines for the staff
– Use of shared mobility and politicians
• Shared use Use of shared mobility within local
– Shared economy administration
– Public transport SHARED USE
• Shared understanding Shared economy – availability and
– Integration platform market penetration of shared and
– Visibility combined travel options
Public transport (PT)
SHARED UNDERSTANDING
Integration Platform
Visibility – how obvious and easy to
get are the shared mobility offers to
the citizens
Figure 15: MaaS readiness level diagram (Source: CIVITAS ECCENTRIC)
A T 2.2
32• Strategic readiness
– Strategic focus
1. The local authority has no measure taken to explicitly support
MaaS development in the city
2. The local authority is involved in measures to support the
development of mobility services together with the service-
providers and/or incentives are used for creating the Maas
3. The local authority has a plan/strategy/policies to explicitly
support the development of MaaS in the local context
4. The local authority has local funding to support the change
(project or continuous funding)
5. The local authority has a named person to be in charge of MaaS
development. The local authority develops MaaS systematically
– Parking policies
1. The local authority does not have a parking policy
2. The local authority has a parking policy, but it does not
explicitly support the shared use of vehicles and/or transport on
demand
3. Politicians are ready to change parking policy on critical areas in
the local authority or they are ready to take measures to reduce
private motoring/ car ownership
4. The local authority is active in supporting new business models
by adapting parking standards for (new) residential
developments (reducing the area of parking space, allocating
parking spaces for shared cars/transport on demand and
enabling new mobility services for residents)
5. The parking policy supports shared cars by offering
priorities/cheaper parking/parking zones for shared vehicles and
parking permits are easy to acquire
• Internal use
– Travelling guidelines for the staff and politicians
1. Internal travelling guidelines for staff and politicians of the local
authority do not prioritize sustainable mobility
2. Internal travelling guidelines prioritize sustainable mobility, but
are not monitored by the local authority
3. Internal travelling guidelines prioritize sustainable mobility and
travel patterns are monitored and reported annually by the local
authority
4. Internal travel instructions prioritize the sustainable mobility,
travel patterns are monitored annually by the local authority
and there is a clear plan to reduce the use of private cars on
work travel and to promote the use of shared mobility
5. Internal travelling instructions prioritize sustainable mobility,
travel patterns are monitored annually, the use of private cars
on work travel has declined during the past 3 years
A T 2.2
33You can also read