Monaghan Children and Young People's Services Committee - Children and Young People's Plan 2019- 2021
←
→
Page content transcription
If your browser does not render page correctly, please read the page content below
Monaghan
Children and Young People’s
Services Committee

Children and Young People’s Plan
2019- 2021
                                   0|Page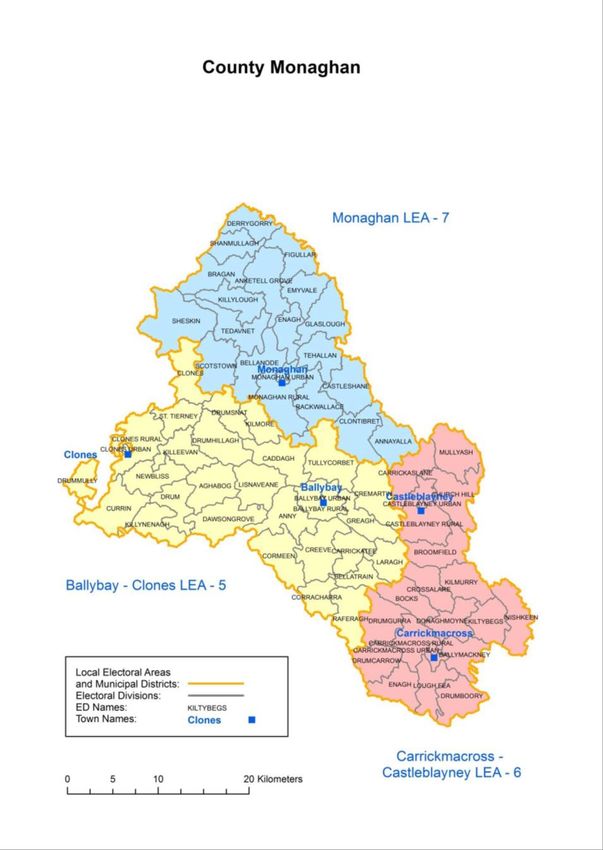
Contents
Foreword ................................................................................................................................................................ 3

Section 1: Introduction ........................................................................................................................................... 4
Background to Children and Young People’s Services Committees ....................................................................... 7
Who we are ............................................................................................................................................................ 8
Achievements to date / Review of previous plan ................................................................................................. 10
How the Children and Young People’s Plan was developed................................................................................. 10

Section 2: Socio-Demographic Profile of Monaghan .......................................................................................... 12

Section 3: Overview of Services to Children and Families in Monaghan .............................................................. 34

Section 4: Local Needs Analysis in Monaghan…………………………………………………………………………………………………..44

Section 5: Summary of Children and Young People’s Plan for Monaghan ........................................................... 55

Section 6: Action Plan for Monaghan Children and Young People's Services Committee……………………….............56.

Section 7: Monitoring and Review ........................................................................................................................ 69

Section 8 : Appendices………………………………………………………………………………………………………………………………………70

                                                                                                                                                                         1|Page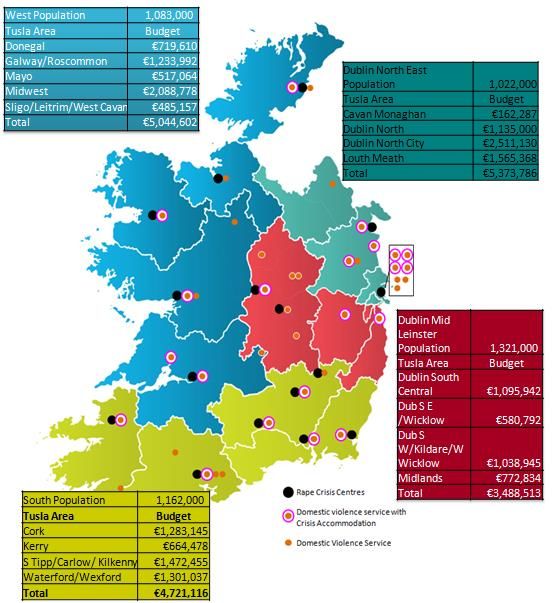
Contact
The Monaghan Children and Young People’s Services Committee welcomes comments, views and opinions
about our Children and Young People’s Plan.

Please contact:
Collette Deeney, Monaghan CYPSC Coordinator
Tusla, the Child and Family Agency
1st Floor, St. Davnet’s Campus
Rooskey, Monaghan town, Co. Monaghan
T: +353 47 30473 | M: +353 873494714
E: collette.deeney@tusla.ie

Copies of this plan are available on: www.cypsc.ie/your-county-cypsc/monaghan.2016.html

                                                                                          2|Page
Foreword
As Chairperson of the Monaghan Children and Young People’s Services Committee (CYPSC) it is with a great
sense of achievement to arrive at the publication of our first Children and Young People’s Plan for the county
The aim of the plan is to prioritise actions over the coming three years which will foster continuous
collaboration between agencies on a range of actions aimed at improving outcomes for children and young
people.

The process of developing the plan has led to a greater understanding of how we can work together on joint
initiatives resulting in a shared understanding of the need for services to change in order to meet the complex
needs of families and communities.

Regular committee meetings and lively discussions have strengthened relationships between key stakeholders
across many sectors.
We continue to plan, and do in our daily roles, but the Children and Young People’s Services Committee has
allowed us the space to reflect on what we are doing, and analyse where we need to target interventions, and
why. We continue to learn from each other and I would like to thank the CYPSC Committee and CYPSC
subgroup members past and present for their insight, time, and dedication to progressing this plan and actions
to date.

“Real change and transformation takes place when the human dimensions of the change process are well
managed in tandem with a meaningful and realistic plan. “
(Kotter,1995)1

A.W.
Interim Area Manager - Tusla Cavan and Monaghan
Chair, Monaghan Children and Young People’s Services Committee

June 7th 2019

With thanks to G.L. as Area Manager 2018

1
    Kotter, J.P., 1995.Leading Change. Massachusetts Harvard Business Review

                                                                                                   3|Page
Section 1: Introduction
   The purpose of the Children and Young People’s Services Committees (CYPSC) is to secure better outcomes for
   children and young people through more effective co-operation and collaboration by existing services and
   through interventions at local level.

   CYPSC work towards the five national outcomes for children and young people in Ireland.

   These outcomes are that children and young people:

1. Are active and healthy, with positive physical and mental wellbeing

2. Are achieving full potential in all areas of learning and development

3. Are safe and protected from harm

4. Have economic security and opportunity

5. Are connected, respected and contributing to their world

                                                                   2
   Figure 1 Better Outcomes Brighter Futures National indicators

   An indicator set was developed nationally to compile statistics around each subgroup so that individual CYPSC
   would have a baseline in relation to the five outcomes for children. This can be used as a measurement of
   where children and young people are nationally and compare this to statistics and trends within their own
   counties

   2
       An Indicator Set for : Better Outcomes Brighter Futures Dept of Children and Youth Affairs, (2014-2020)

                                                                                                                 4|Page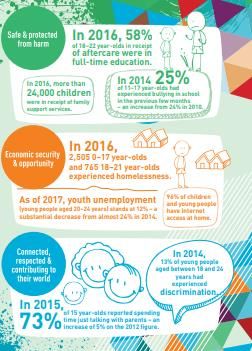
Background to Children and Young People’s Services Committees
Children and Young People’s Services Committees in Ireland
The Office of the Minister for Children and Youth Affairs (OMCYA), now the Department of Children and Youth
Affairs, established the Children and Young People’s Services Committees (formerly Children’s Services
Committees) in 2007 with the purpose of improving outcomes for children and families at local and
community level. Since then CYPSC have increased incrementally in number and are a key structure identified
by Government to plan and co-ordinate services for children and young people, aged 0 – 24 years, in every
county in Ireland.
CYPSC bring a diverse group of agencies across the statutory, community and voluntary sectors in local county
areas together to engage in joint planning of services for children and young people. All major organisations
and agencies working locally on behalf of children and young people are represented. These committees work
to improve the lives of children, young people and families at local and community level through collaborative
planning and improved service delivery.
Better Outcomes, Brighter Futures: the National Policy Framework for Children and Young People 2014 – 2020
3
underscores the necessity of interagency working and tasks Children and Young People’s Services Committees
with a key role in this regard.
Children and Young People’s Services Committee in Monaghan
Monaghan CYPSC started in 2013 as a joint Monaghan/Cavan CYPSC. The meetings became more regular in
2014 with planning days organised between each county. The Committee agreed that they had an advocacy
role and that in certain situations this advocacy role would be strengthened by working regionally or indeed
nationally with other Children Services’ Committees. With the support of a Tusla staff member acting as a
coordinator and an outside facilitator certain actions were identified and the following subgroups were
formed in late 2014
Child Services Committee Development Group
Prevention, Partnership & Family Support / Early Intervention (including Parenting, Education and Community
Development).
Improved co-ordination for Vulnerable Youth
Further developments in 2016 led to a dedicated CYPSC Coordinator appointed and a needs analysis was
conducted in both counties as part of the development of a plan. Many of the statutory services and voluntary
bodies, for example, Tusla, the Child and Family Agency, and Cavan Monaghan Educational and Training board,
Youth Work Ireland Foróige work across both counties and so it seemed appropriate that a joint approach to
CYPSC planning would be appropriate. It soon became apparent over the course of the analysis that there
were different needs and priorities emerging for each county and so a decision was made to separate as
individual CYPSC in early 2017 resulting in an individual CYPSC being set up for Cavan and Monaghan. For
example there was no support in Cavan for young members of the LGBTI community and so this was identified
as a high priority for Cavan. In Monaghan there were some support groups in existence and other issues such
as promoting resilience in young people and looking at the needs of young people not in education
3
Department of Children and Youth Affairs.(2014-2020) Better Outcomes Brighter Futures : Stationary House.
Dublin
5|Page
employment or training (NEETS) took precedence. Cross county CYPSC Meetings would also be protracted and
involve a wide membership if held jointly as not every agency has a dual role across both counties.
While some of the data is collected in the Cavan Monaghan region in a combined cross county format every
effort has been taken to present findings and statistics solely for Monaghan in as far as is possible.
While the work of developing a plan was underway, the CYPSC identified a number of key priorities for
development in 2017 and interagency sub-groups were formed to develop actions in a number of areas:
1. Physical and Mental Well-being subgroup (formed 2018)
2. Building Resilience aligned to Learning and Development (2019)
3. Safe and Secure
4. NEETs (Not in Education, Employment or Training)
It is the intention of the Monaghan CYPSC that during 2019 existing sub-groups will be aligned and new groups
formed to action goals from the 5 National Outcomes identified in the Better Outcomes, Brighter Futures: The
National Policy Framework for Children and Young People 2014-2020:
Outcome 1: Active and Healthy; Physical and Mental Well-being
Outcome 2: Achieving in all Areas of Learning & Development
Outcome 3: Safe & Protected from Harm
Outcome 4: Economic Security and Opportunity
Outcome 5: Connected, Respected and Contributing to their World
Goal 1: Parenting Support in Co. Monaghan
Goal 2:Cultivating collaboration between agencies
Goal 3:supporting
The CYPSC Co-ordinator has also been involved in helping support the work of a number of other interagency
forums and initiatives in the county.
These include:
Assisting the development and implementation of a community response to suicide protocol and supporting
the Connecting for Life Strategy
Member of the Monaghan Drugs & Alcohol Forum
Member of the Monaghan Youth Network
Member of working group organising events and seminars for public awareness week in Cavan and Monaghan
Member of Parenting Monaghan Committee
Member of the Monaghan County Childcare (MCCC) board
Member of the National Childhood Network’s steering group for the new Life Start: The Growing Child
Initiative
Member of the Healthy Monaghan Wellbeing committee
Member of the Joint Policing and Safe Socialising Committee
6|Page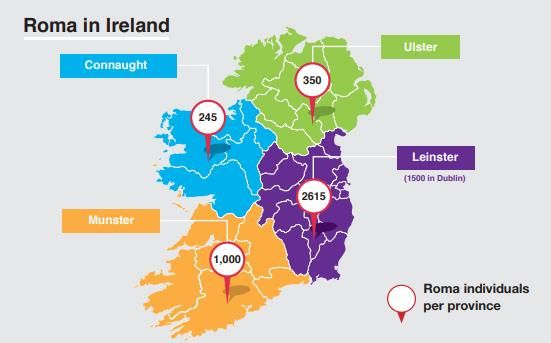
1.2.1
Monaghan CYPSC would like to thank the following past members for their input and support in the
development of this plan; Tom Cahill, Sharon Casey and Marty Keeney who were the preceding CYPSC
Coordinators and Gerry Lowry former Area manager for Cavan and Monaghan who all contributed greatly to
the development of the current CYPSC committee, and this plan. Thank you to Paula Long; National
Educational Psychological Service, and Ruth Daly, who conducted the needs analysis, and drafted a large part
of this 3 year plan.

                                                                                                 7|Page
Who we are
The Monaghan CYPSC comprises the following members:

ORGANISATION                                               REPRESENTATIVE

CHAIR: Tusla, the Child and Family Agency                  Aidan Waterstone Interim Area manager
DEPUTY CHAIR: Monaghan County Council                      Fintan McPhillips
Irish Primary Principal’s Network                          Bernie Farrell
National Association of Principals and Deputy Principals   Patrick McArdle
Department of Social Protection                            Pat Dolan
Foroige                                                    Colin McAree

An Garda Siochana                                          Sgt Valerie Gahan
Health Service Executive                                   Cathal Hand
Irish Society for the protection of Cruelty to Children    Charlene Duff
Monaghan Institute                                         Dr. Fiona McGrath
Probation Service                                          Clive Stone
Monaghan County Childcare Committee                        Breda McKenna
Monaghan Integrated                                        Ger Callan
Family Resource Centre                                     Packie Kelly
National Educational Psychological Services                Dr. Irene Loughran
16. Young Person (18-24)                                   Erin Lynagh
17.Cavan & Monaghan Educational and Training Board         Maureen McIntyre
Youth Work Ireland Cavan Monaghan                          Caolan Faux
Tusla Prevention Partnership and Family Support            Cathal Grant
North East Drugs & Alcohol Forum                           Lisa Gavillet/ Andy Ogle
National Childhood Network                                 Maureen Mc Dermott/Denise Mc Cormilla
Health Service Executive                                   Angela Mc Elroy
Health Service Executive                                   Margaret Rafferty
Monaghan Education Centre                                  David Mc Cague
Comhairle Na nÓg Representative                            Katie Boyle
Comhairle Na nÓg Representative                            Nadine O’Reilly
Table 1 Membership of Monaghan CYPSC 2019

                                                                                             8|Page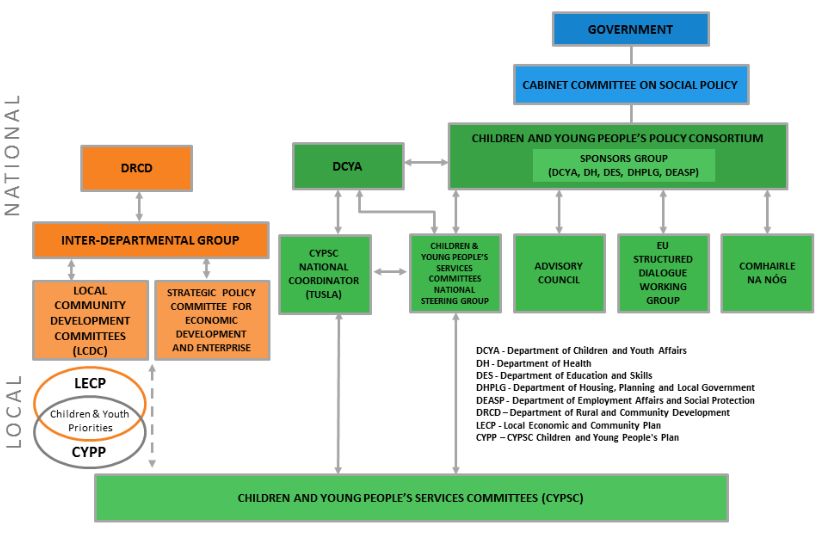
The following diagram illustrates how Monaghan CYPSC fits within the local and national structures of
government

Figure 2. Governance Structures and CYPSC

                                                                                                   9|Page
Achievements to date
The initial areas of work Monaghan CYPSC has been engaged in include:
Working with National Childhood Network and a number of pre-school services in the county to implement
the “Tuning into children” project so as to better hear the voice of pre-school children during the CYPSC
consultations.
Focusing on children and young people’s safety through the creation of a Safe and Secure Sub Group
Development of strategic vision on supports for young people aged 16-24 who are identified as NEET (Not in
Education Employment or Training) at county wide level
Supporting the strategic plan of the Parenting Monaghan committee
Through the creation of a safe socialising committee new safety measures are in place for young people and a
“discussing the disco” leaflet has been devised for parents, and there has been a reduction in the number of
under 18s presenting at discos under the influence of alcohol
Supporting the publication of a youth led booklet the A-Z of LGBT+
The launch of a building resilience animated video resource for primary schools
Conducting a needs analysis of the County and a comprehensive mapping of services and activities for young
people
Cultivating Collaboration event which brought all subgroups and CYPSC members together to develop a shared
understanding of collaboration and interagency working.
The development of a www.cavanmonaghanservices.ie website to list a range of supports and services in both
counties.
There have been challenges in extrapolating information for Monaghan alone as many services are jointly
managed on a Cavan /Monaghan basis and it as seen as one delivery area in terms of gathering statistics. In
terms of finalising the Children and Young People’s Plan (CYPP) it has been at times challenging to finalise two
plans, whilst coordinating two separate CYPSC, and sets of subgroups, but in April 2019 a Cavan CYPSC
coordinator was appointed. Following publication of the Cavan and Monaghan CYPPs each coordinator will be
able to focus on their respective newly developed Children and Young People’s Plan.
1.4 How the Children and Young People’s Plan was developed
This Monaghan CYPSC Plan has been developed over the period of Jan 2016- April 2019. The preceding CYPSC
co-ordinator engaged the services of an external consultant to aid the process of gathering data - both primary
and secondary for the plan, collating and analysing the data and writing up the outline plan.
This work included:
Review of the draft plan collated by the CYPSC in its pilot CYPP phase in 2014-15.
A review of pertinent reports and strategies related to the county and related to youth in general;
Analysis of the new Census 2016 data
Review of previous consultations with youth undertaken in the county in the past 3 years
A review of minutes from CYPSC sub-group meetings
Consultations with pre-school, primary and second level children and young people
Consultations with key Stakeholders from the county were held
A Parents on-line survey was conducted
Consultations with niche target groups including disability and young people from the LGBTII+ community
An audit of services in Co. Monaghan was carried out and a facilitator was engaged in 2016 to initiate the
process of developing objectives and actions for the plan. Over the course of 2018-19 the plan has been
revised and amended with suggestions and input from the National Quality Review Group and the ever
evolving need to respond to issues emerging on the ground
10 | P a g eSECTION 2: PROFILE OF CO. MONAGHAN
2.1 Socio-demographic profile of Co. Monaghan
Map 1. Co Monaghan Municipal Districts; Courtesy of Monaghan County Council.
11 | P a g eMap 2: Border Region depicting Monaghan’s boundaries with Northern Ireland
Co Monaghan is situated in the province of Ulster and borders Fermanagh to the west, Armagh to the south
and Tyrone to the north. In addition, Co. Louth borders Monaghan to the southeast, Meath to the south, and
Cavan to the southwest. Monaghan’s population based on the 2016 Census is 61,386. This represents an
increase of 903 people or 1.5 % since the 2011 population of 60,483. The border came into existence in 1922.
This ‘line’ was established as interim solution to ‘the Irish problem’, intended by London as provisional
demarcation for the partition of the island (under the Government of Ireland Act, 1920). Almost 100 years
later many informal reciprocal arrangements with trading; health care and business have grown and as
reported on the Joint Oireachtas Committee on the Implementation of the Good Friday Agreement there are
up to 30,000 crossing all along the border region on a daily basis.3
With the decision of the United Kingdom to leave the European Union in 2018 now referred to as (Brexit)
there is much uncertainty on how this will impact on areas such as:
Free trade and movement across the border
Availability of health care as many people from Co. Armagh use Castleblayney, Co. Monaghan as their nearest
town for GP and out of hours services.
Delays on the borders to get to appointments etc.
Cross border response to road traffic accidents
Uncertainty of cross border initiatives for example the partnership of the Cooperation and Working Together
(CAWT) partnership which is supported through E.U. Interreg funding to tackle health inequalities around the
border hinterland.
One such development through CAWT is the Ear/Nose/Throat (ENT) programme in Cavan, Monaghan and
Fermanagh which operates with the cross-border co-operation, providing services to patients on both sides.
Counties Cavan and Monaghan are part of the Community Healthcare Organisation 1 area (CHO1) and there
are many similarities between population and rural isolation between the two counties. All babies are now
born in Cavan General Hospital since the maternity ward closed in Monaghan hospital in 2001 which is
approximately one hour away from the North Monaghan region. The Central statistical office provides a
snapshot below of some of the general information on Monaghan town and its environs.
12 | P a g eFigure 3 Snapshot of small area population statistics in Monaghan by the Central Statistics Office.
2.1.1 Population
According to the latest Census 2016 figures, the population of Co. Monaghan has reached 61,386, a very small
increase of 1.5% (903) on 2011. Less than one third (29.3%), of the county’s population lives in towns with a
population of more than 1,500 people. This has resulted in a very high rural dispersion of the remaining two
thirds of the population. This has significant implications for the delivery of all types of services across the
county.
In relation to the proportion of children and young people in the county, there are a total of 20,062 (34.1% of
the total population) children and young people under the age of 24, marginally higher than the state level of
33.2%, as illustrated in the table below:
Age group Number % of county State
population
0-5 years 5,640 9.2% 7.2%
6-12 years 6,628 10.8% 10.0%
13-17 years 3,408 5.6% 6.5%
18-24 years 4,386 7.1% 8.2%
TOTAL 20,062 34.1% 33.2%
4
Table 2 Population of Children and Young People in Community Health Organisation CHO Area 1 (2016 )
According to the Community Healthcare Healthy Ireland Implementation plan the highest proportion of 0-
4year olds reside in Monaghan with 7.6% of the population under 4 against the national figure of 7%.
4
SOURCE: Central Statistics Office (CSO), 2016 Population Census – Small Area Population Statistics at
https://www.cso.ie/en/census/census2016reports/census2016smallareapopulationstatistics/
13 | P a g eThe birth rate in Co. Monaghan at 13.6 per 1,000 is in Number Rate per State
line with the State figure of 13.7 per 1,000. Monaghan 1000
2016
Births registered 796 13.6% 13.7%
Infant (children under 1 year) mortality 1 1.3% 3.3%
Neonatal (infants under 28 days) mortality 1 1.3% 2.4%
Table 3 Information on birth rate and Infant mortality statistics for Monaghan; Source (CSO 2016)
The figures above are from the 2106 Census however in 2017 the infant mortality rate in Monaghan was the
highest in the country (6.2 /1,000 vs 2.8/1,000 nationally. This has reduced to 5.3/1,000 compared to 3.5/1000
for the state in 2018. Further anlysis will be carried out to understand the high rate in 2017 and to monitor the
figures on an annual basis with a view to further reducing the infant mortality rate in Monghan.
Co. Monaghan is made up of 70 electoral districts (EDs) of which 25 experienced a decrease in population,
while 43 EDs illustrated a slight population increase. The town which has experienced the biggest population
increase over the past 10 years is Carrickmacross, which has increased by 26.6% .The reason for the increase is
that the town is situated 90-100 km from Dublin and is considered to be commutable distance to Dublin for
people working there who could not afford to purchase property in Dublin and its immediate environs.
Ballybay on the other hand a more rural town has seen a decline of 28.9% of population.
Electoral Districts of main Co. Monaghan % change of population 2006-2016
towns
Carrickmacross Rural +26.6%
Monaghan Urban +11.6%
Ballybay Rural +11.2%
Monaghan Rural +10.0%
Clones Rural +7.3%
Carrickmacross Urban +5.7%
Castleblayney Urban -4.0%
Castleblayney Rural -7.15%
Clones Urban -7.2%
Ballybay Urban -28.9%
Table 4 Monaghan Electoral districts; Source: Census 2016
2.1.2 Families
Just over half of the population of adults (51.5%) are categorised as single, with almost a further 40% married.
A total of 8.9% are separated, divorced or widowed.
There are 15,972 families in Co. Monaghan of which 73% (11,698) are families with children.
Family description Number % of county population
No children 4,274 26.9%
1 child 4,408 27.6%
2 children 3,873 24.2%
3 children 2,256 14.1%
4 children 851 5.3%
5+ children 310 1.9%
TOTAL 15,972 100%
Table 5 Number of children in Families; Source CSO 2016
A total of 14.4% (2,298) are families headed by a single mother, and a further 2.9% (458) are headed by a
single father, that’s a total of 17.3% single parent households compared to 18.0% for the State.
14 | P a g e2.1.3 Nationality
In the Census 2016, a total of 12.2% of the population of Co. Monaghan indicated that they are of a nationality
other than Irish, which is fairly close to the State average of 13.0%. However, looking at this data for individual
EDs presents a very different picture. A total of 11 EDs have a higher than State average of newcomer families
with 13.0% of residents from other countries living there, which suggests that 40.1% of the total population of
Co. Monaghan is living in areas with an above average diversity of population. The table below illustrates the
EDs in Monaghan which demonstrate the highest proportion of residents who are originally from another
country.
ED name % of people from ethnic
minorities
Monaghan Urban 45.7%
Castleblayney 27.8%
Clones Urban 26.2%
Carrickmacross Urban 24.7%
Monaghan Rural 22.9%
Proportion of the population living in EDs with higher than 40.1%
the national average number of people from ethnic (11 EDs)
minorities.
Co. Monaghan 12.2%
Ireland 13.0%
Table 6: Towns with higher than average numbers of residents from other countries; Source CSO 2016
The largest numbers of newcomer families come from Lithuania (2,500 people), other EU 27 (1,455), the UK
(995) and Poland (982). Co. Monaghan town features in the top ten towns in Ireland which have the highest
proportion of people from ethnic minorities and coming in at fifth place.
Town County Number % of Number The largest
of non-Irish of non-Irish
residents nationals non-Irish group (number)
nationals
1. Ballyhaunis Mayo 2,383 39.5 941 Polish - 159
2. Edgeworthstown Longford 2,062 32.3 667 Polish - 163
3. Ballymahon Longford 1,866 32.1 599 Polish - 273
4. Ballyjamesduff Cavan 2,689 30.2 812 Polish - 311
5. Monaghan Town Monaghan 7,597 30.1 2,287 Lithuanian - 1,004
6. Saggart Dublin 3,145 28.9 909 Polish - 326
7. Longford Longford 10,011 27.4 2,740 Polish - 1,004
8. Cahir Tipperary 3,590 27.3 979 Polish - 340
9. Gort Galway 2,951 26.6 785 Brazilian - 397
10. Cavan Town Cavan 10,656 26.2 2,790 Polish - 827
Table 7: Towns with higher proportions of people from ethnic minorities: Source Census 2016
Many of the Lithuanian and Polish families came during the mid-90s during the last boom and have settled in
Monaghan. A positive development for Monaghan is that the Lithuanian language is now being piloted in
Dublin and some Monaghan post primary schools as a short junior certificate subject from September 2018.
15 | P a g eAnother positive Initiative for Monaghan has been the development of the cultural champions which are a
team of people from 12 different countries who volunteer to support people from their own culture within
their community. The Cultural champions have received funding from the Quality Capacity and Building
initiative (QCBI) and TUSLA the Child and Family Agency, and are supported through Monaghan Integrated
Development Limited (MID). The cultural champions received free Child protection training, Parents Plus
training (from Parenting Monaghan) and are currently completing Advocacy training. Following completion of
training the Cultural Champions will volunteer to support families from their own ethnic background.
21.4 Direct Provision Centre
St. Patricks Accommodation Centre is a direct provision centre for persons seeking asylum and refugee status.
The centre located on the outskirts of Monaghan Town and can provide accommodation for up to 175
residents. In May 2019, the centre housed 186 residents including 67 children and young people under the age
of 18. This number of children and young people has increased by 15 over the past year with the largest age
group of 19 children aged 0-3 years.
Age Category of children & young Number % of total
people at St. Patricks Centre
0- 3 yrs. old 19 28.36%
4-5 yrs. old 7 10.45%
6-8 yrs. old 16 23.88%
9-12 yrs. old 10 14.93%
13-15 yrs. old 12 17.91%
17 years. old 3 4.48%
TOTAL 67 100%
Table 8: Age breakdown of children residing in the direct provision centre in Monaghan
A bus is provided by the centre to bus preschool and school age children to school each day however transport
in an issue as there is no service after 5pm which can exclude a lot of young people from afterschool activities
in the town. Efforts have been made to involve some the children and young people in some of the Healthy
Ireland Physical Families programmes within the community, and the outcome one group is actively working
on ideas to engage some of the families. It is envisioned that one or two young people from the centre will sit
on the CYPSC Outcome 5 subgroup and this connection will help promote greater collaboration between the
direct provision centre residents and CYPSC.
Syrian refugee resettlement programme
In addition to the above groups of diverse cultures County Monaghan was one of 18 counties to be designated
as a resettlement county in 2018 for 20 Syrian families (totalling approximately 90 persons). Monaghan County
Council established an Inter-Agency Working Group, where representatives of the local mainstream service
providers including the HSE, Cavan/Monaghan Education & Training Board, Department of Social Protection,
Tusla, An Garda Síochána, Citizens Information, County Childcare Committee and Monaghan Integrated
Development (MID)came together to plan for and ensure that required services are available. Funding was
also secured from the Dept. of Justice for a resettlement worker who has been liaising with the families. In
addition other strategies have been made to support newcomer families; Failte Isteach is a local community
project supported through (MID) run in each of the 5 main towns which supports the conversational English
skills of migrant workers and newcomer families in the community through weekly conversation classes.
16 | P a g eParticipants are paired with tutors who are volunteers from the local community and learn conversational
English over the academic year.
2.1.4 The Travelling Community
According to the Census of 2016, 276 individuals identified as being part of the traveller community, which
equates to 0.45% of the Co. Monaghan population. However, data collected from another source in 2016, the
Department of Housing indicated that there are 157 families’ resident in the county, which suggests that the
Census count might be under-representing the traveller population in Monaghan.
Number of traveller families in all categories of accommodation in Monaghan
Accommodated by or with Local Authority Census 125
On unauthorised sites 0
Own resources 6
Private rented accommodation 22
Shared housing 4
Total 157
Table 9: Number of traveller families in all categories of accommodation in Monaghan (Source: Department of Housing
2016)
The age breakdown of Travellers in Co. Monaghan suggests that 55.4% are under the age of 25 yrs, compared
with 34.1% for the county as a whole.
Age and marital status Traveller General
Community Population
Proportion of those under 15yrs 39.7% 21.4%
Proportion of traveller children & young people in 55.4% 34.1%
the county under the age of 25 yrs
Proportion of women who have given birth to 5 or 1 in 2 1 in 24
more children 44.5% 4.2%
Proportion of those in the 15-29yr age bracket that 31.9% 5.8%
are married
Table 10 Age and marital status of Traveller population (Source: Census 2016)
The local housing authority is actively working with a Traveller group to provide a refurbishment to a halting
site on the outskirts of Monaghan town at Gortakeegan. The Partnership Prevention and Family support team
(PPFS) Tusla has been working with Monaghan Integrated Development Ltd. and local schools to provide a
breakfast club and an afterschool and homework activities onsite for school age children.
There are plans to create a new Traveller interagency group to look at the particular needs of Travellers in
Monaghan and the CYPSC committee hopes to engage young Traveller people in this group as at 55.4% of the
Traveller population in the County they have been an underrepresented voice to date within the Monaghan
CYPSC subgroups.
17 | P a g eThe Roma Community
Map 3 Mapping of Roma community in Ireland5
Roma families were identified in every county in Ireland. The largest communities of Roma are estimated to be
in Dublin, Louth, Kildare, Wexford, Cork, Kerry, Clare and Donegal
In Carrickmacross in Monaghan there are 30 families with up to 90 people living in the community from
Romania. It is hard to put an exact figure on Roma in Ireland as quite often families move around as is the
nature of their nomadic culture. Carrickmacross is 95 kilometers away from Dublin and so is a manageable
commute for people who are working in Dublin and want to live outside the city. Many of the Roma
community are seasonal workers and work on onion farms close to Dublin in Lusk. The influx of new families
has put pressure on services locally which already has a lack of housing and GP services. In local schools there
is also a shortage of spaces in primary school and a group from the Carrickmacross Child and Family Support
Network are actively working to resolve some of these issues for the Roma community, by meeting and
starting to build trust with the community. An Empower project from MID also employs a worker from the
Roma community to support the Roma participants into training opportunities and work.
2.1.5 Education
There are 59 Early Years Services in Co. Monaghan offering full day, sessional or part-time services for pre-
schoolers with 3,449 children in pre-school attendance in 62016-2017.
In the academic year2018/19, there are total of 7,882 children attending 62 primary schools in the county.
There is one special educational needs school The Holy Family School based in Cootehill Co. Cavan and serves
the needs of children with special educational needs from Monaghan also. There are also five autism units
within the county which are attached to mainstream schools. One school has a supported education classroom
for children with mild and moderate global learning delay. In Monaghan town there is a classroom within a
primary boys school which provides early Intervention for children with language delays.
In relation to second level school, for the same period there are 5,393 young people attending 12 secondary
and vocational schools . Between primary (10) and second level (4) there are a total of 14 DEIS schools in the
county.
5
Roma in Ireland A National needs assessment 2018 Pavve Point
6
Early Years Sector Profile 2016-2017, Pobal
18 | P a g eSchool attendance at Primary school level was better in Monaghan than in the State as a whole in 2016, and in
general this was the case in more rural areas compared to urban settings. Expulsion and suspension levels at
Primary level were very low in general and lower in Monaghan than in the State.
At second level school, there were a higher percentage of student days lost in Co. Monaghan (8.8%) than in
the State (8.0%). Again, the urban/rural trend was apparent and there was a noticeable increase in absence by
children in areas of greater disadvantage attending (Delivering Equality of Opportunity in Schools (DEIS)
schools as compared to non-DEIS schools. Suspensions and expulsion rates were higher at second level than at
primary both on a county and State basis.
Attendance Figures 2014/2015 Average % Average % Average % Average %
of student of 20-day expulsions suspensions
days lost absences
Primary School
Monaghan 4.3 6.1 0.0 0.06
State 5.5 10.4 0.01 0.38
Post-primary School
Monaghan 8.8 15.3 0.01 4.02
State 8.0 17.3 0.5 5.30
Table 11 Attendance figures 2014/15 (Source: Department of Education and Skills 2016)
A 2016 report from the Department of Education and Skills, presented an analysis of the cohort of pupils who
entered the secondary school system in 2010 and left in either 2015 or 2016. The research tracked the pupils
from their entry point to Junior Cert and on to Leaving Cert. The resulting national retention rates are
illustrated in the table below:
2010 Entry cohort Males Females Total
Retention to Leaving Cert by gender 89.7% 92.7% 91.2%
School sector Voluntary C&C Vocational
Retention to Leaving Cert by school 92.7% 90.6% 88.3%
type
School Designation DEIS Non-DEIS Total
Retention to Junior Cert by school 95.79% 97.75% 97.36%
type
Retention to Leaving Cert by school 84.41% 92.9% 91.21%
type
Number of 2nd level schools by 2 9 11
designation in Co. Monaghan
2010 Entry Cohort Monaghan State
Retention to Junior Cert 97.30% 97.35%
Retention to Leaving Cert 92.25% 91.2%
Table 12: 2010 Entry Cohort (Source: Department of Education and Skills 2016)
This data suggests that in Co. Monaghan there are almost 8% of pupils not completing to Leaving Certificate,
with 5% of them being lost in the second half of the secondary cycle. There is also a lower retention rate in
more disadvantaged schools - DEIS designated than non-DEIS schools.
The most up to date data available from the Department of Education on school completion and school
leaving is based on those who left school were enrolled during the year 2010/11 and not enrolled during the
19 | P a g eyear 2011/12. From this data it can be seen that nationally, 2.9% of those registered in Department of
Education and Skills assisted schools, left formal post-primary education as early leavers, across all classes.
The figure in Co. Monaghan at 3.2% was higher than the national figure.
School Leavers 2010-11 (State) %
Enrolled in second-level/further education 50.9%
Enrolled in education outside the State 15.7%
Social welfare activity 6.6%
Employment activity 4.4%
Other – including emigration 21%
Table 13: Early school leavers
Of those who completed school in 2010/11, they progressed in a number of directions:
School Completers 2010/11 (State) %
Enrolled in higher education 52.3%
Enrolled in second level/further education or 28.2%
training
Employment activity 7.3%
Social welfare activity 6.9%
Other – including seasonal employment & 5.4%
emigration
Nationally, Co. Monaghan has the youngest average age of completion of education at 18.8 yrs, with the
highest average age nationally found to be in Galway City at 22.0yrs. It should be noted however that these
averages are increasing Census by Census.
Average age at which Monaghan State
Education ceased 2011 2016
2016
Number of persons (aged 39,720 39,928 3,097,052
15+ yrs)
Average age at which 18.0 18.8 19.9yrs
education ceased
Table 15: Average age at which education ceased (Source: Census 2016)
20 | P a g eIn 2016, a total of 2,158 students from Co. Monaghan left school and went on to attend third level institutions
across Ireland. The majority of these (47.8%) attended Dublin, with Louth and Kildare being the next most
popular destinations.
Location of third level institution No %
Dublin 932 43.2
Louth 475 22.0
Kildare 184 8.5
Galway 162 7.5
Sligo 124 5.7
Donegal 124 5.7
Limerick 59 2.7
Carlow 38 1.8
Westmeath 25 1.2
Cork 22 1.0
Kerry 9 0.4
Waterford 4 0.2
Total 2,158 100%
Table 16 : Choice of Third level Institutes (Source: CSO 2016)
The limited access to degree programmes within the town has led to young people leaving Monaghan to
access third level education in Dublin and other counties. In an effort to combat this, Monaghan Institute has
partnered with DkIT to deliver the first two years of their Business Level 8 degree, with learners transferring to
DkIT for the final year.
In addition, to create more opportunities for young people, Monaghan Institute has linked with some local
businesses to develop traineeship programmes to meet emerging skills needs and to build the capacity of the
workforce. These traineeships combine classroom and workplace learning and allow the student the
opportunity to build their competencies and skills for employment in local companies. Some of the businesses
involved to date are listed below and this has been a positive development for the county.7
Laboratory Assistance Traineeship, in partnership with Monaghan Mushroom
OEM Engineering Technology Traineeship, in partnership with Combilift
Architectural Technology and Computer Aided Design Traineeship in partnership with ENTEKRA
Digital Marketing Traineeship in partnership with numerous companies across Co. Monaghan.
Not in Employment, Education of Training (NEET) – Under 25s
There is no clear singular statistic gathered which captures the number of under 25s in the NEET category.
Contributing statistics suggest that the 18-24 yrs olds are included in the Live Register Figures; however this
figure also includes some individuals in part-time work.
The number of young people under the age of 25, on the live register has shown an overall decrease of 20%
over the 2017 from 342 in January to 274 (52% compared to females 48%) in December. This number
continues to decline with figures for the number of young people 18-24 years in April 2018 at 262 and in April
2019 at 225 a yearly reduction of 36. There are seven programmes currently running in the Monaghan area to
7
https://combilift.com/en/news/
https://monaghaninstitute.ie/courses/traineeships/combilift-oem-traineeship-in-engineering-manufacturing-
technology/
21 | P a g esupport young NEET people, but retention in programmes can be difficult as very often the young person may
have complex issues.
The other data available in this regard is from the Department of Education and Skills which estimates the
percentage of early school leavers to be 3.2% in Monaghan compared with 2.4% nationally. Based on an
enrolment figure of 5,393 in the year 2018/19, this suggests that as many as 172 individual students may have
left school early this year.
Highest level of education completed
The Census gathers data on the highest level of education which has been achieved by the residents of the
country. This data set is gathered on individuals aged 15 and over, which is the case of Co. Monaghan is a total
of 39,928 individuals.
Comparing the data to that for the State, (depicted in the table overleaf) one can see that there is a higher
proportion of the Monaghan population with a lower level of education (to Leaving Certificate level – 53.8% of
15+ yrs) compared to that for the State (45.5%).
Also, there is a lower proportion of the population in Co. Monaghan educated to degree level or higher
(20.3%) than in the State (28.5%). Both these factors have implications on the employment opportunities
available to residents of Co. Monaghan.
Highest level of education completed Number of % of county State % of country
individuals population
No formal education 998 2.5% 1.7%
Primary education 5,798 14.5% 10.8%
Lower secondary 7,509 18.8% 14.5%
Upper Secondary 7,176 18.0% 18.5%
Technical/Vocational 3,784 9.5% 8.8%
Advanced Certificate 2,465 6.2% 5.9%
Higher Certificate 1,836 4.6% 5.0%
Ordinary Degree 2,547 6.4% 7.7%
Honours Degree 3,332 8.3% 10.7%
Post Graduate Degree 2,098 5.3% 9.2%
Doctorate 114 0.3% 0.9%
Not stated 2,271 5.7% 6.4%
TOTAL 39,928 100% 100%
Table 17 : Highest level of education completed (Source: Census 2016)
2.1.6.1 Religion
A total of 84.0% of the Co. Monaghan population are Catholic, with a further 7.5% indicating another Christian
faith including Church of Ireland, England, Anglican, and Episcopalian, Presbyterian or other Christian faith. A
further 3.7% of the population indicated that they were atheist.
22 | P a g e2.1.6.2 Economic Activity
The largest proportion of the population 24.2% are classified as managerial and technical, which is lower than
the State level of 28.1%. There are a higher proportion of skilled manual, semi-skilled manual and unskilled
workers (37.3%) in Co. Monaghan than in the State as a whole (28.2%).
Classification by social class Monaghan % State %
Professional workers 3,177 5.2% 8.1%
Managerial & technical 14,836 24.2% 28.1%
Non-manual 10,606 17.3% 17.6%
Skilled manual 11,644 19.0% 14.1%
Semi-skilled manual 8,085 13.2% 10.5%
Unskilled 3,154 5.1% 3.6%
All other gainfully occupied and 9,884 16.1% 18.0%
unknown
TOTAL 61,386 100% 100%
Table 18 Classification of workers by social class
As the economy of the country has improved, the numbers on the live register in Co. Monaghan have
continued to fall, although the rate of reduction has slowed over the year 2017 – (Jan 2017, 3,650 to Dec 2017,
3,144 – 11.5% decrease) and the year Jan 2018 3,105 - Dec 2018 2,572 a further 8.0% drop in employment.
Figure 8 Live Register from Jan 2018-Dec 2018
2.1.6.3 Deprivation Scores
The deprivation scores as developed by Haase & Pratschke, are based upon 10 measurements from the census
and produce two overall deprivation scores. There are 3 additional measurements also considered (in grey in
the table below). The absolute score is the score to examine when one wants to compare an area over time,
23 | P a g ewhile the relative score is the score to use when comparing different areas in the same time timeframe. The
13 measurements are outlined in the table below, comparing Monaghan with the State using the relative
deprivation score.
Deprivation Criteria Monaghan State
Relative deprivation score -3.2 +0.6
Deprivation Rank by county 11th most deprived
1. Population change 0.0 +0.1
2. Age dependency ratio 36.7 34.5
3. Lone parent ratio (with children under 15 years) 17.1 19.9
4. Primary education only 17.8 13.0
5. Third level education 26.5 35.9
6. Proportion of higher and lower professionals 29.3 36.2
7. Proportion of skilled and unskilled manual workers 22.1 17.9
8. Unemployment for males 7.4 14.1
9. Unemployment for females 14.3 12.2
10. Average number of persons per room 0.5 0.5
Proportion living in Local Authority rented accommodation 7.4 8.7
Proportion living in private rented accommodation 14.3 19.4
Proportion of owner occupied households 76.1 70.3
Table 19 Relative deprivation score
From this data Co. Monaghan ranks as the 11th most deprived county in Ireland with a relative deprivation
score of -3.2, the No. 1 most deprived country being Donegal with a score of -6.4 and the least deprived
area/county being Dun Laoghaire/Rathdown council area of Dublin with a score of +10. Despite an
improvement in the absolute deprivation score from -10.5 in the 2011 census to -7.8 in the 2016 census, a
total of 88.8% of the population of Co. Monaghan lives in EDs which are designated as marginally below
average and disadvantaged, as outlined in the table below.
Table 20 deprivation levels for Cavan and Monaghan and State figures
24 | P a g eThe most deprived EDs in Co. Monaghan are: Clones Ballybay and Castleblayney
Electoral District Population Relative deprivation score
Clones Urban 904 -15.0
Ballybay Urban 286 -12.2
Castleblayney Urban 833 -11.7
Table 21; deprivation score of the three most deprived areas in Monaghan
2.1.7 Disability
The level of disability in the county is slightly lower at 11.8% (7,218), compared to the State at 13.5%. In terms
of young people, the disability figures by age group are illustrated in the table below:
Age group Monaghan State
No. of the population with 7,214
a disability 11.8% of county population 13.5%
Numbers of children & 1,091 2.36% of total state
young people with a 1.7% of county population population
disability 5.4% of total population of children and young 8.7% of total population of children
people and young people
Age group As % of all people with a disability
0-4 yrs 2.5% 3.0%
5-9 yrs 5.6% 6.4%
10-14 yrs 5.6% 8.3%
15-19 yrs 6.3% 9.4%
20-24 yrs 6.8% 9.1%
Table 22:Numbers of children & young people with a disability (CSO,2016)
According to the State of the Nation Report for 2016, in Monaghan 117 children were registered in 2015 as
having an intellectual disability (a rate of 7.3% per 1000 of the population of children) and an additional 84
were registered as having a physical and/or sensory disability (a rate of 5.2% per 1000 of the population of
children). Nationwide, two-thirds of children registered as having an intellectual disability in 2015 were boys.
2.1.8 Housing
Co. Monaghan has a housing stock of 25,633 units, with a vacancy rate of 12.9%, which is in line with the State
figure of 12.8%, whilst being 15th highest county figure in the country. A total of 35 EDs have a vacancy rate
that is higher than the State as illustrated below in table 23
Electoral District Vacancy Rate Electoral District Number of units
Ballybay Urban 42.4% Monaghan Urban 268
Clones Urban 28.0% Carrickmacross Rural 183
Drummully 25.5% Clones Urban 164
Castleblayney Urban 23.6% Castleblayney Urban 135
Anny 23.0% Carrickmacross Urban 132
Drum 22.9% Monaghan Rural (Part Urban) 121
Monaghan Urban 20.9% Ballybay Rural 120
Raferagh 20.3% Castleblayney Rural (Part Rural) 80
Glaslough 20.3% Glaslough 80
Currin 20.0% Monaghan Rural (Part Rural) 67
Table 23 (Source: Census 2016) 10 EDs with the highest vacancy rates and the 10 EDs with the highest number of vacant units
25 | P a g eA total of 1,692 (7.8%) properties are rented from the local authority providing homes for 7.3% of the county
population. The 10 EDs with the highest proportion of local authority homes are not surprisingly the more
urban EDs with the higher concentrated population in the county and account for 75.4% of all Local Authority
housing in the county.
Top 10 EDs with highest number of Local No. of local Total Number LA housing as
Authority rented homes authority of homes in a % of total
rented homes ED housing
Monaghan Rural 309 2,242 13.8%
Castleblayney Rural 195 1,351 14.4%
Carrickmacross Rural 174 1,393 12.5%
Monaghan Urban 145 988 14.7%
Carrickmacross Urban 116 890 13.0%
Ballybay Rural 83 572 14.5%
Emyvale 71 438 16.2%
Clones Urban 67 402 16.7%
Clones Rural 59 570 10.4%
Castleblayney Urban 57 423 13.5%
TOTAL 1,276 9,269 13.7%
Table 24 Top 10 EDs with highest number of Local Authority rented homes
2.1.7 Connectivity in the county
The rate of internet connectivity of households in Co. Monaghan has improved over the past 5 years with the
number of households with no internet access decreasing from 34.2% in 2011 to 24.7%; however this is still
higher than the figure for the rest of the State in 2016 which stands at 18.4%. Almost two thirds (63.9%) of the
households in Co. Monaghan has access to a PC at home.
2.2 Health and welfare of children and young people in Co. Monaghan
2.2.1 Health & Wellbeing8
Pregnancies and new births
o The teenage birth rate has consistently reduced by 64% in the State from 3,087 births in 2001 to 1,098 in 2016.
In Co. Monaghan, there were 7 teenage birth recorded for 2016.
o In 2015 a higher proportion of pregnant women in Monaghan (93.3%) attended for antenatal care in the first
trimester of pregnancy compared with a state percentage of 88.0%
o Antenatal care in the first trimester of pregnancy was lowest amongst pregnant women aged 15-19years
(State: 77%)
o In Cavan/Monaghan the percentage (94.9%) of new-born babies visited by a public health nurse within 72
hours of discharge from hospital for the first time, was slightly lower than the state figure of 97.5%.
o In 2015, 98.3% of children in Cavan/Monaghan had their 7-9-month developmental check on time compared
to 93.7% for the State.
8
Some figures are available for Monaghan County while others are only available as a Cavan /Monaghan figure due to the nature of the
way some services are jointly managed.
26 | P a g eo In 2015, 58% of all infants in the State were breastfed on discharge from hospital – this rate has continued to
increase, but is lower with younger mothers – 15-19 yrs old 26.4% and 20-24 yrs – 36.8%. The rate of
breastfeeding in Co. Monaghan is 8th lowest in the country at 47.2%.
Sexually Transmitted Diseases
o In 2016, 70% of all sexually transmitted diseases notified in the State were in people younger than 30 years of
age. There was an increase in the number of STIs treated between 2015 and 2016 in the order of 10%, and in
the 15-24yr age group 50% of patients treated for STIs were treated for Chlamydia, 43% were treated for
Herpes Simplex and 37% for Gonorrhoea.
Suicide
o In 2016 there were 6 suicides recorded in Co. Monaghan – a rate of 10.2 per 100,000, which gave Monaghan
12th highest suicide rate in the country with the rate for the State is 8.5. The rate per 100,000 of population
for male suicides is higher at 17.0 than females in Co. Monaghan at 3.4, which is in line with the rate for the
State (State: Male 13.8, females 3.4).
o In 2017 a figure of 12 deaths by suicide resulted in Monaghan having the highest rate of suicide in the country
with a figure of 19.2 per year per 100,000 population.
Self-harm
o The Cavan/Monaghan area also recorded a higher ratio in the rate per 100,000 of population of male to
female self-harm cases (1:1.44) compared to the ratio in the State (1: 1.19).
Mental Health referrals
o In the Cavan/Monaghan area in 2015, ‘depressive disorders’ were the most common reason for admission to
psychiatric hospitals/units and child and adolescent units with 32.4% (163) of all admissions on this basis in
2015. There were 6 admissions of children and young people in Co. Monaghan with a rate of 37.4 admissions
per 100,000 of population in 2015.
o
o 4/5 (80.9%) of all admission are young people in the 15-17 age group with the larger proportion 60.2% being
girls and 39.8% being boys.
o One in four people in Ireland experience mental health difficulties and this increases to one third of young
people between 18 and 19 years. However less than one in four students seeks support.
o Times of transition such as moving away from home and going to college are known to trigger stress which
may lead to reduced mental health wellbeing. (Source: Mental Health Matters Report 2016)
Referrals to the Garda Diversion Programme (2014)
o In 2014, there were 545 referrals of 253 children and young people (aged 10-17yrs) made to the Garda
Diversion Programme in Cavan & Monaghan. This results in a rate per 1,000 of 16.6 (based on 2011 census
figures) children and young people being referred to the programme. Almost ¾ of these individuals were aged
15-17yrs with almost three times the number of boys to girls being referred.9
9
(Source: State of the Nation Report 2016)
27 | P a g e LGBTI Young People
There is no specific data available from Cavan and Monaghan on the youth LGBTI community, however
commonly used percentages suggest that 6-10% of the population identify with a sexual identity other than
heterosexual. There have been support groups for LGBTI young people in Co. Monaghan for a number of year
(Carrickmacross, Monaghan Town and Castleblayney and more recently Clones) some are supported through
Youth work Ireland Foroige and the Teach na Daoine Family resource centre. These support groups meet
independently of each other and so one of the aims of the CYPSC plan is to have a more joined up approach to
providing support to young LGBTI+ people and their families throughout Monaghan
The recent LGBT Ireland Report 2017 which focused on the mental health of LGBTI young people in Ireland
suggested the following key facts:
Feedback from the 1,064 LGBTI young people surveyed suggest that compared to other young people they
are:
o 2 time more likely to self-harm
o 3 time more likely to attempt suicide
o 4 times more likely to experience severe stress, anxiety and depression
The most common age that young people discovered their LGBTI+ identity was 12 yrs
The most common age that young people first told someone that they were LGBTI+ was 16 yrs
1 in 4 young people who had come out had not told their mother or father that they were LGBTI+
The main reason people did not come out earlier was fear of rejection and discrimination, especially by family
and friends.
44% of young people surveyed indicated levels of drinking that suggested some level of dependence.
Recreational drug use was 2 times higher among the LGBTI+ young people than the general population
Only 20% of the young people surveyed felt they belonged completely in their school community
50% of them personally experienced anti- LGBTI+ bullying at school
1 in 4 considered leaving school early and 1 in 20 did leave school early.
50% felt unsafe or very unsafe showing affection or holding hands in public
75% have been verbally abused because of being LGBTI+
1 in 5 have been punched, hit or physically attached in public due to being LGBTI+
To address some of these findings; Funding to raise awareness of LGBTI+ issues has been secured through the
Department of Children and Youth Affairs (DCYA) by Youth Work Ireland to develop a training resource for use
by youth workers, teachers, and also frontline health care, and social care staff.
28 | P a g e2.2.2 Child Protection and family support in 2017/18
Source: Cavan /Monaghan Tusla 2017
Number of Child Protection referrals: 2017: 1,297 2016: 1,092 2015: 921
% +/- on previous year: +14% +10%
Number of Children in Care 2017: 2017: 157 2016: 152 2015: 171
% +/- on previous year: +3% -11%
Number of new admissions to care 2017: 29
Number of discharges from care 2017: 13 from care and another 12 came of age with 11
taking up Aftercare Services
Number of young people in Aftercare 72 aged 18-22 yrs
Service: 22 complex cases: 30.5%
Table 25: Child protection and family support joint figures for Cavan and Monaghan
Approximately 40% of referrals coming into Cavan/ Monaghan Tusla in 2017 were relating to children/young
people in Co Monaghan
29% of all referrals for 2017 were made by Gardaí
Only a small percentage of these referrals (2%) resulted in children being taken into care
16% of all referrals were screened and deemed to need no further action
A further 24% progressed as referrals to the Prevention, Partnership and Family Support (PPFS) team in order
to receive appropriate support in the community to prevent deterioration in the situation of concern.
receiving appropriate support (e.g. Prevention Partnership & Family Support Programme)
PPFS supported just under 500 children and young people in 2017.
In 2017 there were 157 children in care – the majority of which were in foster care, with 2 in residential care
settings.
25 were discharged from care in the same period
o 13 being returned to their families
o 12 coming of age (18) and of these 11 progressing to Aftercare Services
Children in Care in Cavan and Monaghan
Over half (51%) of all children in care (157) in 2017 were from minority groups – Irish travellers and non-Irish
nationals.
Out of 30 non-Irish national children in care in 2017, 47% were from the continent of Africa (Congolese,
Malawian, Nigerian and Black African), with Black African making up the largest proportion of this group (27%
of all CIC).
The two main reasons for admission of children to care is in relation to neglect (46.5%) and welfare concerns
(38.9%).
Almost half of children (47%) currently in care are in the 12-17yr old age bracket, however in 2017 over half
(52%) of new admissions were in the 0-5yr age group.
Over two thirds of all children currently in care (70%) were taken into care before they were 5 yrs old. In fact,
almost one third of these were taken into care as babies (31%), at less than 1 year old.
There is a higher proportion (82%) of young children from the travelling community being taken into care than
the Irish or non-Irish nationals (65% and 63% respectively)
Also, there is a higher proportion of teens from non-Irish national communities (17%) than other ethnicities
being taken into care.
None of the travelling community children in care were admitted into care in their teens.
29 | P a g eYou can also read