IN GRADUATE STUDIES THE DRIVERS OF SUCCESS IN THE UNIVERSITÉ DU QUÉBEC NETWORK - BRIEF FROM THE SCIENTIFIC COMMITTEE OF LA GRANDE INITIATIVE ...
←
→
Page content transcription
If your browser does not render page correctly, please read the page content below
THE DRIVERS OF SUCCESS IN GRADUATE STUDIES
                               IN THE UNIVERSITÉ DU QUÉBEC NETWORK

  THE DRIVERS OF SUCCESS
    IN GRADUATE STUDIES
IN THE UNIVERSITÉ DU QUÉBEC
          NETWORK
    BRIEF FROM THE SCIENTIFIC COMMITTEE OF
    LA GRANDE INITIATIVE RÉSEAU EN RÉUSSITE
THE DRIVERS OF SUCCESS IN GRADUATE STUDIES
IN THE UNIVERSITÉ DU QUÉBEC NETWORK
How to cite this brief:
Scientific Committee of La Grande initiative réseau en Réussite.
(2020). The Drivers of Success in Graduate Studies in the Université
du Québec Network. Université du Québec.
You can consult this brief on the Université du Québec’s website
at : http://www.uquebec.ca/reseau/fr/publications/rapports-des-
groupes-de-travail
This translation was made possible thanks to the support of the
Ministère de l’Enseignement supérieur du Québec. The latter
finances such projects with contributions provided for in the
Canada-Quebec Agreement on Minority-Language Education and
Second-Language Instruction.
This document was produced using gender-inclusive language.THE DRIVERS OF SUCCESS IN GRADUATE STUDIES
IN THE UNIVERSITÉ DU QUÉBEC NETWORK
Brief from the Scientific Committee of La Grande
initiative réseau en Réussite of Université du
Québec
MARIE-PIERRE BARON
Université du Québec à Chicoutimi
SYLVIE BONIN
Université du Québec
FRÉDÉRIC DESCHENAUX
Université du Québec à Rimouski
SERGE GÉRIN-LAJOIE
Télé-université
EL HADJI YAYA KONÉ
Université du Québec en Abitibi-Témiscamingue
SÉVERINE PARENT
Université du Québec à Rimouski
CHANTAL ROYER
Université du Québec à Trois-Rivières
With the valued collaboration of
JULIE COURCY
Research agent
And of
VÉRONIQUE D’AMOURS
Université du Québec
CATHERINE ROY-BOULANGER
Université du QuébecTHE DRIVERS OF SUCCESS IN GRADUATE STUDIES
IN THE UNIVERSITÉ DU QUÉBEC NETWORK
Acknowledgements
The brief on The Drivers of Success in Graduate Studies in the
Université du Québec Network would not have been possible
without the financial support from the Fonds de développement
académique du réseau (FODAR) and the participation of valuable
collaborators. We sincerely thank them.
Alain Couillard for data access
Sophie Duchaine for joint reflection
Julie Gagné for assistance with gender-inclusive language
(French version)
Caroline Gauvin for linguistic revision (French version)
Linda Tailleur for translation (in the French version)THE DRIVERS OF SUCCESS IN GRADUATE STUDIES IN THE UNIVERSITÉ DU QUÉBEC NETWORK
Table of Contents
.............................................................................................................................................................................. 3
LIST OF FIGURES ......................................................................................................................... 3
1. CONTEXT AND PROBLEM ........................................................................................................ 4
La Grande initiative réseau en réussite of Université du Québec ........................................................................... 4
The Problem ..............................................................................................................................................................5
Objectives of the brief ...............................................................................................................................................5
Data sources ..............................................................................................................................................................6
2. THE GRADUATE STUDENT POPULATION OF THE UNIVERSITÉ DU QUÉBEC NETWORK .............. 7
A distinctive student profile ................................................................................................................................... 7
The type of credentials (degrees) sought at the graduate level ...............................................................................7
Age of graduate students ..........................................................................................................................................8
Gender of graduate students ....................................................................................................................................8
First-generation university students (FGUSs) enrolled in graduate studies ..............................................................9
Graduate students with disabilities or with emerging disabilities ............................................................................9
Indigenous graduate students.................................................................................................................................10
International students .............................................................................................................................................10
Permanent residents ...............................................................................................................................................11
Financial and family responsibilities of graduate students .....................................................................................11
Registration status chosen by graduate students ...................................................................................................13
Modes of training offered at the graduate level .....................................................................................................13
Graduate student population at a glance ............................................................................................................. 14
3. SUCCESS AT UNIVERSITY ........................................................................................................16
Perseverance and success, a process ................................................................................................................... 16
A brief history of research concerns in terms of academic success ...................................................................... 17
4. GRADUATE SUCCESS FACTORS IN ACCORDANCE WITH THE CONCERNS OF THE UNIVERSITÉ DU
QUÉBEC NETWORK....................................................................................................................19
4.1 Individual and personal factors ...................................................................................................................... 19
The graduate student’s personal background ........................................................................................................20
The nature of the programs and the competencies targeted by graduate education ...........................................20
Organizational competencies ..................................................................................................................................21
Information and literacy competencies ..................................................................................................................21
Digital competency..................................................................................................................................................22
Emotional competency ...........................................................................................................................................23
4.2 Graduate student motivation and commitment............................................................................................. 24
Motivation ...............................................................................................................................................................24
1THE DRIVERS OF SUCCESS IN GRADUATE STUDIES IN THE UNIVERSITÉ DU QUÉBEC NETWORK
Commitment ...........................................................................................................................................................25
The direction and duration of the study project.................................................................................................25
Integration as a driver of motivation and commitment..........................................................................................26
4.3 Pedagogical and supervisory practices ........................................................................................................... 27
The pedagogical relationship of supervision ...........................................................................................................27
The personal dimension ......................................................................................................................................28
The socioaffective dimension .............................................................................................................................29
The regularity and the course of interactions .....................................................................................................29
Potential challenges faced by the supervisor and the student ...........................................................................30
The scientific and professional dimensions ........................................................................................................31
Pedagogical design and training modalities ........................................................................................................31
4.4 Resources....................................................................................................................................................... 33
Psychological resources ..........................................................................................................................................33
Financial resources ..................................................................................................................................................34
4.5 Summary of success factors addressed .......................................................................................................... 36
5. SUCCESS, A COLLECTIVE CONCERN ........................................................................................38
5.1 The role and responsibilities of the graduate student .................................................................................... 38
5.2 The role and responsibilities of the research supervisor ................................................................................ 38
Supervisory style .................................................................................................................................................39
Financial responsibilities .....................................................................................................................................40
Student guidance ................................................................................................................................................40
5.3 The role of the program and its responsibilities ............................................................................................. 41
5.4 The institution’s role and responsibilities....................................................................................................... 42
6. FINDINGS AND DRIVERS OF GRADUATE SUCCESS ...................................................................43
6.1 Findings.......................................................................................................................................................... 43
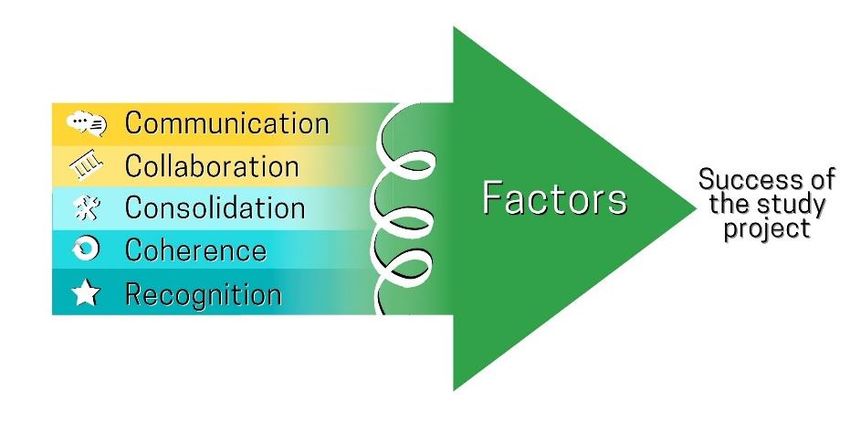
6.2 Drivers of success ........................................................................................................................................... 44
COMMUNICATION ..................................................................................................................................................45
COLLABORATION .....................................................................................................................................................45
CONSOLIDATION .....................................................................................................................................................45
COHERENCE .............................................................................................................................................................46
RECOGNITION..........................................................................................................................................................46
6.3 Possible further action ................................................................................................................................... 46
LIST OF REFERENCES..................................................................................................................47
2THE DRIVERS OF SUCCESS IN GRADUATE STUDIES IN THE UNIVERSITÉ DU QUÉBEC NETWORK
List of figures
Figure 1. Graduation rate after 5 years .............................................................................................................. 5
Figure 2. Distribution of graduate student enrolment at UQ for Fall 2019. ........................................................ 7
Figure 3. Average age of the UQ student population by type of program (PRISME, UQ).................................... 8
Figure 4. Summary of population characteristics of FGUSs enrolled in graduate studies in the UQ system ....... 9
Figure 5. Type of financial support for studies (CGPSS).................................................................................... 12
Figure 6. Distribution of graduate students by field of study ........................................................................... 12
Figure 7. Proportion of graduate students studying part time (excluding international students) ................... 13
Figure 8. Summary of population characteristics of graduate students in the UQ network ............................. 15
Figure 9. Reasons to enrol in the graduate program for doctoral students at Université du Québec (ICOPE
2016)................................................................................................................................................. 25
Figure 10. Frequency of financial support for students supported by research office funding (Couillard et al.,
2018b)............................................................................................................................................... 40
Figure 11. Representation of the interaction between drivers of success of the graduate study project ........... 44
31. Context and problem
It is clear that the growth of Quebec society inevitably involves the development of cultural, economic,
technological and scientific sectors (Université du Québec, 2013). In an ever-changing global context, the
Université du Québec (UQ) network is pursuing its mandate to increase the level of education of the
Quebec population, to ensure Quebec’s scientific development, and to contribute to the development of
its regions.
Social realities, democratization and accessibility of postsecondary education have widely contributed to
the diversification of the student populations admitted to the network’s universities.1 This excitement
surrounding the increase in school enrolment of the population at large was also addressed in a recent
brief from the Conseil supérieur de l’éducation (CSÉ, 2019). At this level of education, students are seen
as generally balancing multiple responsibilities (family, parental, and professional).
Graduate education is one of the keys to the development of an educated,
innovative, high-performing, and competitive society.
The network is seeing continuous growth in graduate enrolment and in the heterogeneity of the student
population. Challenges in terms of support and study needs are increasing. The UQ network is aware of
the new reality of this student population, and in its effort to meet today’s professional and scientific
requirements, is continually adjusting its educational offering and promoting access in a number of ways.
In particular, these strategies make it possible to promote a better balance between university studies
and student life (Université du Québec, 2020b). Thanks to the niches of excellence (Université du Québec,
2020a) developed in education and research by the 10 autonomous institutions of the UQ network,2 more
than 41,600 graduate students3 contribute each year to the scientific advancement of Quebec society, its
economic prosperity, its cultural and social development, the development of its communities and
regions, and its international influence.
La Grande initiative réseau en réussite of Université du Québec
Given the diversity of the populations now entering graduate school; given the variable resources and
services; given the context and needs of graduate students with regard to learning and supervision; given
the lower graduation rates in the network’s universities compared with the Quebec average; and given
1. People living in (or coming from) remote areas, first-generation university students, members of Indigenous peoples, students
from outside Quebec, people with disabilities (traditional or emerging), people from socioeconomic backgrounds historically
absent from higher education.
2. Université du Québec à Montréal (UQAM), Université du Québec à Trois-Rivières (UQTR), Université du Québec à Chicoutimi
(UQAC), Université du Québec à Rimouski (UQAR), Université du Québec en Outaouais (UQO), Université du Québec en
Abitibi-Témiscamingue (UQAT), Institut national de la recherche scientifique (INRS), École nationale d’administration publique
(ENAP), École de technologie supérieure (ÉTS), and Université TÉLUQ (TÉLUQ).
3. Student enrolment calculated based on UQ’s PRISME database for the 2018-2019 academic year, which represents 22% of
the network’s student population enrolled in a graduate program at the master’s or doctoral level (PRISME, Université du
Québec).
4the variability of the commitment and supervision by faculty members from a pedagogical standpoint, in
2018, the Direction des études et de la recherche (DER) proposed an action plan aimed at “increasing the
graduation and retention rates of the network’s master’s research and doctoral students” (p.9). In line
with this, in January 2019, the teaching and research vice-rectorates of the network’s institutions
launched la Grande initiative réseau en réussite (GIR Réussite). The aims of this initiative were to
determine the present status, to support the academic path of graduate students, to support the
supervisory staff in their role, and to strengthen the capacity of the network’s institutions to support the
student success process. As a turning point for this action plan, the network’s institutions asked the DER
to document this problem in order to inform their reflections on potential common courses of action
(Couillard et al., 2017). Consequently, a scientific committee4 was created with the mandate to review the
most recent literature on factors that promote graduate success.
The Problem
Proud to provide access to education to as many people as possible – notably through a democratic and
accessible recruitment and enrolment processes at all levels – UQ noted that the graduation rate was
generally lower at the graduate level compared with other Quebec universities.
In 2010, a comparison of graduation rates and average
durations of studies between Université du Québec
(UQ) and G13 5 institutions revealed a worrisome
situation with respect to graduate success [for
example, the average graduation rate for a master’s
degree (research type) after five years for institutions
in the UQ network was 55.6%, while the G13 average
was 82.4%]. (Couillard et al., 2018b)
Considering that the network has a plurality of graduate student
profiles, how can we ensure that each individual is in the best
possible position to succeed in their chosen studies? What aspects
of success should institutions focus on to promote the development
Figure 1. Graduation rate after 5 years
of their students at these levels of study?
Objectives of the brief
The following guidelines were adopted by the scientific committee to guide the drafting of this brief on
factors for graduate success (Université du Québec, 2019).
✓ Present an up-to-date portrait of what sets the graduate student populations in the
institutions of the UQ network apart.
4. Composed of six faculty members from network institutions, a representative from the Direction de la recherche
institutionnelle (DRI), the GIR Réussite coordinator and a research professional.
5. Called the U15 since 2011. Until then, this group of Canadian research universities consisted of the following universities:
University of Alberta, McGill University, University of Calgary, University of British Columbia, Dalhousie University, University
of Ottawa, University of Toronto, McMaster University, Université Laval, University of Western Ontario, Université de
Montréal, Queen’s University and University of Waterloo.
5✓ Outline the theoretical considerations for graduate student success.
✓ Explain the latest knowledge on the factors of graduate student success.
✓ Specify the roles and responsibilities of the actors involved in the common project of
student success: the student, the supervising faculty, the program and the institution.
✓ For the benefit of the institutional management, detail the key success factors as well
as the anticipated benefits of consolidating support measures for success.
At the end of this brief, it will be possible to 1) identify the external and internal factors that influence
student success, particularly at the graduate level, 2) identify the roles and responsibilities of the actors
involved in the success process, and 3) identify certain drivers of the common goal of student success.
Data sources
Considering the desired orientations of this brief, it was decided to focus exclusively on the factors that
contribute to success in the graduate education pathway, rather than on risk, dropout or withdrawal
factors. Aimed at shedding new light on and at understanding the complexity of the phenomenon of
success and perseverance at the graduate level, this brief is based on a review of the most recent literature
and makes use of several databases and survey data6 that have made it possible to produce statistics
specific to the UQ network.
6. Canadian Graduate and Professional Student Survey (CGPSS), the network-wide study on support in graduate education,
Indicateurs de COnditions de Poursuite des Études (ICOPE), the Gestion des données sur l’effectif universitaire of the
Ministère de l’Éducation et de l’Enseignement supérieur (GDEU, MEES), the institutional database of Université du Québec
(PRISME), the Postsecondary Student Information System (PSIS, StatCan).
62. The graduate student population of the Université du
Québec network
As noted by the CSÉ in 2000, research in the United States and Europe has emphasized the unequal
representation of various population groups at university, characterized by age, social origin, gender,
ethnicity, disability or socioeconomic status. In 2019, the CSÉ reiterated the increasing complexity of
student profiles on the Quebec scene – profiles that were previously rather homogeneous or more
traditional; “the landscape in which universities operate [is] marked by the diversity of student profiles
and educational pathways” (p. 16). The typical dominant profile is no longer a person “in their early
twenties, involved almost exclusively in a training project and attending a university campus full time”
(CSÉ, 2013, p. 86).
While the following describes population characteristics based on different graduation rates, among
others, it is important to keep in mind that this indicator is not sufficient to explain the complexity of the
phenomenon of success. This aspect will be addressed in detail in the next section.
A distinctive student profile
To our knowledge, very little in the literature provides the characteristics of graduate student profiles.
Using the various databases and surveys available,7 a description of the main population attributes of
graduate students in the UQ network is provided below.
The type of credentials (degrees) sought at the graduate level
Data from Statistics Canada’s Postsecondary Student Information System (PSIS) show that Quebec
accounts for 35% of Canada’s graduate enrolment, much higher than its representation in the Canadian
population (23%) (StatCan, 2019).
Specifically for the UQ network,
eight out of ten graduate students
are enrolled at the master’s level
(Figure 2). The majority of graduate
students opt for degree programs,8
representing 73% of the Fall 2019
enrolment 9 (PRISME, UQ; GDEU,
ministère de l’Éducation et de Figure 2. Distribution of graduate student enrolment at UQ for Fall 2019
l’Enseignement supérieur (MEES)).
Other enrolments tend to be in short programs, specialized graduate degrees or independent studies.
7. See Section 2 – Population.
8. According to the definition in the Règlements généraux aux cycles supérieurs of Université du Québec, a graduate degree
program refers to “a title conferred by Université du Québec or by Université du Québec à Montréal and attested by a
diploma. The degree is obtained upon successful completion of a master’s or doctoral program” (2018, p. 5).
9. Breakdown of this statistic: 30% for the professional master’s degree, 24% for the research master’s degree and 19% for the
doctorate.
7Age of graduate students
Compared with universities outside the network, students
entering graduate studies at UQ are often older. In the fall of 2019,
81% of UQ students entering a master’s program were 25 years of
age or older. Excluding international students, the proportion
increased to 88% (GDEU system, MEES). More specifically, the
average age of the student population at UQ is 34 at the master’s
level (36 for the specialized graduate degree, 38 for short master’s
programs) and 36 at the doctoral level (PRISME, UQ) (Figure 3).
Data from UQ show that the graduation rate of full-time students
declines with age, regardless of the level of education (Bonin, in
press). The data also indicate that the graduation rates of those
Figure 3. Average age of the UQ student
who begin their master’s studies (specialized graduate degree or population by type of program (PRISME, UQ)
master’s degree) before the age of 25 are at least 10 points higher
than those of persons aged 25 and over. The gap reaches 30 percentage points compared with those who
return to school even later (at age 40 or older). Similarly, students who begin a doctoral program before
the age of 25 graduate in a higher proportion than either those entering after age 25 (20 points higher) or
those entering after the age of 40 (40 points higher).
Gender of graduate students
According to MEES data, in the fall of 2019, women accounted for 56% of graduate students at UQ.
Moreover, the data show that the proportion of women gradually decreases as the study cycles progress,
from 61% at the undergraduate level, to 57% at the master’s level, to 52% at the doctoral level, to only
28% at the post-doctoral level.
That being said, because of its recruitment activities, the type of programs offered, etc. the realities with
respect to female and male enrolment are different for each institution in the network. In most Canadian
provinces, the challenge of under-representation of women “in certain mathematics, computer science
and engineering subjects” (Conference Board of Canada (CBC), 2020) persists: women are more likely to
enrol in the humanities, social sciences or education and men are more present in engineering,
mathematics and computer and information sciences (CBC, 2020). This reality is also observed at UQ
where, in the fall of 2019, women represented only between 20% and 25% of graduate students in
computer science and engineering and about 40% of those in mathematics, earth sciences and
atmospheric sciences (GDEU system, MEES). In terms of male representation, men in the network appear
to be less present in fields of study such as health sciences,10 representing less than 20% of the graduate
population in this field. The same is true for education, where the ratio is only one man to every three
women, at both the undergraduate and graduate levels.
Irrespective of the registration status or program type, women enrolled in a master’s research or doctoral
program obtain a degree in a higher proportion than men. On the other hand, a higher proportion of men
10. Nursing, occupational therapy, community health and epidemiology as well as speech-language pathology and audiology.
8are graduating part time from graduate professional programmes (specialized graduate degree and
professional master’s degrees) (Bonin, in press). Moreover, in terms of success for both women and men,
the gender variable is more relevant when considering other determinants (responsibilities, balancing
studies, family and work, type of programs, registration status, etc.).
First-generation university students (FGUSs) enrolled in graduate studies
First-generation university students (FGUSs) are designated as “students from families with low
educational capital and are part of groups that are under-represented in higher education” (CAPRES,
2015). More specifically, the term FGUS refers to students whose parents did not achieve higher
education. Just like the network population, FGUSs include a
variety of student profiles: members of Indigenous peoples,
people with traditional or emerging disabilities, people from
Average age at
entry 34
rural areas and low-income families, etc. (CAPRES, 2016).
Bonin et al., (2015) point out that a particular quality of FGUSs Employed
70%
was their lack of support (academic, financial, etc.). from
parents, lower educational aspirations, more frequent
interruptions of studies, later access to university, and greater
Women
59%
family and financial responsibilities. The authors explain that
FGUSs are more often required to define their study project
Family
responsibilities 40%
alone and to use [meaningful] models [other] than that of the
family environment (p. 15). Interruption of
previous studies 40%
Forty-five percent of UQ’s graduate population consists of Figure 4. Summary of population characteristics of
first-generation university students FGUSs (Bonin and Girard, FGUSs enrolled in graduate studies in the UQ
system
2017), 59% of whom are women. The data show that FGUSs
enter higher education at an older age than other students (at age 34, on average, compared with age 30)
(ICOPE Survey, 2016); that close to 40% of FGUSs at the graduate level have already interrupted previous
studies; close to 70% are employed during their studies; more than a third will finance their studies by
working full time; and close to 40% also have family responsibilities in addition to their studies (Figure 4).
FGUSs enrolled full time in master’s and doctoral programs at UQ graduate in a smaller proportion than
students whose parents have undertaken university studies11.
Graduate students with disabilities or with emerging disabilities
Thanks in particular to institutions that are increasingly taking into account the specific needs (Marcellini,
2017) of students with traditional or emerging disabilities, 12 the proportion of people with learning
problems or difficulties, due to a health problem or functional impairment, has increased considerably in
recent years (Bonin and Girard, 2017; Prud’homme et al., 2013). Constantly growing, this proportion has
11. Those who are also first-generation college graduates, i.e., whose parents’ education does not go beyond high school
(including vocational training programs), have even lower graduation rates. The importance for university success of at least
one model of college education at home has been documented (Bonin, 2019b, in press).
12. “Traditional disability” refers to severe hearing and visual impairments, to motor and organic impairments, language, and
speech disorders. “Emerging disability” refers to learning disabilities, attention-deficit hyperactivity disorder (ADHD), mental
health disorder or autism spectrum disorder (GT-ESHÉ, 2014).
9more than doubled in 5 years at the graduate level at UQ, increasing from 3% in 2011 to 7% in 2016 (ICOPE
survey, 2011, 2016). Since disclosing one’s disability status is not a legal obligation, but a personal choice
(AQICESH)13, it is possible to assume that mental health disorders (MHDs) or neurocognitive disorders14
influence the university path of more students than identified. This situation, associated with lower
enrolment, makes it difficult to accurately measure the graduation rates of graduate students with
disabilities or emerging disabilities.15 Finally, it is important to note that the overall average does not
appear to be the only indicator of success for these students; students with learning and attention
disorders appear to have lower averages without any impact on their perseverance or graduation (Robert,
Debeurme and Joly, 2016).
Indigenous graduate students
Like FGUSs and students with disabilities or with emerging disabilities, Indigenous students are a
population with unique characteristics and challenges in terms of socioeconomic, geographic and cultural
factors (Université du Québec, 2017) that require separate examination. Prior to the addition of a question
to the ICOPE survey in 2016, institutional data from institutions did not accurately measure the Indigenous
presence. Since then, respondents have been able to voluntarily identify themselves as Indigenous.
Currently, it is estimated that Indigenous peoples represent 2% of the graduate student population at UQ.
Although there are relatively fewer Indigenous people attending university, the proportion that
perseveres and graduates is comparable to that of the non-Indigenous student population (Council of
Ministers of Education (Canada), 2012; Hango and De Broucker, 2007; Maxim and White, 2006). Although
it is not possible to determine graduation rates at UQ at this time16, Bonin’s analysis (2019a) nonetheless
points out that certain obstacles encountered by Indigenous students could have repercussions on their
perseverance and graduation. For example, compared with non-Indigenous students, a larger proportion
have children in their care as well as take care of their children alone. Access to education also occurs at
a later age, even among those who are not parents. A high number of them being FGUSs, many Indigenous
students come from families where their parents’ education does not go beyond high school. Also, this
group of students self-evaluates as having poorer language skills (French and English) and their results in
the first semester are lower17. It should be noted, however, that only 11% of Indigenous students at UQ
are pursuing graduate studies, compared with 23% of the general student population.
International students
The Government of Canada (2020) defines international students as persons who are not Canadian
citizens and who are authorized to enter Canada temporarily for the purpose of study. In the provincial
13. AQICESH’s 2018-2019 statistical report indicates that 5,745 students with disabilities attending UQ contacted their
institution’s reception and support services during the past year. The report does not, however, provide the corresponding
number for graduate cycles specifically.
14. Including learning disabilities (LDs), autism spectrum disorders (ASDs) and attention-deficit hyperactivity disorder (ADHD).
15. However, undergraduate data at UQ still suggest that shorter programs (e.g., a certificate rather than a bachelor’s degree)
appear to promote persistence in students with disabilities (Bonin, in press).
16. It will be a few more years before students who began their training program in the fall of 2016 can be considered for
graduation analysis.
17. The indicators of success in the first quarter analyzed are the cumulative average and the proportion of courses successfully
completed of the total courses taken.
10data, international students are described as “persons registered in the Quebec education system who do
not have the legal status as a Canadian citizen, permanent resident or registered Indian (under the Indian
Act)” (MEES, 2020b).
The international student population has experienced strong growth in recent years at Quebec
universities, particularly at the graduate level. This facilitated access can be explained by various
government and institutional measures (MEES, 2020b). At UQ, the representation of this type of student
at the graduate level has doubled in 10 years, from 13% in the fall of 2009 to 26% in the fall of 2019 (GDEU
system, MEES). Their participation is even more pronounced at the doctoral level, where they represent
36% of the total student population. Due to their more traditional education profile, the increased
presence of these graduate students is changing the overall picture of the network’s population. In fact,
data from the ICOPE 2016 survey show that compared with the local population, the international student
population is predominantly male, younger on average, more likely to be enrolled full time in a relatively
continuous path, and assumes fewer personal responsibilities (parenthood, employment) in parallel with
their higher education. In terms of graduation, these students generally graduate in a higher proportion
than Canadian citizens.
Permanent residents
Permanent residents have a distinct profile. At the graduate level at UQ, the relative proportion of this
population has declined from 14% to 7% over the last decade (GDEU system, MEES). This student
population is mainly male, as female students with permanent residence are on average older, with major
family responsibilities (more than 50% have children, almost 15% also take care of other family members)
and financial responsibilities (60% work more than 30 hours a week in addition to their studies, often part
time). The challenges associated with the realities of this profile result in lower graduation rates than
those of other students (Bonin, in press; ICOPE survey, 2016).
Financial and family responsibilities of graduate students
Historically, graduate students have come from the intellectual and financial elite. When the constituents
of the UQ and its associated study centres were created throughout Quebec, people from various
backgrounds with varying assets (socioeconomic and cultural) gained access to university and graduate
studies. Today, this diversification of the student population in the network’s institutions is becoming
more pronounced, where students largely reconcile their studies with family, financial, personal, or
professional obligations.
For example (Figure 5), according to the 2019 Canadian Graduate and Professional Student Survey
(CGPSS), 37% of students in a research profile at UQ indicate that they finance their studies primarily
through off-campus employment. Other sources of financial support identified by respondents were, in
order of importance, loans from various sources, family savings or assistance (18%), provincial bursaries
11based on financial need (18%),
and grants and bursaries from
provincial (13%) and federal
(13%) granting agencies. Only
10% of respondents said that they
finance their studies mainly
through graduate research
assistantships and 6% as graduate
teaching assistants18.
Despite these multiple sources of Figure 5. Type of financial support (CGPSS)
funding, just over one-third of
students (36%) in a research program (master’s or doctoral) describe their financial situation as
precarious. This large proportion can be explained, in part, by the responsibilities inherent in their family
situation (Bonin, 2014). Although it varies from one institution to another19, generally speaking, nearly
30% of people enrolled in graduate studies at UQ have children in their care (Bonin and Girard, 2017). For
example, the data indicate that 73% of graduate students who are parents hold paid employment during
their studies, of which 71% work more than 30 hours per week. By comparison, only 59% of the student
population without children are employed in such jobs, with 37% spending more than 30 hours per week
in such jobs.
The comments gathered by the ICOPE survey attest to the financial difficulties experienced by those with
family responsibilities; “they are obviously among the first points mentioned. In addition to the decline in
income, which often goes hand-in-hand with education, there is also a decline in access to scholarships,
increased debt loads, and the cost of childcare” (Bonin, 2014, p. 1-2).
The ICOPE (2016) data enable us to observe distinctive
program choices among students with significant family
and financial responsibilities (Figure 6). The majority
(65%) of students with children opted for a program in
Business Administration (48%) or Education (17%),
while these two disciplinary sectors were chosen by just
29% and 8% of non-parents, respectively.
Finally, at UQ, the graduation rates in research
programs for full-time graduate students who are
parents are on average 25 to 30 percentage points
lower than those of students without children 20 . To
explain the possible connections between Figure 6. Distribution of graduate students by field of study
perseverance, success and the number of children, for
18. Respondents could check more than one box for the same question.
19. The proportion ranges from 17-18% at ÉTS, INRS and UQAC, to 46% at TÉLUQ and 58% at ENAP (ICOPE Survey, 2016).
20. For populations with children who are enrolled in part-time studies, it should however be noted that the differences between
the two student groups are quite small, if not insignificant (Bonin, in press).
12example, it is essential to take into account other explanatory factors related to the family such as the age
of the children, their age gap, support from relatives, etc. (Bonin, in press). In other words, the impact of
parenting on student retention varies from one person to the next.
Registration status chosen by graduate students
The preferred registration status at the graduate level seems to differ from that of students at other
Quebec universities. In the fall of 2019, data from the MEES (GDEU system) indicate that 44% of graduate
enrolments in the network were in a part-time program
compared with 35% for other Quebec universities. Not counting
international students (who are mainly full time) 21 , the
proportion of part-time students is 54% at the graduate level at
UQ, and, more precisely, 63.5% at the master’s level.
In terms of graduation, part-time students have lower graduation
rates than full-time students regardless of the type of program
(Duchaine et al., 2014). Recent UQ data confirm that those who
start their studies part time graduate in a lower proportion than
those who start full time. For professional programs (specialized Figure 7. Proportion of graduate students studying
part time (excluding international students)
graduate degree and master’s degree without dissertation), the
part-time graduation rate is about 20 percentage points lower than the full-time rate. For research
programs, the gap is even greater (45 points at the master’s level with dissertation and 34 points at the
doctoral level) (Bonin, in press).
Modes of training offered at the graduate level
Several initiatives implemented by the network aim to support the diversity of the needs of the student
population in terms of training modalities (Université du Québec, 2020b). Institutions offer, for example,
short programs that facilitate a step-by-step path, tailor-made graduate programs with modular and
flexible course schedules to meet the professional and family realities of the students, or partial or
complete distance education paths. As indicated by Bonin and Girard (2017): “For UQ’s clientele, which is
made up largely of adult students, many of whom have parental responsibilities, the distance course
offering makes perfect sense.”
In person is no longer the only way to pursue graduate education.
21. Registration status generally conditional upon obtaining a study visa.
13UQ institutions are increasingly encouraging and supporting (synchronous22, asynchronous23, mixed 24,
comodal)25 or hybrid26, distance education (DLE), in particular through efforts to support access to digital
and technological tools. It is important to note that the institutional data from the network’s institutions
(PRISME, UQ) and, consequently, the data transmitted to MEES (GDEU system) do not, for the time being,
allow for a complete inventory of DLE activities27. It is also very likely that the 2020-2021 situation related
to the COVID-19 pandemic will modify future data and analyses regarding the place of DLE in the UQ
network.
That being said, according to the sources consulted (Bonin and Girard, 2017; ICOPE Survey, 2016),
compared with the graduate student population exclusively attending classes, the 10% of graduate
students with at least one distance education course28 have a higher rate of enrolment in part-time studies
(64% versus 36%) and are more likely to be employed (74% versus 61%), with a higher proportion working
more than 30 hours per week (69% versus 43%). This population also experienced more interruptions
from previous studies (44% versus 35%); these students enter higher education on average at an older
age (36 versus 31) and assume parental responsibilities more frequently (50% versus 26%).
Graduate student population at a glance
The section above has highlighted the main characteristics of graduate students in the UQ network.
Highlights of this section are illustrated in Figure 7. Given these dominant population characteristics, a
number of committees and organizations internal and external to the institutions and the UQ network are
already asking pertinent questions about university success according to the different student profiles.
From an inclusive perspective, this third section aims to present factors that promote success across all
student profiles.
22. “Synchronous online teaching (telepresence) is based on multimedia training systems that reproduce the face-to-face
teaching model where the teacher is in direct media contact in real time with the learners” (Sauvé, Villardier and Prost, 2008,
p. 69).
23. “Asynchronous e-learning is built using e-learning platforms that allow all the resources needed to achieve learning objectives
or develop competencies to be indexed and made available in one place” (Sauvé et al., 2008, p. 69).
24. “When both synchronous and asynchronous web technologies are integrated into online learning environments, the
concept of blended online learning becomes established” (Sauvé et al., 2008, p. 70).
25. Courses or training offered both in classrooms and remotely (usually synchronous).
26. Alternating of classroom and distance instruction (synchronous or asynchronous).
27. “In the institutional data, the Distance Education Indicator (DEI) is at the level of individual teaching activities rather than at
the program or student level. Only autonomous distance learning activities, of the asynchronous type, which do not require
a specific training space, are thus identified. This indicator, reported to the GDEU system of the Ministère de l’Éducation et
de l’Enseignement supérieur (MEES), was designed to calculate space financing. It only allows us to identify a portion of
distance learning activities” (Bonin, 2018, p. 4). It should be noted that improvements to the student reporting system are
planned for 2020-2021, with a view to also collecting information on synchronous training activities. Despite these
adjustments, since the results of this survey are based on respondents (and not on the entire population), it is not possible to
obtain a total number of people in this situation, but rather the proportion of people who are in graduate distance education.
28. The statistics in this section exclude TÉLUQ, since all of the institution’s courses are distance education. Consequently, except
for TÉLUQ, whose entire student population is enrolled in distance education, at the graduate level, ENAP is the network
institution with the largest proportion of students taking at least one DLE course (38%). UQAT ranks second, with a proportion
of 25%. Next come UQAC, UQTR and UQAR, each with a proportion of 10% (Bonin, 2018).
1456% women
• 56% of the student population consists of women, although this proportion decreases as the level of education
increases;
54% part time
• the registration status of the student population (excluding international students and permanent residents) is
predominantly part time (54%);
27% in a non-degree program
• more than a quarter (27%) of students are in a non-graduate program (other than master’s or doctoral programs);
80% over 25 when they start their graduate studies
• Eight out of ten people beginning master’s studies are 25 or older;
34 and 36 years old on average at the master’s and doctoral levels
• The average age of the UQ student population is 34 at the master’s level and 36 at the doctoral level;
45% FGUSs
• 45% of the student population is composed of first-generation university students (FGUSs);
7% students with disabilities or with emerging disabilities
• 7% of the student population self-declare themselves to be disabled, 80% with an emerging disability;
2% members of Indigenous peoples
• 2% of the student population self-identify as Indigenous;
26% international students
• More than a quarter of the graduate population (26%) now consists of international students, with a more
traditional study profile;
7% permanent residents
• Permanent residents represent 7% of the total student population;
36% in a precarious financial situation
• 36% of students consider themselves to be in a precarious financial situation;
30% with at least one dependent child
• Close to 30% of the population has at least one child in its care;
75% employed
• Nearly three-quarters of students who are parents are employed; the majority of them full time;
10% in distance education
• 10% of the student population take at least one distance education course.
Figure 8. Summary of population characteristics of graduate students in the UQ network
153. Success at university
Changes in student and faculty numbers, the rapid development of knowledge and social competition for
material, human and financial resources (Halse and Malfoy, 2010; Lessard, 2007, in Denis and Lison, 2016)
certainly accelerate the transformation of the university environment. As a result, scientific and social
expectations regarding the production, dissemination and access to or mastery of high-level skills and
competencies are increasing.
A recent review of the literature has identified a significant range of empirical studies that attempt to
explain, in this context, the various factors that contribute to university student success. In addition, a
limited number of studies have taken a detailed look at the determinants of success specific to graduate
populations (Litalien and Guay, 2015). Despite this limitation, this section provides an overview of how
the scientific literature explains the phenomenon of success and identifies the main influencing factors
that promote the completion of graduate studies.
Perseverance and success, a process
Success at university has long been explained in the literature by the concepts of efficiency and
graduation. The CSÉ report (2000)29 expresses a perspective that is becoming increasingly prevalent in
research: graduation is no longer enough to explain success. Gradually, a systemic perspective has
emerged (CSÉ, 2019). Currently, the dominant viewpoint allows us to explain the success of university
studies as a non-linear path, an educational path modulated by personal and academic experiences that
influence whether a course of study is pursued (Government of Quebec, 2017). Successful completion
includes “getting a degree or qualification; attaining a training objective; advancing in a personal or
professional path; enrolling in another education or training sector” (Government of Quebec, 2017, p. 18).
Successful completion of university education is “a direction,” not just a goal
(CSÉ, 2019).
Complementary to the concept of success, Monfette (2016) explains that perseverance refers to the result
of a sustained, multivariable phenomenon of complex interactions between learners, the environment
and the education system. Although according to the author, certain elements of definition reflect the
literature – a dynamic, interactive process, “the ability to pursue one’s goal,” “the importance of taking
into account the path to reach the goal, despite the obstacles encountered (Duckworth et al., 2007;
Rothermund, 2003; Stailescu, 2011; Tinto, 1975)” (p. 116) – Monfette points out a lack of consensus on
the definition of postsecondary perseverance (Bélair and Lebel, 2007; Lison et al., 2011; Mukamurera,
2014).
Success is understood as a multifactorial process of perseverance
(CSÉ, 2019) that is transitive, progressive, and influenced by many parameters.
29. The aim of this report was to better understand the complexity of academic success and to take into account so-called non-
traditional populations for whom the definition of success in terms of effectiveness cannot be applied.
16Studies on perseverance and success pay particular attention to the steps in the students’ trajectory at
university (first contact with those responsible for recruitment, enrolment, beginning of studies, transition
to graduate studies, graduation, professional integration, etc.) (CSÉ, 2000; Robert et al., 2016; Roberts,
2018). The process of success is thus marked by multiple interacting factors that, combined with each
other and intervening according to the university path, shape the probability of entering university,
completing training and obtaining a degree with a view to imminent and generally desired
socioprofessional integration (Robert et al., 2016). It is no longer a question of treating the factors
separately in order to see their impact on the student. Current research delves into the interactivity of
factors and the potential impact they may have on each other and, ultimately, on the student experience
(Sverdlik et al., 2018).
Every stage of university studies is marked by a plurality of individual and contextual
determinants (De Clercq, 2019) that are interrelated (Vasseur, 2015), act systemically
(CSÉ, 2019) and complement each other.
Finally, according to several sources (CSÉ, 2000; Kljajic et al., 2017; Larose et al., 2011; Philion et al., 2016),
success at university also depends on the student’s representation or perspective of success rather than
the standards of success imposed by social or academic norms. Consequently, well before university
requirements or graduation, it is the meaning that the student gives to the very concept of success that
counts, in terms of their perspective, sociohistorical path and academic experiences, and of meeting their
own standards of success (CSÉ, 2000).
A brief history of research concerns in terms of academic
success
In the 1980s, the dominant paradigm in education focussed on the quality of learning and the
measurement of academic performance. Research focussed on what motivates university students to
continue their studies and what influences their adaptation (Demal, 1989; Gossuin and Devoet, 1984,
cited by Pirot and De Ketele, 2000). Research was also interested in the determinants of success related
to the transient experience in the university environment (Gossuin and Devoet, 1985). In the 1990s and
2000s, the mainstream understanding supported the fundamental value of social determinants (the
family, sociohistorical, cultural, or economic context) and individual determinants (affective, cognitive,
and psychological aspects) on the success of higher education. In terms of endogenous characteristics,
the research then recognized the inseparable nature of the university student’s experience and the aims
of their studies (Pirot and De Ketele, 2000). Perseverance was also increasingly observed in terms of
individual determinants (Romainville, 2000; Sauvé, Racette et al., 2008), particularly with respect to
student perception and the relationship to their studies (CSÉ, 2000). Consistently, in the 2000s, there was
growing interest in what influences the psychological health of students and their needs in terms of
cognitive and psychological support (Direction de la recherche institutionnelle (DRI), 2012). A great deal
of research has been conducted on the mental well-being of university students, their main stressors, the
interventions to be promoted according to their career paths and specific needs, etc. (Comité interordres,
2013; Daigle et al., 2019; Marcellini, 2017; Martineau et al., 2017; Philion et al., 2016).
17You can also read