LITERACY IN CROATIA COUNTRY REPORT CHILDREN, ADOLESCENTS AND ADULTS - ORBi
←
→
Page content transcription
If your browser does not render page correctly, please read the page content below
LITERACY IN
CROATIA
COUNTRY REPORT
CHILDREN, ADOLESCENTS AND
ADULTS

                                                               March 2016

     This project has been funded with support from the European Commission.
     This publication reflects the views of its authors only, and the Commission cannot be held
     responsible for any use which may be made of the information contained herein.
This document has been published by the European Literacy Policy Network (ELINET).

The report was completed in 2016.

The contents of this publication may be reproduced in part, except for commercial purposes, provided
the extract is preceded by a reference to “Elinet”, followed by the date of publication of the document.

Main authors (in alphabetical order):

Drahomira Cupar, Kristina Čunović, Christine Garbe, Dominique Lafontaine, David Mallows, Marija
Radonić, Gerry Shiel, Renate Valtin

Contributing authors (in alphabetical order):

Agency for Vocational Education and Training and Adult Education, Ana Arqueiro, Valeria Balbinot,
Ariane Baye, Juliana Cunha, Maria Lourdes Trindade Dionísio, Claudia Fischer, Stéphanie Géron, Ivana
Faletar Horvatić, Martina Ivanović, Srećko Jelušić, Mate Juric, Eithne Kennedy, Maija Koikkalainen, Maria
Kovacs, Gudmundur Kristmundsson, Dominique Lafontaine, Gina Lemos, Heikki Lyytinen, George
Manolitsis, Carmen González Martí, Fabio Nascimbeni, Franziska Pitschke, Helin Puksand, Davorka
Semenić Premec, Marija Radonić, Alka Stropnik, Sari Sulkunen, Eufimia Tafa, Giorgio Tamburlini, Anne
Uusen, Ariana-Stanca Văcăreţu, Corina Volcinschi, Christina Wagner, Esther Wiesner

Coordinator of the ELINET-Project:

University of Cologne

Prof. Dr. Christine Garbe
Institut für Deutsche Sprache und Literatur

Richard-Strauss-Str. 2
50931 Köln – Cologne
Germany

                                                                                                       2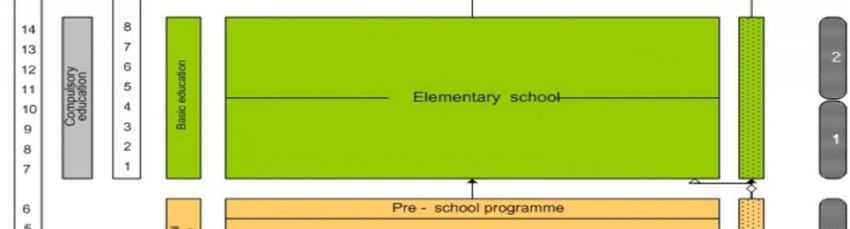
christine.garbe@uni-koeln.de

                               3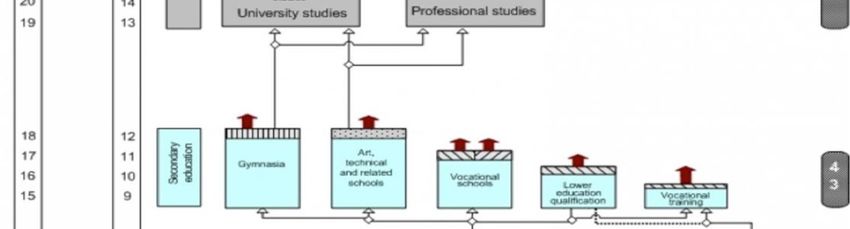
TABLE OF CONTENTS
1      Introduction.......................................................................................................................................................................... 6

2      Executive Summary .......................................................................................................................................................... 7

3      General Information on the Croatian Education System ........................................................................... 17

CHILDREN AND ADOLESCENTS ........................................................................................................................................ 19

4      Literacy Performance Data for Children and Adolescents ........................................................................ 20

    4.1         Performance Data for Children and Adolescents ...................................................................................... 20

       4.1.1             Performance and variation in reading: proportion of low and
                         high performing readers............................................................................................................................ 20

       4.1.2             Gaps in reading ............................................................................................................................................. 21

    4.2         Performance Data for Adolescents.................................................................................................................. 24

       4.2.1             Performance and variation in reading; proportion of low and
                         high performing readers............................................................................................................................ 24

       4.2.2             Gaps in reading performance (PISA 2009) ......................................................................................... 26

5      Policy areas ........................................................................................................................................................................ 30

    5.1         Creating a literate environment for children and adolescents ............................................................. 30

       5.1.1             Providing a literate environment at home ......................................................................................... 31

       5.1.2             Providing a literate environment in school ........................................................................................ 34

       5.1.3             Providing a digital environment ............................................................................................................. 34

       5.1.4             The role of public libraries in reading promotion ........................................................................... 35

       5.1.5             Improving literate environments for children and adolescents:
                         Programmes, initiatives and examples ................................................................................................ 36

    5.2         Improving the quality of teaching ................................................................................................................... 39

       5.2.1             Quality of preschool .................................................................................................................................... 39

       5.2.2             Literacy curricula in schools ..................................................................................................................... 41

       5.2.3             Reading Instruction ..................................................................................................................................... 44

       5.2.4             Early identification of and support for struggling literacy learners.......................................... 47

       5.2.5             Initial Teacher Education (ITE) and Continuous Professional
                         Development (CPD) of Teachers ............................................................................................................ 50

       5.2.6             Digital literacy as part of initial teacher education ......................................................................... 53

       5.2.7             Improving the quality of literacy teaching for children and adolescents:
                         Programmes, initiatives and examples ................................................................................................ 54

    5.3         Increasing participation, inclusion and equity ............................................................................................ 54

                                                                                                                                                                                            4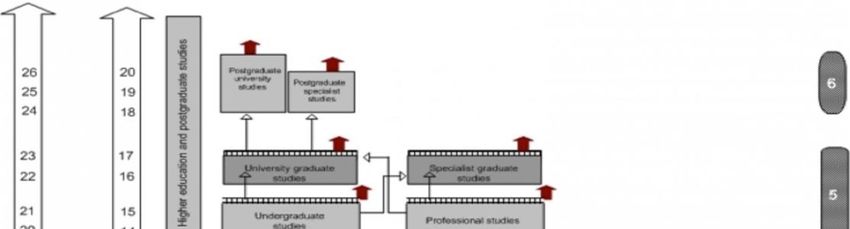
5.3.1              Compensating socio-economic and cultural background factors............................................ 55

         5.3.2              Support for children with special needs.............................................................................................. 57

         5.3.3              Promoting preschool attendance, especially among disadvantaged children .................... 57

         5.3.4              Provisions for children with language problems ............................................................................. 58

         5.3.5              Support for children and adolescents whose home language is
                            not the language of school ...................................................................................................................... 59

         5.3.6              Preventing early school leaving .............................................................................................................. 60

         5.3.7              Addressing the gender gap among adolescents............................................................................. 61

         5.3.8              Increasing participation, inclusion and equity for children and adolescents:
                            Programmes, initiatives and examples ................................................................................................ 61

ADULTS .......................................................................................................................................................................................... 63

6        Performance data for adults in literacy .............................................................................................................. 64

7        Adult Literacy Policy ..................................................................................................................................................... 65

    7.1           Provision..................................................................................................................................................................... 65

    7.2           Quality Monitoring................................................................................................................................................. 67

    7.3           Literacy Curricula/Reading Instruction ........................................................................................................... 67

    7.4           Screenings/Assessments/Support.................................................................................................................... 68

    7.5           Special Support for Second-Language Learners/Migrants .................................................................... 68

    7.6           Reading Motivation ............................................................................................................................................... 69

    7.7           Digital Environments/Use of Technology in Education ........................................................................... 69

    7.8           Teachers ..................................................................................................................................................................... 70

    7.9           Teacher Education .................................................................................................................................................. 70

    7.10          Policy-Making .......................................................................................................................................................... 71

    7.11          Lifelong learning ..................................................................................................................................................... 71

8        References .......................................................................................................................................................................... 73

                                                                                                                                                                                                 5
1 Introduction
This report on the state of literacy in Croatia is one of a series produced in 2015 and 2016 by ELINET,
the European Literacy Policy Network. ELINET was founded in February 2014 and has 78 partner
organisations in 28 European countries1. ELINET aims to improve literacy policies in its member
countries in order to reduce the number of children, young people and adults with low literacy skills.
One major tool to achieve this aim is to produce a set of reliable, up-to-date and comprehensive
reports on the state of literacy in each country where ELINET has one or more partners, and to provide
guidance towards improving literacy policies in those countries. The reports are based (wherever
possible) on available, internationally comparable performance data, as well as reliable national data
provided (and translated) by our partners.
ELINET continues the work of the European Union High Level Group of Experts on Literacy (HLG) which
was established by the European Commission in January 2011 and reported in September 20122. All
country reports produced by ELINET use a common theoretical framework which is described here:
“ELINET Country Reports – Frame of Reference”3.
The Country Reports are organised around the three recommendations of the HLG´s literacy report:
· Creating a literate environment
· Improving the quality of teaching
· Increasing participation, inclusion (and equity4).
Within its two-year funding period ELINET has completed Literacy Country Reports for all 30 ELINET
member countries. In most cases we published separate Long Reports for specific age groups
(Children / Adolescents and Adults), in some cases comprehensive reports covering all age groups.
Additionally, for all 30 countries, we published Short Reports covering all age groups, containing the
summary of performance data and policy messages of the Long Reports. These reports are
accompanied by a collection of good practice examples which cover all age groups and policy areas as
well. These examples refer to the European Framework of Good Practice in Raising Literacy Levels;
both are to be found in the section “Good Practice”5.
1
For more information about the network and its activities see: www.eli-net.eu.
2
In the following, the final report of the EU High Level Group of Experts on Literacy is referenced as “HLG report”.
This report can be downloaded under the following link: http://ec.europa.eu/education/policy/school/doc/
literacy-report_en.pdf.
3
See: http://www.eli-net.eu/research/country-reports/.
4
"Equity" was added by ELINET.
5
See: http://www.eli-net.eu/good-practice/.
62 Executive Summary
LITERACY PERFORMANCE DATA
Croatia participated in IEA’s PIRLS (4th graders reading comprehension) in 2011, and in OECD’s PISA
(15 year-olds’ reading literacy) in 2009 and 2012. This means it is possible to describe the change over
time in average reading proficiency, according to different characteristics of the readers, only for 15
years-old students, and to compare relative reading levels of proficiencies for different age groups.
Croatia took part in PIRLS 2011 only, no trends can be reported for 4th graders.
In PISA 2012, Croatia performed just below the EU average (485 vs 489 EU average), a somewhat
higher performance than at the previous cycle (+ 9 points).
The proportion of pupils who can be considered as low-performing readers was close to the EU
average (18.7% vs 19.7%). These students can read simple texts, retrieve explicit information, or make
straightforward inferences, but they are not able to deal with longer or more complex texts, and are
unable to interpret beyond what is explicitly stated in the text. The proportion of low-performing
readers has decreased between 2009 and 2011 (by almost 3%). The proportion of top-performing
readers was 4.4%, lower than in EU countries on average (7%).
In PISA 2009, the gap according to the pupils’ socioeconomic background was lower than the EU
average (73 vs 89 on average). The gap between native students and students with a migrant
background was higher than in EU countries on average (18 vs 38 EU-average), although the
distribution was nearly equivalent. The mean score difference between those who always spoke the
test language and those who spoke another language was just below the EU-26 on average (52 vs 54).
It should be underlined that the number of students who spoke another language was 1.5% in Croatia
(vs 13.3 % on EU average).
In Croatia, the gender gap (in favour of girls) was higher than the corresponding EU average difference
(51 vs 44 on EU average), namely more than one year of schooling. It remained nearly unchanged
between 2009 and 2012: the girls’ performance increasing by 6 score points, boys’ by 9.
In conclusion, Croatia has slightly increased its performance in reading between 2009 and 2012 among
15 year-olds. Nevertheless, it remains just below the EU average. Croatia has a proportion of low-
performing readers close to the EU countries on average. The data point to a low percentage of top
performers, below the EU average. The spread of achievement (gap between low and top performing
readers) is lower than in the EU on average. The gap according to the gender is higher than on EU
average in both studies. The gap according to socioeconomic status is very much higher in PIRLS and
very much higher in PISA. The gap according to migration or language spoken at home was lower than
in EU on average at both levels.
In PIRLS 2011, Croatia performed above the EU’s average (553 vs 535) and the proportion of low-
performing readers was limited (10% only vs 20% in EU). The spread in achievement between top and
low performers was lower than the EU-24 average difference (154 vs 177). The gender gap with 14
points difference was higher than the EU average with 12. In Croatia, fewer students had parents
whose highest level of educational attainment was university or higher (18%) than on average across
the EU-21 (30%), while fewer had parents whose highest level was lower secondary or below (Croatia:
7%; EU-24: 18%). Pupils in Croatia whose parents attained a University degree or higher had a mean
7score (590) some 69 points higher than students whose parents completed lower secondary or below
(521). The average difference across the EU-24 countries was 76, indicating a slightly weaker
relationship between parent’s educational achievement and students' reading achievement in Croatia,
which is coherent with what was observed among 15 year-olds The educational system seems
somewhat more equitable in Croatia than in European countries on average.
The causes of PISA and PIRLS results was never openly discussed in public in Croatian, but they
however encouraged the Ministry of Culture of the Republic of Croatia to draft the National Strategy
for the promotion of reading. The Strategy was developed in 2015 but has not yet been accepted by
the Government.
There is a need for programmes for raising awareness among all parents that literacy is a key to
learning and it gives more opportunities and more secure jobs. In Croatia, there have been several
national campaigns and programmes for raising literacy awareness (national campaign Read to me!,
Croatian Book Month, Books for Babies, photo-contest Smile... While Reading, Ow(l)etter party , Reach
for the Stars through Reading, Interliber...).
Croatia did not take part in the Program for the International Assessment of Adult Competencies
(PIAAC) and information about literacy among adults is provided by The Ministry of Science, Education
and Sports of the Republic of Croatia, The Croatian Agency for Vocational Education and Training and
Adult Education, and The Croatian Bureau of Statistics. In Croatia, primary education is compulsory and
free. However, 62,092 citizens aged 15 or older did not finish primary school, 3% of whom did not have
any education.
8KEY LITERACY POLICY AREAS FOR DEVELOPMENT
(AGE-SPECIFIC AND ACROSS AGE-GROUPS)
Creating a Literate Environment
Pre-Primary Years
Parents play a central role in children’s emergent literacy development. They are the first teachers, and
shape children’s language and communication abilities and attitudes to reading by being good
reading role models, providing reading materials, and reading to the child. Compared to the European
average, many pupils in Croatia have parents with positive attitudes towards reading, as PIRLS 2011
data show. Parents engage often or at least sometimes in literacy related activities with their children.
Since reading to the child is a predictor of future literacy achievement it is a matter of concern that
23% of parents of six-month-old children in Croatia do not read or look at picture-books with their
babies, and that reading together does not count among the daily habits of 9 % of the parents of one-
year-old children, 7 % of the parents of three-year-old children and 14 % of the parents of six-year-old
children. (UNICEF, 2012.)
Strengthen and support libraries: The most successful programs and projects are perceived by
librarians and implemented in the libraries such as Read to me!, the first Croatian national campaign
promoting reading aloud to children from the earliest age (National campaign “Read to me!”, 2013), or
projects such as Books for Babies by the Public library of Koprivnica “Fran Galović”, which comprises of
packages given to every newborn in Koprivnica hospital (Knjižnica i čitaonica “Fran Galović” Koprivnica.
Knjige za bebe). But a great obstacle to accessing reading and literacy programmes in public libraries
is the annual membership fee. There is a need for free public libraries in Croatia so that libraries are
available to all.
More family literacy programs needed: There is a need for programmes to raise awareness of all
parents that literacy is a key to learning. In Croatia, there are a number of projects that serve as
examples of “best practices” but they are often isolated and rarely have positive, systemic effects on
literacy.
Primary Children and Adolescents
Schools play an important role in offering a literate environment for students. Schools may foster
reading motivation and reading for pleasure by establishing school and classroom libraries, offering a
wide variety of books and other reading material in different genres, providing sheltered and
comfortable spaces for individual reading activities.
Providing a literate environment in school: Based on data provided by their teachers, PIRLS 2011
shows that 51.2% of students in Croatia are in classrooms which have class libraries – below the
corresponding EU-24 average of 73%. In Croatia, 9.6% of students are in classrooms whose teachers
report that the students use computers to write stories or other texts at least monthly, compared to
the EU-average of 33%.
9Supporting reading motivation and reduce gaps in literacy: In all PISA studies, 15-year-old girls
outperformed boys in reading in all the European countries, and boys are frequently overrepresented
among the low performers. Not only children from culturally disadvantaged families are “at risk” in
their literacy development but also those with “special educational needs”.
Strengthening the role of public libraries in reading promotion: There are Croatian libraries with
excellent infrastructure and innovative services currently supported by the latest technology, but there
are also libraries that do not have even the most basic equipment for their core operations. Croatian
libraries in poorer places are not systematically funded, which results in insufficient infrastructure and
reduced services.
Take advantage of opportunities of school libraries and librarians: In the Croatian educational
system, the school library has highly educated school librarians with, in many cases, the widest and the
longest education from all of the employees in their school. At this moment Croatian school libraries
have the strongest potential for the change of educational system, although they are still inadequately
recognised.
Improving literate environments for children and adolescents: Programmes, initiatives and
examples: Programmes such as The Croatian Book Month and Book Night are organised at national
level and they are already very popular among children and adolescents. Ow(l)etter party is a national
campaign to popularise reading with primary and secondary school pupils, help pupils to develop a
positive attitude towards reading, and raise their self-esteem (Hrvatska udruga školskih knjižničara.
Tulum slova [project]). Many schools have developed projects in cooperation as CARNet - Croatian
Academic and Research Network provides cheaper Internet access in school, but also at home, by
providing pupils with an AAI@Edu.hr electronic identity. With their AAI@Edu.hr electronic identity,
pupils can ensure cheaper Internet access at home and can also use it to access digital databases such
as eReadings (CARNet. eLektire).
Adults
Croatia did not take part in the Program for the International Assessment of Adult Competencies
(PIAAC) but data can be obtained from different sources: The Croatian Agency for Vocational
Education and Training and Adult Education, the Croatian Bureau of Statistics, Official Gazette.
According to the law, a person is adult at the age of 15. The education of adults in Croatia is accepted
as an integral part of a unique educational system according to the Law on educating Adults which
was passed in 2007 as a precaution according to The Strategy for Adult Education from the year 2004.
Participation of adults in learning is low in Croatia but positive developments are visible. In 2003, the
Government of the Republic of Croatia adopted a ten-year project on literacy for adults "For a Literate
Croatia a Path to a Desirable Future", in accordance with the framework of the UN Resolution "Decade
of Literacy 2003-2012". The Government allocated considerable funds for primary adult education.
Fostering literacy provision for adults: Although the Government of the Republic of Croatia in 2003
adopted a ten-year project on literacy for adults “For a Literate Croatia a Path to a Desirable Future”,
there is still need to correct the implementation of the project:
· lack of campaign that would provide necessary information to the public
· modified curriculum, textbooks and other learning materials, teachers with an andragogic
knowledge or skills for adult education
10Improving the Quality of Teaching
Pre-Primary Years
Investing more money in Early Childhood Education and Care (ECEC): According to Eurostat (2014,
Figure D3), the total public expenditure per child in pre-primary education as a percentage of GDP in
Croatia is 0.5% (the range is from 0.04% in Turkey and 0.1% in Ireland to 1.01% in Denmark).
Raising the professional qualification level of staff in ECEC: In many European countries, teachers
in kindergarten have a lower level of qualification regarding the minimum required level to become a
qualified teacher. In Croatia, the minimum required level to become a qualified teacher is Bachelor
level (ISCED 5), length of study is 3 years.
Introducing comprehensive literacy curricula in pre-primary schools: In preschool, children can be
prepared for formal instruction in school. In Croatia, one of the particular goals that the curriculum sets
for preschool education refers to children’s involvement in educational activities that motivate and
help children to use various means of communication and expression (speech, vocabulary enrichment,
visual arts expression, musical expression) (Vican, Rakić, & Milanović Litre, 2007 p. 16).
Primary Children and Adolescents
Ensuring adequate time for language and literacy instruction in primary and secondary schools:
According to PIRLS 2011, in Croatia, students spend 46 instructional hours per year on reading as part
of language, compared with an EU-24 average of 68, though the EU-24 average is itself low. Teachers
in Croatia report allocating less time to teaching reading across the curriculum and in reading classes
(116 instructional hours per year) than on average across EU-24 countries (147 hours).
Building a stronger focus on literacy into curricula: Croatia does not have a separate curriculum for
reading and writing (Mullis et al. 2012, Vol.1, exhibit 5, p. 31). Reading is a part of the national
language curriculum that also includes writing and other communication skills. There is a need to
mainstream reading / writing literacy across the curriculum and integrate literacy skills across subjects.
Ensuring screenings to identify struggling readers: While Croatia is identified as having goals and
standards in the curriculum for each grade at primary level, it is not clear how these inform assessment
of student performance or the identification of reading difficulties (Mullis et al. (Exhibit 7, 2012). There
is a need to establish minimal standards of literacy achievement (benchmarks) for each grade, and to
administer regular tests based on these standards, to allow for identification of struggling
readers/writers and learners in order to systematically support them, allocating attention and resources
accordingly, targeting low performing schools - in need of additional funding and resources - as well
as low performing students within schools. Assessments therefore need to be closely linked with
support programmes and adequate qualifications of teachers and specialists.
Supporting struggling literacy learners: Schools should provide support systems (additional
instruction time, additional experts like reading experts, psychologists, speech therapists) for students
falling behind in reading.
Improving the quality of teacher training: PIRLS 2011 provides information about additional staff
and availability of support persons for reading. Based on teacher responses, 22% of students in Croatia
are in classes where there is always access to specialised professionals to work with students who have
11reading difficulties, compared with an EU-24 average of 25%. Nineteen percent of students in Croatia
are in classrooms where there is access to a teacher aide with the same frequency, while 7% are in
classrooms where there is access to an adult/parent volunteer. Corresponding EU-24 averages are 13%
and 3%. Hence, teachers in Croatia have marginally less access to specialised professionals, somewhat
greater access to teacher aides, and adult volunteers as on average across the EU-24, where full
availability is concerned. There are no compulsory courses for teachers, but all teachers have to attend
certain number of courses organised by the Croatian Education and Teacher Training Agency during
one school year, and some of the offered courses focus on literacy development.
Improving the quality of literacy instruction: Programmes, initiatives and examples: As a result of
ongoing reforms, Croatian policy makers have taken promising steps to strengthen literacy
performance. Namely, in 2015, an expert group for implementing Comprehensive Curricular Reform
for early and pre-school, primary and secondary education started their work (Cjelovita kurikularna
reforma, 2015). The curricular reform will focus on increasing functional literacy levels of students. The
reform includes drafting curricular documents, establishing a system for evaluation, assessment and
reporting, training of teachers and other staff and preparing new manuals, textbooks, auxiliary
teaching resources and digital content. The results of research carried out in Croatian schools has
shown that our school children aged 6-10 achieved above-average results, but later as teenagers, they
achieved below-average results at all three levels of literacy (natural, mathematical, reading) according
to the PISA studies. Statistically, Croatian average 15 years old students know how to count in different
mathematical operations, but it seems to be difficult for them to apply those operations to tasks that
simulate life situations. This school reform, comprehensive and highly professional, will focus on
developing basic competences for lifelong learning.
Adults
Improving the curricula for adult literacy: The national curricula for adult literacy consists of six
terms, each lasting 18 weeks. Within the project on literacy for adults “For a Literate Croatia a Path to a
Desirable Future”, apart from being given an opportunity to finish primary school, the participants will
also be given an opportunity to complete vocational training, required for less complicated jobs in the
labour market.
It is not possible to identify an explicit focus on literacy in VET provision. It is possible that there are
different literacy elements in VET teaching practices; however, this content is dependent on the
individual provider and trainer. Adult literacy provision in Croatia has a focus on addressing literacy
needs in the workplace.
Improving the qualification and status of teachers of adult literacy: In Croatia, it is not possible to
report on adult literacy teachers as a profession. Adult education teachers usually come from regular
schools so their qualifications are the same as those in the regular system. They are paid by the hour
and the amount depends on the agreement with the employer. It is necessary to start and develop a
professional adult literacy workforce.
12Increasing Participation, Inclusion and Equity
The High Level Group of Experts on Literacy drew attention to persistent gaps in literacy, namely the
gender gap, the socio-economic gap, and the migrant gap (HLG Final report 2012, pp. 46–50). These
gaps derive from the reading literacy studies that repeatedly show unequal distribution of results
among groups of children and adolescents (PIRLS, PISA).
Performance gaps in Croatia and on average across the EU-24 are shown in Figures 1 and 2.
Students in Croatia whose parent completed University or Higher achieved a mean score (590) that
was some 69 points higher than students whose parents completed Lower Secondary or below (521).
The average difference across the EU-24 is 76 points, indicating a broadly similar relationship between
parents' educational level and performance in Croatia. In Croatia, the gap in reading performance
according to the students’ socioeconomic background is lower than in the EU countries on average.
Girls in Croatia achieved a mean score on overall reading (560) that was higher than boys' (546) by 14
points in 2011. This was about the same as the EU-24 average difference of 12 points. The gap in
performance between students who always speak the language of the PIRLS test at home and those
that hardly ever or never do so is small in Croatia.
Figure 1: Performance Gaps – Gender, Parent Education and Language Spoken at Home
PIRLS 2011 - Performance Gaps
Croatia & EU-24
80 76
69
60
Score Points
40
26
20 14 12
5
0
Parent Education Home Language Gender
Croatia EU-24
Gender: girls – boys Education: University vs. Lower Secondary/Primary education; Language: Student speaks
language of the tests at home always vs. sometimes/never.
The performance in reading among Croatian students increased by 9 points between 2009 and 2012,
though the increase was not statistically significant. In Croatia, the gap in reading performance
according to the students’ socioeconomic background is lower than in the EU countries on average.
The gap between native students and those with an immigrant background is much smaller in Croatia
than in EU countries on average.
The gap between students speaking the test language at home and those who do not (1.5 % of the
students) is close to (52 score points) the EU’s average. It is equivalent to more than a year of
schooling.
13However, the percentage of students who do not speak the test language at home (1.5%) is so low
that this result has to be taken with a lot of caution.
In Croatia, between 2009 and 2012, the girls’ performance increased by 6 score points while the boys’
increased by 9 (Table 17). The trend is similar to the EU countries on average in the same period: the
girls’ and boys' performance increased respectively by 4 score points.
Figure 2: Performance Gaps in Croatia and on Average across EU Countries - Post-Primary Level
PISA 2009/2012 - Performance Gaps
Croatia & EU-Avg
100 89
80 73
Score Points
60 52 54 51
44
38
40
18
20
0
S.E.S. Migration Home Gender
Language*
Croatia EU-Avg
SES: Top – Bottom quartile on PISA ESCS scale; Migration: Native – first/second generation immigrants; Language:
Speaks language of the PISA test at home – speaks another language; Gender: Girls - Boys
Pre-Primary Years
Compensating socio-economic and cultural background factors: About 10 per cent of children
under the age of 14 live in poor households, the most vulnerable among them being Roma. The
vulnerability of this group continues in spite of the participation of Croatia in the intergovernmental
initiative Decade of Roma Inclusion (2005-2015). Despite the fact that Croatia offers good overall social
protection coverage, new policies are needed to strengthen social recovery. The development, analysis
and monitoring of such policies are hampered by inadequate data disaggregated by sex, age and
social groups, and by insufficient monitoring of child poverty. (UNICEF 2011. Country programme
document 2012 -2016 for Croatia).
Increasing pre-school attendance of disadvantaged children: According to European
Commission/EACEA/Eurydice/Eurostat (2014, Figure C1 p.62), the enrolment rate at age 4 is 70.6%.
Croatia does not yet reach the European benchmark of at least 95% of children between age 4 and the
start of compulsory education participating in ECEC. The benefit of preschool attendance in Croatia is
proven by the fact that there is a significant difference in reading competence at grade 4: the reading
score of pupils who attended pre-primary education for 3 years and more was 27 points higher than
that of pupils who did not attend at all.
No child should be excluded from preschool because parents cannot afford to send their children to
preschool/kindergarten institutions if they have to pay. While in half of the European countries the
entire period of ECEC is free, in Croatia pre-primary education is not always free. In most - but not all –
cases, parents participate in the costs of pre-primary education through fees (EURYDICE, 2013).
14The Republic of Croatia has a regulated education system for children with developmental difficulties
from an early, pre-school age, which is important for early intervention and inclusion in the suitable
pre-school and rehabilitation programmes. But still, UNICEF reports that integration of children with
developmental difficulties and disabilities in the regular education system continues to be a challenge
because insufficient support is given to education for such children in the form of access, transport
and teaching assistants (UNICEF 2011. Country programme document 2012 -2016 for Croatia).
Primary Children and Adolescents
In Croatia, fewer students had parents whose highest level of educational attainment was university or
higher (18%) than on average across the EU-21 (30%), while fewer had parents whose highest level was
lower secondary or below (Croatia: 7%; EU-24: 18%). Pupils in Croatia whose parents attained a
university degree or higher had a mean score (590) some 69 points higher than students whose
parents completed lower secondary or below (521). The average difference across the EU-24 countries
was 76, indicating a slightly weaker relationship between parents' educational achievement and
students' reading achievement in Croatia, which is coherent with what was observed among 15 year-
olds.
Preventing early school leaving: The provision of secondary education for all adolescents and the
prevention of early school leaving may serve as indicators for the opportunities of adolescents to
improve their literacy performance, especially related to basic functional literacy. According to
Eurostat, in Croatia, the rate of early school leavers was 3.7 % in 2013. The target value of the early
school leaving (ESL) rate set for 2020 is 4.0% (European Commission, 2013). According to Eurostat, in
2011, the percentage of 18-year olds in education was 66.9%, which situated Croatia well under the
EU-27 average (80.7%). By 2012, this indicator increased to 68.1%.
According to the National Reform Programme of the Republic of Croatia, adopted on 24th April 2014,
in order to prevent early school leaving, a number of measures have been envisaged, such as
(co)funding of textbooks for elementary and high school students who live in poor socio-economic
conditions, (co-)funding of textbooks for blind high school students, (co-)funding of transportation for
elementary and high school students who live in poor socio-economic conditions, and funding of
continuing education for students who have completed the two-year and three-year vocational
programmes to ensure vertical mobility (National Reform Programme, 2014). There are plans to extend
compulsory education beyond the elementary school, but for now, this has not happened.
Devolve responsibility/decision making to schools: All Croatian policy/strategy papers promote the
idea of decentralisation and deregulation as such, but do not explicitly and consistently deal with these
processes, leaving the issue of decision-making largely undefined. A direct top-down control still
prevails in the government-school relations, especially in the area of curriculum development. it is
necessary to stress the importance of defining relations between the national (framework) and the
school-based (applied) curriculum.
Adults
According to national law, migrants have the right to learn the Croatian Language for free. Provision is
the responsibility of the Ministry of Science, Education and Sports, and providers are adult education
institutions.
15Although there are no national programmes to support adults in acquiring digital skills, many public
libraries provide free courses. Public libraries also have a role in organising family reading programmes
which often include all members, from all ages. Public libraries in Croatia play a vital part in bridging
the gap between formal and informal education, providing different programmes promoting reading
and literacy, but it is not enough and it is not continuous, and there is no coherent structure in those
programmes to fulfill all needs of adults in Croatia. Croatian libraries, especially Zagreb City Libraries
(ZCL), are very successful in organising library services and providing programmes for homeless people
in the capital of Croatia, Zagreb. The number of homeless people is steadily growing every day with a
very small number of quality social inclusion programmes intended for them.
163 General Information on the Croatian
Education System
Croatia, officially known as the Republic of Croatia (Republika Hrvatska) is a parliamentary democracy
situated in Southeast Europe. The country’s population, estimated at 4.5 million in 2010, consists of
various minorities, including Serbians, Bosnians, Hungarians, Slovenes, Czechs, Roma and Italians.
Croatia is a full member of the European Union since July 2013. The Ministry of Science, Education and
Sports is responsible for designing education strategies and policies. It determines what is taught and
is responsible for relevant financial policy.
Education in Croatia is a constitutional right in terms of which primary education is free and all other
education is available to all. Preschool education lasts according to parents’ needs – children can enter
preschool education at the age of 6 months, but such is not compulsory. The compulsory preschool
programme starts one year before elementary education and it is compulsory for all children. Children
that enter preschool education before the compulsory preschool programme do not have to change
their kindergartens or groups, they continue their regular group programme and it is valid as the
compulsory preschool programme.
Elementary education in Croatia is free and compulsory for all pupils from the age of 6 to 15 years,
with the exception of primary education for students with extensive developmental disabilities which
can last until the age of twenty-one (European Agency). The first four years of primary education are
characterised by unitary class teachers who teach all subjects except language classes and physical
education, which are taught by specialist teachers. Most teachers involved in the first four years of
primary education are usually taught at the Teacher Education Faculties, with the exception of some
physical education teachers. Subjects taught are Croatian language, Mathematics, Visual art, Nature
and society, Physical education, Music education and at least one foreign language that is compulsory
from 1st grade. Religious education is an elective subject.
After the first four years of primary education in Croatia, the curriculum widens to include specialist
teachers and additional scientific subjects. Children are taught the following subjects: Croatian
language, Foreign language, Mathematics, Visual art, Physical education, Music education, History,
st
Geography, Biology, Chemistry, Physics, IT, Religious education, Ethics and in addition to the 1 foreign
language, often a second language (usually German, French or Italian). All subjects are taught from 5th
th
grade except Chemistry and Physics, which are added to the curriculum in the 7 grade. All subjects
are compulsory except Religious education and Ethics between which children have to choose in 5th
grade and attend until the end of their primary schooling.
Upon completion of primary schooling, secondary education gives everyone, under equal conditions
and based on individual abilities, the opportunity to acquire knowledge and the competence needed
to enter the work force and to continue with further education. Children can enrol in different school
types, but their success depends on their grades in the last two years of primary school. They can
either enrol in general, classic, language or math grammar school (gimnazija) or vocational schools,
which last either three or four years.
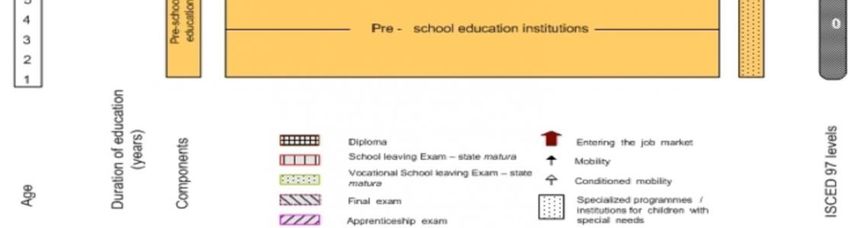
176
Figure 3: Detailed structure of the Croatia School System
In the area of higher education, all students, including young people from disadvantaged groups, are
guaranteed the right to education, good quality study programmes and educational processes, as well
as the equality of all applicants during admission to Croatian higher education institutions. In Croatia,
there is a binary higher education system, with higher professional education programmes offered by
polytechnics and schools for higher professional education, on the one hand, and academic
programmes offered by universities, on the other. Most of Croatia’s higher education institutions are
public institutions. The language of education is Croatian. However, under the influence of the Bologna
Process, the number of higher education programmes being offered in English is growing slowly but
surely.
6
See: https://www.european-agency.org/country-information/croatia/national-overview/complete-national-
overview.
18CHILDREN AND ADOLESCENTS
194 Literacy Performance Data for Children
and Adolescents
4.1 Performance Data for Children and Adolescents
The performance data for primary children are derived from the IEA´s PIRLS studies.
Inaugurated in 2001 and conducted every 5 years, PIRLS (Progress in International Reading Literacy
Study) is an assessment of pupils’ reading achievement at fourth grade organized by the Association
for the Evaluation of Educational Achievement (IEA). The survey was administered in 35 countries in
2001, 45 education systems in 2006, and 50 in 2011. PIRLS assesses different purposes for reading
(literary and informational) and different reading processes (retrieve explicit information, make
inferences, interpret and integrate ideas and information, examine and evaluate content, language,
and textual elements). Both multiple choice and open-ended questions are used.
Combining newly developed reading assessment passages and questions for 2011 with a selection of
secure assessment passages and questions from 2001 and 2006, PIRLS 2011 allowed for measurement
of changes since 2001. PIRLS 2011 also examined the national policies, curricula and practices related
to literacy in participating countries, and included a set of questionnaires for students,
parents/caregivers, teachers, and school principals to investigate the experiences that young children
have at home and school in learning to read, in particular their attitudes and motivation towards
reading.
For all PIRLS data used in this report, detailed tables with data for all participating countries in ELINET
are provided, together with the EU averages (see Appendix C: ELINET PIRLS 2011 Data, Appendix D:
ELINET PIRLS 2006 Data).
4.1.1 Performance and variation in reading: proportion of low and high performing readers
Students in Croatia achieved an overall mean reading score of 553 in PIRLS 2011 (Table 1). Only
Finland (568) and Northern Ireland (559) had significantly higher mean scores than Croatia.
Performance in Croatia was similar across reading purposes (Literary, Informational) and reading
processes, (‘Interpret, Integrate & Evaluate; Retrieve & Inference) (Appendix Tables A2-A5).
Table 1: Overall Performance on PIRLS 2011 – Croatia and EU-24 Average
Overall Reading – Mean Score
Croatia 553
EU-24 535
Significant differences (relative to the EU-24 Average) are shown in bold.
In Croatia, 10% of students performed at or below the Low benchmark on overall reading (Table 2).
This is half the EU average of 20%, and is slightly higher than the proportion in Finland (8%). Croatia’s
standing relative to most EU countries on this indicator is strong (see Appendix Table A.6). In Croatia,
11% of students achieve at the Advanced benchmark. This is above the EU average of 9%, but is well
behind countries such as Northern Ireland (19%), England (18%) and Finland (18%).
20Table 2: Performance by Overall PIRLS Reading Benchmarks 2011 - Percentages of Pupils
400-475 475-550 550-625 Above 625
Below 400
Low Intermediate High Advanced
Croatia 1 9 36 43 11
EU-24 5 15 36 35 9
Croatia’s standard deviation of 60 is 10 points lower than the EU-24 average indicating a slightly
smaller spread of achievement (Table 3). Among EU countries, the Czech Republic (62) had similar
Standard Deviations.
The difference between the scores of pupils at the 10th and 90th percentiles in Croatia – 154 points – is
26 points below the corresponding EU-24 average of 180. This indicates that there narrower range of
th th
achievement between the 10 and 90 percentiles than there is on average across the EU-24.
Table 3: Spread of Achievement – Standard Deviation, 10th, 90th Percentiles, and Difference between 90th and 10th
Percentiles on Overall Reading
Standard Deviation 10th Percentile 90th Percentile 90th-10th
Croatia 60 474 628 154
EU-24 Avg 70 441 621 180
Statistically significant differences in bold
Croatia did not participate in PIRLS 2001 or 2006; therefore trends in performance cannot be reported.
4.1.2 Gaps in reading
As in every European country there are achievement gaps between different groups.
Parent’s educational achievement
Students in Croatia whose parent completed University or Higher achieved a mean score (590) that
was some 69 points higher than students whose parents completed Lower Secondary or below (521)
(Table 4). The average difference across the EU-24 is 76 points, indicating a broadly similar relationship
between parent’s educational level and performance in Croatia.
This gap needs to be interpreted with reference to the proportion of students with parents who have
completed university or higher (18% in Croatia, compared with an EU-24 average of 30%), and the
proportions with parents completing lower secondary or below (7 % in Croatia, 18% on average across
the EU-24). Hence, the majority of parents in Croatia fall into a middle category, where they have either
completed upper secondary or post-secondary education below university level.
Table 4: Percentages of Parents Whose Highest Level of Education was Lower Secondary, and Percentages who
Finished University or Higher
Lower Secondary or Difference
University or Higher
Level of Education Below (Univ or Higher – Lower Sec)
% Mean % Mean
Croatia 7 521 18 590 69
EU-24 18 495 30 571 76
Statistically significant mean score differences in bold.´
21Challenge/need for action: As more parents complete higher education, efforts should be made to
facilitate those students who have lower educational qualifications, to ensure that the gap in reading
performance among students remains narrow.
Primary language spoken at home different from language used at school
In Croatia, 85% of pupils reported that they always spoke the language of the PIRLS reading test at
home – above the corresponding EU-24 Average (80) (Table 5). Fifteen percent sometimes or never
spoke the language of the test at home. The corresponding EU-24 average percentages are similar.
The difference in achievement between pupils in Croatia reporting that they always or
sometimes/never spoke the language of the test was 5 score points – a difference that was not
statistically significant.
Table 5: Percentages of Students Reporting that They Always or Sometimes / Never Speak the Language of the
PIRLS Test at Home, and Associated Mean Score Differences – Croatia and EU-24 Average
Language of the Test Spoken Always Sometimes /Never Mean Score Difference
at Home % Mean % Mean (Always – Sometimes/Never
Croatia 85 554 15 549 5
EU-24 Avg 80 541 20 519 26
Statistically significant mean score differences in bold.
Challenge: The gap in performance between students who always speak the language of the PIRLS
test at home and those that hardly ever or never do so is small in Croatia. It would be important to
ensure that this gap remains small in the context of any changes in immigration patterns in the next
few years.
Gender
Girls in Croatia achieved a mean score on overall reading (560) that was higher than boys (546) by 14
points in 2011. This was about the same as the EU-24 average difference of 12 points.
The equity gaps described above are summarised in Figure 1.
Figure 1: Performance Gaps – Gender, Parent Education and Language Spoken at Home
PIRLS 2011 - Performance Gaps
Croatia & EU-24
76
80 69
Score Points
60
40 26
20 14 12
5
0
Parent Education Home Language Gender
Croatia EU-24
Gender: girls – boys Education: University vs. Lower Secondary/Primary education; Language: Student speaks
language of the tests at home always vs. sometimes/never.
22Attitudes to Reading
There was a difference of 25 points between the top and bottom quartiles of the like Reading Scale in
Croatia in 2011 (Table 6). On average across the EU-24, the difference between students in the top and
bottom quarters of the Like Reading scale was 50 points. Hence, the relationship between Liking
Reading and performance in Croatia is weaker than on average across EU countries. Just 18% of
students in Croatia were categorised as ‘liking reading’ – among the lowest in the study (Mullis et al.,
2012, p. 204).
Table 6: Mean Overall Reading Scores of Students in the Top and Bottom Quartiles of the PIRLS Like Reading
Scale – Croatia and EU-24 Average
Overall Reading Score
Difference
Like Reading Top Quartile Bottom Quartile
(Q4-Q1)
Croatia 568 544 25
EU-24 563 511 52
Students in Croatia in the top quarter of the Confidence in Reading scale achieved a mean score (580)
that was some 64 points higher than students in the bottom quarter (516) (Table 7). The average
difference across the EU-24 was 80 points, again indicating a relatively weaker relationship between
Confidence and performance in Croatia.
Table 7: Mean Overall Reading Scores of Students in the Top and Bottom Quartiles of the PIRLS Confidence in
Reading Scale – Croatia and EU-24 Average
Overall Reading Score
Confidence in Reading Top Bottom Difference
Quartile Quartile (Q4-Q1)
Croatia 580 516 64
EU-24 570 490 80
234.2 Performance Data for Adolescents
The performance data are derived from the OECD PISA study.
The Programme for International Student Assessment (PISA) led by OECD7 assesses the skills and
knowledge of 15-year-old students every three years in all OECD countries and in a number of
partner countries.
Since 2000, PISA has been testing students in reading, mathematics and science. The OECD assessment
also collects information on students’ backgrounds and on practices, motivational attributes and
metacognitive strategies related to reading.
The PISA tests assess different aspects of reading literacy – retrieve information, interpret, reflect and
evaluate on texts – and use a variety of texts – continuous (prose) and non-continuous (texts including
graphs, tables, maps…). About half of the questions are multiple-choice, the other half open-ended
(short or constructed answers). Results are reported on scales defining different levels of proficiency
ranging from 1 (low performing) to 6 (high performing). Level 2 is considered as the level all 15 year-
olds should reach, and will enable them to participate effectively to society. Since 2015, PISA has been
administered on computers only in most participating countries.
The follow-up of students who were assessed by PISA in 2000 as part of the Canadian Youth in
Transition Survey has shown that students scoring below Level 2 face a disproportionately higher risk
of poor post-secondary participation or low labour-market outcomes at age 19, and even more so at
age 21, the latest age for which data from this longitudinal study are currently available. For example,
of students who performed below Level 2 in PISA reading in 2000, over 60% did not go on to any
post-school education by the age of 21; by contrast, more than half of the students (55%) whose
highest level was Level 2 attended college or university (OECD 2010, p. 52).
4.2.1 Performance and variation in reading; proportion of low and high performing readers
Croatia took part in three PISA tests – in 2006, 2009 and 2012.
In PISA 2012, the reading performance of Croatia is close to the EU’s average (Table 8).
Table 8: Reading performance in PISA 2012
Mean S.E.
Croatia 485 (3.3)
EU-27 489 (0.6)
S. E. = standard error; Significant differences between the country and the EU average are shown in bold
The performance in reading of Croatian students increased by 9 points between 2009 and 2012,
though the increase was not statistically significant (Table 9).
7
See: http://www.pisa.OECD.org
24You can also read