CAMBRIDGESHIRE AND PETERBOROUGH STRATEGIC BUS REVIEW: OPTIONS REPORT - Cambridgeshire and ...
←
→
Page content transcription
If your browser does not render page correctly, please read the page content below
CPCA Strategic Bus Review

Reference number 107607

16/01/2019

CAMBRIDGESHIRE AND PETERBOROUGH STRATEGIC BUS REVIEW: OPTIONS REPORT
IDENTIFICATION TABLE
Client/Project owner                  Cambridgeshire and Peterborough Combined Authority
Project                               CPCA Strategic Bus Review
Study                                 Cambridgeshire and Peterborough Strategic Bus Review: Options Report
Type of document                      Final Report
Date                                  16/01/2019
Reference number                      107607
Number of pages                       81

APPROVAL
Version            Name                                    Position                          Date            Modifications
                                 Neill Birch; Ralph        Project Director; Project
                   Author                                                               26/10/2018
                                 Anderson; Peter Hardy     Manager; Director
        1                                                                                                    Draft Report
                   Checked by    Neill Birch               Project Director             26/10/2018
                   Approved by   Neill Birch               Project Director             26/10/2018
                   Author        Ralph Anderson            Project Manager              04/12/2018
        2          Checked by    Neill Birch               Project Director             04/12/2018           Draft Final Report
                   Approved by   Neill Birch               Project Director             04/12/2018
                   Author        Neill Birch               Project Director             17/12/2018
        3          Checked by    Ralph Anderson            Project Manager              17/12/2018           Draft Final Report Update
                   Approved by   Neill Birch               Project Director             17/12/2018
                   Author        Ralph Anderson            Project Manager              16/01/2019
        4          Checked by    Neill Birch               Project Director             16/01/2019           Final Report
                   Approved by   Neill Birch               Project Director             16/01/2019
3.3         INTER-URBAN SERVICES                                          41
TABLE OF CONTENTS                                                                    3.4         POTENTIAL ROLE OF INTER-URBAN AND RURAL BUS SERVICES          44
                                                                                     3.5         WAY FORWARD FOR INTER-URBAN AND RURAL BUS SERVICES            44
1.             INTRODUCTION                                                      5
                                                                                     4.          DELIVERING MODERN PUBLIC TRANSPORT                            52
1.1            STUDY PURPOSE AND BACKGROUND                                      5
1.2            PART 1 OF THE STUDY                                               5   4.1         HOLISTIC DELIVERY OF PUBLIC TRANSPORT                         52

1.3            STRUCTURE OF THIS REPORT                                          5   4.2         FARES INITIATIVES                                             56

1.4            SCALE OF THE CHALLENGE                                            8   4.3         POLITICAL SUPPORT                                             57

1.5            CHANGES IN TECHNOLOGY, SOCIETY, AND THE DRIVERS FOR CHANGE IN         4.4         DELIVERY AGENCIES                                             57
               TRANSPORT                                                     11      4.5         DELIVERY MODELS                                               61
1.6            TECHNOLOGY AS A DISRUPTOR AND ENABLER IN THE TRANSPORT SECTOR 17      4.6         FUNDING                                                       70

2.             INTERVENTIONS IN THE CITIES’ NETWORKS                            19   4.7         ACHIEVING FINANCIAL SUSTAINABILITY                            73

2.1            INTRODUCTION                                                     19   5.          IMPLEMENTATION AND TRANSITION PLAN                            78
2.2            ENHANCING THE EXISTING BUS NETWORKS                              19
                                                                                     LIST OF FIGURES
2.3            TARGETED BUS PRIORITY                                            28
2.4            FLEXIBLE RESPONSES TO PASSENGER REQUIREMENTS                     32   Figure 1.   Summary of Mode Shares, 2011                                9
2.5            VEHICLE QUALITY                                                  34   Figure 2.   Change in Bus Journeys Required to Meet Mode Share
                                                                                                 Aspirations                                                10
2.6            MULTI-MODAL INTEGRATION                                          34
                                                                                     Figure 3.   Smart Phone Penetration by Age Group                       12
2.7            NEW VEHICLE TECHNOLOGIES                                         36   Figure 4.   Peterborough Citi Bus Route Map with Main Areas of
                                                                                                 Deprivation & Development                                  21
3.             RURAL AND INTER-URBAN BUS SERVICES                               38   Figure 5.   Addenbrooke / Biomedical Campus Accessibility – Journey Time
                                                                                                 Map                                                        23
3.1            INTRODUCTION                                                     38
                                                                                     Figure 6.   CAM Proposals Superimposed on Cambridge City Bus Network
3.2            RURAL BUS SERVICES                                               39                                                                          25
                                                                                     Figure 7.   Challenges facing Buses in Central Cambridge               28

CPCA Strategic Bus Review
Cambridgeshire and Peterborough Strategic Bus Review: Options Report   107607
Final Report                                                           16/01/2019                                                                       Page 3/ 81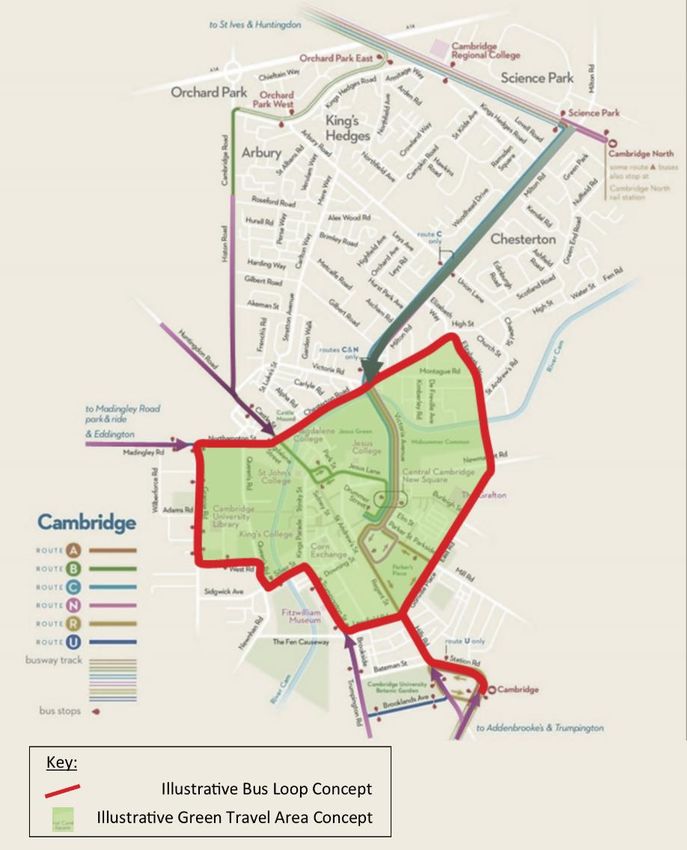
Figure 8.      Illustrative Concept of a Green Travel Area for Cambridge and
               Bus Loop                                                      30
Figure 9.      A Typical Arrangement for Bus Priority Signals                31
Figure 10.     Flexible, demand-responsive transport at peripheral locations 32
Figure 11.     Busway services at Cambridge Station                          35
Figure 12.     Inter-urban Network, Rural Services, and Feeder Hub Concept
               Map                                                           52
Figure 13.     Holistic Delivery of Public Transport in CPCA area            52
Figure 14.     Stakeholder Relationships – Transport for Cambridge and
               Peterborough                                                  59
Figure 15.     Potential Sources of Funding for Bus Service Enhancements 71
Figure 16.     Process for Franchising                                       75
Figure 17.     Indicative Implementation Plan                                80

LIST OF TABLES

Table 1.       Example of Relationship of Daytime to Evening/Sunday Bus
               Frequencies                                                  20
Table 2.       Rail Station Entries and Exits                               42
Table 3.       Application of 2017 Bus Services Act Powers to CPCA area     64
Table 4.       Available Ticketing Obligations on Operators through 2017 Bus
               Services Act                                                 67
Table 5.       Comparison of Delivery Models for Partnership, Franchising and
               Integrated Ticketing                                         69
Table 6.       Resource Implications of Enhancing Public Transport Delivery in
               CPCA area                                                    72
Table 7.       Strategic Interventions and Associated Delivery Models       79

CPCA Strategic Bus Review
Cambridgeshire and Peterborough Strategic Bus Review: Options Report   107607
Final Report                                                           16/01/2019   Page 4/ 81
1.        INTRODUCTION                                                                      transport network if options such as those presented conceptually
                                                                                            here were to be taken forward.
1.1       Study Purpose and Background
                                                                                    1.2     Part 1 of the Study
1.1.1     SYSTRA Ltd was commissioned by the Cambridgeshire and
                                                                                    1.2.1   Previous work, documented in the study’s Part 1 Report, looked in
          Peterborough Combined Authority (CPCA) in May 2018 to undertake
                                                                                            depth at the strengths, weaknesses, opportunities and challenges
          a strategic review of bus service provision within the CPCA area. The
                                                                                            (SWOC) associated with bus-based public transport in Peterborough
          study is intended to help explore opportunities for transformational
                                                                                            and Cambridgeshire.
          change as well as for improving the service in short term (1-5 years),
          medium term (6-10 years), and long term (10+ years).                      1.2.2   This is summarised in the diagram on the next page. The work for
                                                                                            Part 1 has formed the basis for a wide-ranging option generation
1.1.2     The timing of this report means that a number of key transport
                                                                                            exercise and sifting of potential options, until a coherent holistic set
          documents are in the process of being prepared, such as the Local
                                                                                            of potential interventions has emerged covering short, medium and
          Transport Plan for the CPCA, the GCP’s Transport Strategy, and a
                                                                                            long terms.
          number of detailed studies looking at delivering Cambridge’s City
          Access package. As such, this Bus Review cannot, and does not, seek       1.2.3   The Learning Points from the SWOC analysis formed the starting
          to present a single preferred solution for the network. It presents a             point for developing options to ensure that buses play a viable role in
          range of options at a conceptual level which can help inform more                 supporting economic development in the CPCA area and delivering
          detailed planning and design in the future through other studies. This            the very challenging levels of mode shift required.
          is likely to include documents such as the future CPCA Bus Strategy,
          which will be developed as part of or in parallel with the Local
                                                                                    1.3     Structure of this Report
          Transport Plan.
                                                                                    1.3.1   This report provides a summary of the option development stage of
1.1.3     For a number of the options presented, examples have been used to
                                                                                            the study.
          illustrate the types of incidences where these could be applied. These
          examples should not preclude the development of alternative               1.3.2   The remainder of this introduction summarises the SWOC analysis
          approaches during more detailed planning of the network in other                  from the Part 1 report, describes the scale of the challenge, and
          studies.                                                                          considers some of the changes in society and technology that will
                                                                                            impact on transport in the future.
1.1.4     One of the key messages presented in this report is the need to
          consider different delivery models and funding – this is highlighted by   1.3.3   Section 2 of the report presents a range of conceptual interventions
          the step change that would be required in the delivery of the                     which highlight they types of actions which could be explored further

CPCA Strategic Bus Review
Cambridgeshire and Peterborough Strategic Bus Review: Options Report   107607
Final Report                                                           16/01/2019                                                                         Page 5/ 81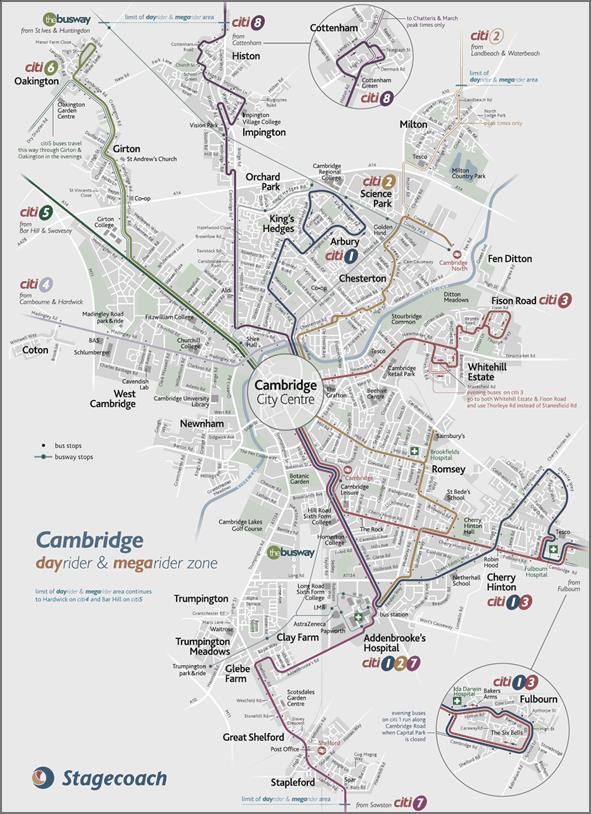
to tackle the challenges faced in the cities of Peterborough and
          Cambridge.

1.3.4     Section 3 similarly presents conceptual interventions for further
          consideration in the context of rural and inter-urban bus services
          across the CPCA area.

1.3.5     Section 4 summarises potential delivery models for delivering these
          types of these transport interventions, including some of the
          examples presented in Sections 2 and 3. This includes discussion of
          funding and the consideration of financial sustainability.

1.3.6     Section 5 presents an indicative implementation and transition plan
          for how these types of transport could be implemented over time.

CPCA Strategic Bus Review
Cambridgeshire and Peterborough Strategic Bus Review: Options Report   107607
Final Report                                                           16/01/2019   Page 6/ 81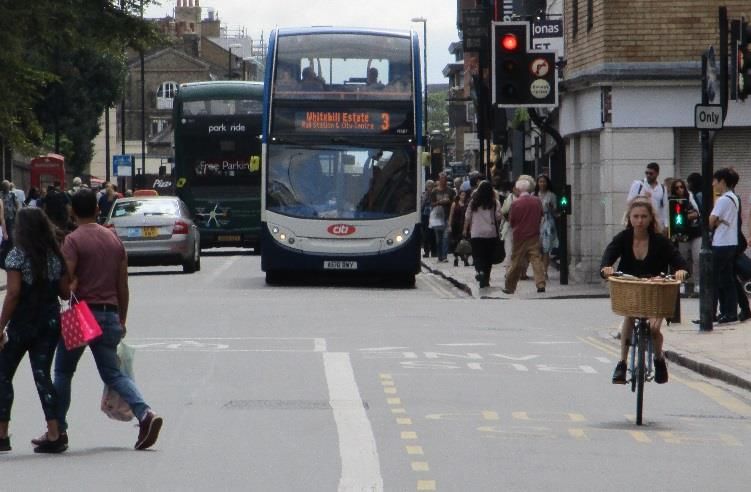
STRENGTHS                                                                                   WEAKNESSES
       •       Good geographical network coverage, including strong rail network                  •   Inconsistent service offer, in particular in rural areas - frequency, accessibility and
       •       Frequent services on many corridors, especially in cities                              journey time, times of day, information, etc.
       •       90% of bus network provided commercially                                           •   Inadequate coordination between services, especially Busway and P&R
       •       Ongoing investment in the network - new technology, including RTPI, busway         •   Unattractive journey times by bus, in particular in rural areas
       •       Park & Ride concept supported in Cambridge                                         •   Crowding (on some peak services)
       •       External funding for bus services                                                  •   Community transport provision inconsistent and restricted to users
       •       Local environmental awareness                                                      •   Some key travel desire lines not linked by direct bus - new developments not served
       •       Local commitment to active travel, especially cycling                              •   Congestion and conflicting priorities for road space (cycling versus bus)
       •       Active community transport sector                                                  •   Excessive supply of car parking
       •       Existing integration of school and rural transport                                 •   Bus/rail integration poor
       •       Willingness to trial new approaches (e.g. Zume)                                    •   Staff recruitment challenging
       •       Bus users generally positive about bus service experience                          •   Limited market research by commercial operators - limited appetite for innovation
                                                                                                  •   Limited competition amongst commercial operators
                                                                                                  •   Financial sustainability of existing commercial operations
                                                                                                  •   Inadequate public-sector funding
                                                                                                  •   Limited evening, Sunday services
                                                                                                  •   Complex public-sector delivery structure
                                                                                                  •   Inadequate multi-operator/multi-modal ticketing
                                                                                                  •   Costs of public transport to users too high

     OPPORTUNITIES                                                                               CHALLENGES
       •       Air quality providing imperative to change                                         •   Congestion
       •       City deal funding, work place charging levy                                        •   PT keeping ahead of economic development
       •       Harnessing value from economic development                                         •   Dispersal of growth
       •       Political appetite for change                                                      •   Meeting ambitious mode shift targets
       •       Younger people driving less                                                        •   Improving public perceptions of the bus
       •       Limited use of busway services by 16-24s                                           •   Car and rail can be cheaper than bus, with parking charges providing the largest
       •       Integration with other modes (e.g. cycling)                                            comparative cost disincentive for city centre access.
       •       Emerging new technologies (information, delivery models) - chance to revamp the    •   Changing travel patterns, flexible working, online shopping, etc. - challenging by bus
               image                                                                              •   Long term political support over multiple electoral cycles
       •       Eliminating inconsistencies of delivery                                            •   Inadequate finance available - especially outside City Deal, also balance
       •       Behavioural change - especially at new developments                                    revenue/capital funding
       •       New delivery approaches (e.g. commercial DRT)                                      •   Labour shortages
       •       Not all services busy - capacity to carry more                                     •   Operator uncertainty - legislation, regulations
       •       Reconnecting rural areas to modern public transport                                •   Pace (and cost) of technological change
       •       Reallocation of road space                                                         •   Engaging with MaaS providers
       •       Depot modernisation and location                                                   •   Insufficient public-sector resources, especially staff
       •       Greater partnership and collaboration (Transport for Cambridgeshire and            •   Need to integrate short-term proposals with long-term aspirations (e.g. CAM)
               Peterborough)                                                                      •   Relationships between stakeholders
                                                                                                  •   Providing infrastructure for electric vehicles

CPCA Strategic Bus Review
Cambridgeshire and Peterborough Strategic Bus Review: Options Report            107607
Final Report                                                                    16/01/2019                                                                                               Page 7/ 81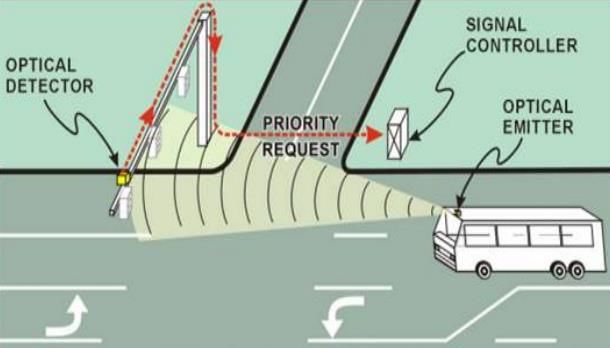
travel demand growth expectations of 30% in Peterborough by 2031,
1.4 Scale of the Challenge and Peterborough’s Environment Capital Action Plan notes that it’s
2020 growth plans mean 9% more journeys need to be by sustainable
1.4.1 In the area around Cambridge, the Greater Cambridge Partnership modes, with 90% of all journeys zero emission by 2050.4
(GCP) has established an objective that1:
1.4.5 In addition, an ageing population is likely to increase the demand for
“City centre traffic in Cambridge should be reduced by 10% to 15% public transport, with buses a vital part of the transport solution.
over 2011 levels.”
1.4.6 The scale of the challenge faced by public transport in contributing to
these radical mode shift targets requires a focus on significant
1.4.2 Because city centre traffic has continued to grow since 2011, GCP interventions to produce a step change in public transport delivery,
estimates that a 24% mode shift to sustainable travel is now required far beyond that which can be achieved through simple enhancements
to achieve this objective. to existing bus service provision.
1.4.3 On top of this target based on existing economic activity, the Greater 1.4.7 This will need to be backed by step change in resourcing
Cambridge area will continue to expand in terms of both residents (predominantly staffing, but also specialist external support) and
and employment over the years to 2031, with GCP estimating that funding, in the form of both capital and revenue expenditure.
without a significantly adjusted mode share this would result in
26,000 additional cars on the road network by that year2. Future Mode Share
1.4.4 Cambridge is not the only area which is growing. Peterborough is one 1.4.8 In our Part 1 report, we examined mode shares in each of the existing
of the fastest growing cities in the UK (in fact ranked 4th fastest in Cambridge and Peterborough Combined Authority (CPCA) districts.
2017), and it faces greater levels of deprivation than Cambridge. We Figure 1 presents a summary of this data (more detail is available in
identified in our Part 1 report that an additional 20,000 homes are the Part 1 report). The analysis highlighted that:
scheduled to be built in Peterborough by 2036. Although pressures Cycling is a very significant component of the mode share in
of congestion are not as pronounced in Peterborough as Cambridge, Cambridge itself, for journey of up to 10km;
continued growth both within the city and the surrounding area will Peterborough has the highest bus mode share, followed by
increase pressures on Peterborough in a similar manner to those of Cambridge;
Cambridge, and will demand similar radical mode shift targets. For
example, data published in the Strategic Economic Plan3 showed
1 4
GCP, Transport Strategy - Future Public Transport Requirements, July 2018 PCC, Environment Capital Action Plan, accessed at
2
ibid https://democracy.peterborough.gov.uk/documents/s25356/6.%20Appendix%20A%
3
GCGP (now Business Board), Strategic Economic Plan, 2013 20-%20Environment%20Capital%20Action%20Plan.pdf, accessed on 28/11/2018
CPCA Strategic Bus Review
Cambridgeshire and Peterborough Strategic Bus Review: Options Report 107607
Final Report 16/01/2019 Page 8/ 81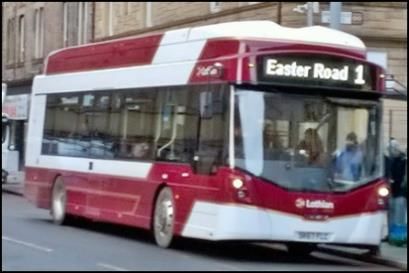
Bus mode share elsewhere in Cambridgeshire is comparatively
Train Bus CarDriver CarPassenger Bicycle OnFoot
low; and
In most districts, car mode share has been declining between 0% 20% 40% 60% 80% 100%
2001 and 2011 (latest data available) with some modest growth
Total
Cambridge
in bus mode share in some (but not all) districts.
10-20km
Cambridges
0-10km
East
hire
>20km
Total
Fenland
10-20km
Cambrid Cambridges Peterborou Huntingdon
0-10km
shire
>20km
Total
gh
10-20km
0-10km
South
hire
>20km
Total
geshire
All
10-20km
Figure 1. Summary of Mode Shares, 2011
CPCA Strategic Bus Review
Cambridgeshire and Peterborough Strategic Bus Review: Options Report 107607
Final Report 16/01/2019 Page 9/ 81
1.4.9 To explore the scale of the challenge, data for existing mode shares deliver greater support for walking and cycling, then it is possible that
in 2011 was projected forward in time to 2031 as follows: less public transport capacity will prove feasible.
Total volumes of travel were expanded by 30% in Cambridge and Change Required to Meet 2031 Bus Ridership Aspirations
Peterborough, and by 15% in all other districts to simulate the
18,000 400%
impact of continued population growth and economic activity in
Change in Daily Ridership
16,000 350%
the CPCA area; 14,000 300%
Distribution of travel between the different journey lengths are 12,000
% Change
250%
10,000
assumed to be in same proportion as 2011; 8,000
200%
Car-based journeys in Cambridge and Peterborough assumed to 6,000 150%
100%
reduce by 12.5% (mid-point of GCP target range) compared to 4,000
2,000 50%
2011, with existing journeys therefore redistributed to walking,
- 0%
cycling and public transport. Car-based travel in other districts
>20km
>20km
>20km
>20km
Total
Total
Total
Total
0-10km
0-10km
0-10km
0-10km
10-20km
10-20km
10-20km
10-20km
assumed to be capped at 2011 levels;
Redistributed journeys (in Cambridge and Peterborough) and all
newly generated journeys since 2011 assumed to be split in Cambridge Peterborough All CPCA Rest of CPCA
proportion to existing sustainable travel mode shares as Bus Bus %
observed in 2011.
1.4.10 The results of this simulation are presented in Figure 2, in terms of Figure 2. Change in Bus Journeys Required to Meet Mode Share Aspirations
both the absolute increase in bus passenger journeys required each
1.4.12 As shown:
working day to meet these aspirations, and the proportionate scale
of change compared to current levels. There is a very significant increase in bus passengers to be
accommodated in Peterborough, mostly in the short-distance
1.4.11 Note that given the current dominance of walking and cycling for
category (0-10 km), although the greatest proportionate increase
travel in Cambridge, the method adopted projects forward a similar
is in the 10-20 km category;
proportion of future travel for those modes – if this proved to be
Increase in passengers to be carried in Cambridge is of a lower
undeliverable (which might be the case if current unusually high
volume (because a high proportion are assumed to walk or cycle),
levels cannot be maintained), then additional pressure will be placed
but nevertheless this still represents a 63% increase over current
on the local public transport network in Cambridge to absorb more
bus use, with significant growth in travel of over 10km;
passenger journeys than shown below, and future network capacity
Note that although this growth is categorised as being focused on
will need to reflect this. Alternatively, if other travel interventions
Peterborough and Cambridge, the distances concerned have
CPCA Strategic Bus Review
Cambridgeshire and Peterborough Strategic Bus Review: Options Report 107607
Final Report 16/01/2019 Page 10/ 81profound implications not only for city-centric travel, but also for Other technologies, such as the telephone and refrigeration, have
travel to/from the wider hinterland; and changed both our need to travel as individuals and our means and
There is significant increase in travel volumes assumed in the requirements of transporting goods and services.
wider CPCA area, albeit that these represent quite small
proportions of existing travel. 1.5.4 Fast-forwarding to the present, it is easy to forget that equally radical
technological and societal changes have taken place in recent
1.4.13 These conclusions point to the need for radical interventions in decades and are continuing to evolve, mature, and impact how we
Peterborough and Cambridge, as well as in the wider travel-to-work travel. Some of the biggest areas of change, both in transport and
area, and therefore guide the proposals brought forward in the society more widely, are introduced below. Some of the largest
remainder of this report. opportunities and risks coming from this disturbance to traditional
public transport delivery are then are explored in the next section.
1.5 Changes in Technology, Society, and the Drivers for Mobile Devices and the Internet
Change in Transport
1.5.5 The rise of the internet, and in particular mobile devices such as
1.5.1 This section aims to provide context for some of the options explored smartphones and tablets, has changed the way we interact with the
later in this report, and highlight how key drivers of change require world around us, and expanded the suite of products and services
us to think radically on the future of the transport sector. available in the transport industry.
1.5.2 This Strategic Bus Review must consider a full range of short-term (1- 1.5.6 Mobile technology is becoming increasingly sophisticated, and smart
5 years), medium-term (6-10 years), and long-term (10+ years) devices provide an invaluable tool within the transport sector. In
transport options. It is therefore important to think about the addition to the ability for voice and text communication across the
technological and societal changes that have happened in recent globe from almost any location, features on smartphones now
years, and those that are likely to happen in the future across these generally include locational positioning services, secure payment
time periods. These changes will profoundly affect the level of options, and user-friendly interfaces (e.g. via apps) that change the
demand for travel as well as the physical means by which people way we access information and act on that information while on the
travel, their travel needs, and their expectations for what represents move. Examples of how these features can be used in the transport
an attractive transport offering. context are provided in Section 1.6 and many of the case studies
throughout this report.
1.5.3 Throughout history, technological changes have revolutionised the
way we live and the way we travel. The internal combustion engine 1.5.7 Figure 3 opposite shows smartphone penetration by Age Group. The
has had a dramatic influence on our natural landscape, the form and rate of adoption observed is significant. It can be seen that the
function of our public space, and is continuing to have a global impact penetration (i.e. access to the device) of smartphones rose from 44%
on the environment as well as the health of the world’s population. to 74% for all adults in a six-year period between 2011 and 2017, with
CPCA Strategic Bus Review
Cambridgeshire and Peterborough Strategic Bus Review: Options Report 107607
Final Report 16/01/2019 Page 11/ 81particular increases in the 55-64 age group (23% to 64%) and the 65- services, with particular focus on the most vulnerable and isolated
75 age group (8% to 36%). While those aged 16-54 are now likely to individuals in society in mind.
be at peak penetration in terms of access to these devices, the trend
The Rise of Cashless Transactions
observed across older age groups suggests that access to
smartphones will continue to rise until the vast majority of people 1.5.9 The way we can pay for goods and services has changed. Now well-
have access to such a device. Increased availability of devices suitable established payment options, such as smartcards, EMV contactless
for older people and for those with access issues is likely to facilitate credit and debit card payments, NFC based mobile phone payments,
this uptake. and the rise of integrated subscription based payment plans are
filtering into public transport. While the consistency in payments
options is fragmented both geographically and by mode and
operator, progress has been made in a number of areas to make the
best use of payment options to deliver attractive and integrated
mobility services to users. Several case studies which demonstrate
this are referenced later in this report.
1.5.10 Some of the potential wider benefits that can be offered from a range
of smart ticketing and payment options, to both the user and
operator/transport managers, include:
Increased patronage – a review of case studies from major
urban areas across Europe, North America and Australia
showed robust evidence that patronage can increase with
integrated ticketing by between 6% and 20%, with some
modes experiencing increases in the order of 40%;6
Figure 3. Smart Phone Penetration by Age Group5
Improved satisfaction – e.g. from increased payment
1.5.8 While the increased uptake of smartphones does mean that the scale convenience and fare savings as well as reduced boarding
of services which can be offered through this medium will grow, and alighting times contributing to more reliable journeys;
public transport should continue to ensure that it is inclusive for all
users. It is therefore important to design, prototype, and test new
5 6
Base data from: Ofgem, Adults’ Media Use and Attitudes Report, 2018, available at, PTEG, The Benefits of Simplified and Integrated Ticketing in Public Transport, October
https://www.ofcom.org.uk/__data/assets/pdf_file/0011/113222/Adults-Media-Use- 2009, UK.
and-Attitudes-Report-2018.pdf, accessed on 15/10/2018
CPCA Strategic Bus Review
Cambridgeshire and Peterborough Strategic Bus Review: Options Report 107607
Final Report 16/01/2019 Page 12/ 81 Prevention of fraud – through improved verification of pioneer for next generation ticketing, but does present risks if not
payment/ticket validity, and management of managed effectively. Ongoing work is also being undertaken the GCP.
concessionary/free travel eligibility;
Better data on transport use – including a potential 1.5.13 Capitalising on progress, ensuring the ticketing approach is managed
reduction of network survey costs; effectively to minimise risk, and helping ensure any benefits span the
Improved throughput of passengers – e.g. via faster whole CPCA area, provide part of the rationale for the Advanced
boarding times, integration between modes, automated Ticketing Scheme presented later in this report (Section 4.5).
retailing via ticket machines and online sales; Availability and Analysis of Data
Reduced operating costs – e.g. through more efficient
boarding and alighting; 1.5.14 This rise of cashless payment mechanisms and the recording of these
E-purse/ account-based potential – allowing for payment and other digital footprints, is offering the opportunity for greater
of other services with the same account; the ability for collection, analysis, and the leveraging of useful data. Data about how
family members/parents/guardians to pay for children; we travel, such as boarding information, travel patterns (time,
and distance, origin and destination points etc.), travel speeds on the
Flexibility and choice between payment methods. network, etc., all provide an important tool for those planning and
managing transport. The rise of the ‘internet of things’, where more
1.5.11 With many of these benefits being dependent, from the bus devices are connected to networks, also offers some interesting
perspective, on the operational capability of the ticketing system, it opportunities.
is essential that there is a clear strategy to progress ticketing in line
with the vision for the network. 1.5.15 Some progress towards the innovative use of data sources in the area
is seen through the Intelligent City Platform (iCP), developed by
1.5.12 A recent feasibility study regarding integrated ticketing for the Smarter Cambridge and the University of Cambridge, and supported
Greater Cambridge area highlights some options.7 These range from by the Connecting Cambridge partnership programme led by
a ‘do-nothing’ approach, which it notes would achieve none of Cambridgeshire County Council.8 This project, launched in 2017,
Greater Cambridge’s vision towards intelligent mobility and collates and processes real-time data from an array of sensors around
introduces reputational risk from users, to a ‘do-maximum’ approach, Cambridge that can be used across different applications. Data
using account-based systems and allowing contactless cards, phones, sources, e.g. traffic lights, bus movements, and car parks, together
and wearables to be used to travel. This could make the area a with new traffic monitoring cameras and air quality sensors, can be
used to monitor a range of measures including air quality, traffic, and
7 8
Cambridgeshire County Council, Integrated Ticketing Feasibility Study, 2017 Connecting Cambridge, Data – Intelligent City Platform (iCP),
https://www.connectingcambridgeshire.co.uk/smart-places/smart-cambridge/data-
intelligent-city-platform-icp/, accessed on 28/11/2018
CPCA Strategic Bus Review
Cambridgeshire and Peterborough Strategic Bus Review: Options Report 107607
Final Report 16/01/2019 Page 13/ 81cycle and pedestrian movements. One on-the-ground example is that challenges mainly related to Particulate Matter (PM2.5 and PM10) and
is that of the digital wayfinding screens installed outside Cambridge nitrogen dioxide (NO2) in the ambient air.
Station, and planned for other locations.
1.5.20 While not a new phenomenon, recent studies have increased societal
1.5.16 As transport options progress in the CPCA area, it will be vital to awareness and policy focus at the national and local level on reducing
consider how data can be used to maximise the value of the transport air pollution, in particular due to its association with a number of
system for local authorities, operators and users. adverse health impacts. Air pollution is recognised as a contributing
factor in the onset of heart disease and cancer and particularly affects
Increasing Focus on the Importance of Climate Change
the most vulnerable in society: children and older people, and those
1.5.17 Recent years have seen an increase in societal pressure to act on the with heart and lung conditions.10
issue of global warming and climate change. Research, such as the
1.5.21 Additional guidance on the health impacts of poor air quality and the
Intergovernmental Panel on Climate Change’s ‘Global Warming of
cost/benefit values of different interventions have been published by
1.5oC’ report9, demonstrates a fundamental need to improve global
the National Institute for Health and Care Excellence (NICE).11
emissions of greenhouse gases for the purpose of limiting
environmental impacts. 1.5.22 There are legally binding health-based limits for concentrations of
several pollutants in the outdoor air, notably NO2. The UK
1.5.18 The UK’s role in the legally binding global climate deal, the 2015 Paris
Government have used a combination of national modelling and
Agreement, and the commitment made with the Climate Change Act
monitoring in accordance with legislation to determine the
to reduce emissions by 80% compared to 1990 levels by 2050,
concentrations of these pollutants in order to assess compliance.
requires major changes to occur in the transport sector to reduce its
share of total emissions. 1.5.23 While relevant authorities in the CPCA area are both working towards
Pressure to Reduce Air Pollution these targets, the centre of Cambridge (approximately the area
within the inner ring road) is designated as an Air Quality
1.5.19 Air pollution is a mixture of particles and gases that can have an Management Area (AQMA) for NO2, meaning that it breaches these
adverse effect on human health. Although air pollution has improved
over recent decades, there are still significant public health
9
IPCC, Global Warming of 1.5 oC, 2018, available at http://www.ipcc.ch/report/sr15/, at https://www.gov.uk/government/publications/comeap-mortality-effects-of-long-
accessed on 25/10/2018 term-exposure-to-particulate-air-pollution-in-the-uk, accessed on 25/10/2018
10
The Committee on the Medical Effects of Air Pollutants, The Mortality Effects of 11
NICE, Air Pollution: outdoor air quality and health (NG70), June 2017
Long-Term Exposure to Particulate Air Pollution in the United Kingdom, 2010, available
CPCA Strategic Bus Review
Cambridgeshire and Peterborough Strategic Bus Review: Options Report 107607
Final Report 16/01/2019 Page 14/ 81objectives, primarily due to vehicular traffic.12 Particulates are also controls (including Controlled Parking Zones), a workplace parking
of concern, although do not exceed thresholds in terms of the AQMA Levy, and wider traffic management. 13
designation.
1.5.27 Peterborough Council’s 2017 Air Quality Annual Status Report, notes
1.5.24 Peterborough City Council currently has one declared AQMA – this is that changes to bus services, along with residents moving to modes
in a rural area and is not transport related. However, expected such as walking, cycling, and car sharing, will play a role in improving
growth from development means that this position may not persist air quality in the area.14
and continuation of the status quo may not be a viable reality.
Changes in the Vehicle Industry
1.5.25 Public Transport will play a key role in helping tackle air pollution
1.5.28 Two of the main changes in the vehicle industry which are most
problems, both by reducing the need for unsustainable modes and by
relevant to the provision of public transport are the rise of
reducing emissions from public transport vehicles themselves by
Autonomous Vehicles (AV) and major developments of alternative
investing in cleaner technology. Cambridge City Council’s Air Quality
fuel sources. Both sets of technologies will reach a critical point
Action Plan 2018, for example, states that the second of its seven
within the period that this Strategic Bus Review considers.
main areas of action is to “Reduce emissions from Buses and
Coaches” 13. While some fleet changes have been made as follow up 1.5.29 With regard to AVs, while this field is still in its infancy in terms of
to their 2008 plan, the changes have not been significant enough to real-world fully operational systems, AV models are being prototyped
produce the desired change in air quality. Air quality monitoring sites and tested across the globe for different sizes of multiple occupancy
at the bus station show mixed changes across PM10 and PM2.5. vehicles – from small pods of around 6 or 7 people, such as the
electric-powered Navya Autonomous Cab15, to more traditional sized
1.5.26 Cambridge’s Air Quality Action Plan also notes that other measures
buses, such as the 12m Volvo 7900 electric autonomous bus, which is
may be required: “The GCP ambition of 10 - 15% less traffic within
to be trialled in Singapore during 201916.
Cambridge may require further restrictions on access to the city
centre, which could include restrictions based on emissions to reduce 1.5.30 The advent of AVs brings significant opportunities (and challenges) to
air pollution.”. It also suggests measures such as on street parking the delivery of both demand responsive style services, which
12 14
Cambridge City Council, 2018 Air Quality Annual Status Report, available at, Peterborough City Council, Air Quality Annual Status Report, available at
ttps://www.cambridge.gov.uk/media/6048/air-quality-annual-status-report- https://www.peterborough.gov.uk/business/environmental-health/environmental-
2018.pdf, 2018, accessed on 25/10/2018 protection/#AirQuality, 2018, accessed on 25/10/2018
15
13
Cambridge City Council, Air Quality Action Plan 2018 – 2023, available at http://navya.tech/en/autonom-en/autonom-cab/, accessed on 25/10/2018
16
https://www.cambridge.gov.uk/media/3451/air-quality-action-plan-2018.pdf, 2018: https://www.volvobuses.com/en-en/news/2018/jan/volvo-ntu-to-trial-
p9, accessed on 25/10/2018 autonomous-electric-buses-in-singapore.html, accessed on 25/10/2018
CPCA Strategic Bus Review
Cambridgeshire and Peterborough Strategic Bus Review: Options Report 107607
Final Report 16/01/2019 Page 15/ 81underpin concepts such as Mobility as Service, and more traditional much more multimodal, with two-thirds of people in the UK using
fixed route bus services. multiple transport modes every week. It cites a study in Bristol, in
which 52% of people who had used a bicycle as their primary mode
1.5.31 In relation to alternative fuels – when considering the move towards for their commute during the survey week had also used another
improving air quality and reducing emissions, the implementation of mode of transport in the same week for that same journey. For those
emissions standards in Europe for diesel powered buses has spurred who had used a car, 36% had also used another mode.18
on advancements in technology for not only diesel vehicles but other
power sources. 1.5.36 The study also suggests that major transition points in life, such as
when we move employment or housing, are also incredibly important
1.5.32 European emissions standards are defined in a series of EU directives in determining how we travel. It suggests that 50% of people change
introducing increasing standards, with the latest introduced in 2013 the main way they get to work every decade.
as ‘Euro VI’. As these standards have become progressively stringent
and harder to meet, bus manufacturers have increasingly turning to 1.5.37 Heightened expectations for flexibility in how we travel, and the
alternative fuels and technologies to meet market needs. The most changes in lifestyle that underpin this, such as increased home
established of these include: working, mean that the concept that individuals have a standard way
Electric; of travelling from A to B is quickly becoming obsolete.
Hybrid and Plug-in hybrid;
Gas, including CNG and Biomethane; and 1.5.38 To help deal with this, the mobility system needs to be considered
Hydrogen fuel cells. not just as a transport network of roads and buses etc, but as a web
of interactions between that transport network, social resources (e.g.
1.5.33 Funding is currently available in the UK via the Office for Low Emission social networks and relationships), the communication system (such
Vehicles’ Ultra Low Emission Bus Scheme to help facilitate the uptake as connectivity via mobile devices) and the activities that people
of cleaner buses.17 undertake (e.g. working, eating, leisure etc.).
1.5.34 Further consideration of vehicle technology is included in relation to 1.5.39 Approaching the planning of transport from this interconnected
the options in Section 2.7. viewpoint offers the opportunity to deliver a more attractive system
that really meets the needs of users.
Changes in Lifestyles and the ‘Mobility System’
1.5.35 A report produced under the Disruption Project, by a partnership of
universities across the UK, suggest that society has already become
17 18
UK Government, https://www.gov.uk/government/publications/low-emission-bus- Flexmobility, Unlocking Low Carbon Travel, 2016, available at
scheme, accessed on 25/10/2018 http://www.disruptionproject.net/category/outputs, accessed on 25/10/2018
CPCA Strategic Bus Review
Cambridgeshire and Peterborough Strategic Bus Review: Options Report 107607
Final Report 16/01/2019 Page 16/ 811.6 Technology as a Disruptor and Enabler in the Transport 1.6.5 While the debate continues around this definition of MaaS, generally
Sector it is expected that we see a role for an organisation as a ‘MaaS
Provider’ who’s purpose is to develop a service offering for customers
1.6.1 With the array of changes outlined above, the traditional transport to access a range of transport assets and services. This would typically
system, including bus, is being both disrupted and enabled by the involve bringing together a range of transport providers, ideally
arrival of new types of services and delivery models. The often- across a wide range of modes and including public transport, and
referenced Uber example, of the rapid market penetration of a new packaging this to allow flexibility and added value compared to simply
style of service, has forced many established transport providers (and owning a private vehicle. There is also a major role for data providers
planners alike) to fundamentally rethink what their potential users and integrators to facilitate the seamless flow of information
see as important, and how responsive they need to be to meeting between key actors across this value chain.
those needs as part of their service offering.
1.6.6 Features of the MaaS service offering include things such as:
1.6.2 A wave of concepts around user-focused transport have risen as part A personalised service relationship and account, usually accessed
of this debate, with huge market potential emerging for real through a smartphone app in the first instance;
innovators to enter the transport sector. The Transport Systems Journey planning, based on personal preference for a range of
Catapult (TSC), which seeks to enable innovation in the UK’s transport requirements such as cost, mode, and time;
sector, values the global intelligent mobility sector at £900 billion per An easy transaction for information, booking and payment,
annum by 2025.19 generally incorporating a choice of payment, such as pay-as-you
Mobility as a Service go, or a monthly subscription; and
Flexibility and the ability to react to changes on-the go, with the
1.6.3 One of the most popular of such concepts is that of Mobility as a user kept informed and able to make decisions in real-time.
Service (MaaS), which is generally promoted as putting the customer
first and building mobility systems around their preferences or needs. 1.6.7 A MaaS case study from the UK is provided later in this report in
Section 4 when introducing potential delivery models for the CPCA
1.6.4 The TSC defined MaaS as: “Using a digital interface to source and
manage the provision of a transport related service(s) which meets
the mobility requirements of a customer”20 in its report on
opportunities for MaaS in the UK.
19 20
TSC, Imagine: Driving Intelligent Mobility, Review 2016-2017, 2017: p4, available at TSC, Mobility as a Service: Exploring the Opportunity for Mobility as a Service in the
https://ts.catapult.org.uk/2017/08/14/mobility-service-new-paradigm/, accessed on UK, 2016, available at https://ts.catapult.org.uk, accessed on 25/10.2018
25/10/2018
CPCA Strategic Bus Review
Cambridgeshire and Peterborough Strategic Bus Review: Options Report 107607
Final Report 16/01/2019 Page 17/ 81area. Studies regarding developing the framework for MaaS also any potential ability to use a carrot and stick approach to achieving
exist, such as the Swedish case study produced by Holmberg et al.21 policy objectives.
1.6.8 MaaS is currently being explored as part of the Smart Cambridge 1.6.12 There are very real potential benefits from concepts such as MaaS. A
workstream noted previously.22 Work currently includes, working truly integrated and accessible one-stop-shop platform could offer a
with local operators to explore data availability; auditing transport great opportunity through which to present potential users with a
data availability; investing in the MotionMap real-time travel app; suite of attractive sustainable transport options and potentially
making data from the Intelligent City Platform (ICP) available for re- promote positive transport choices. However, there is also the real
use (see Section 1.5.15); and researching integrated ticketing (see potential that providers of concepts such as MaaS, who are likely to
Section 1.5.12). have a role in shaping peoples’ travel behaviours, may be almost
entirely policy agnostic or may even have a vested interest in
1.6.9 Again, exploring opportunities across the wider CPCA is a key point promoting behaviours at odds with transport policy.
for this review.
1.6.13 It is vital, therefore, that bodies like the CPCA and local and regional
Opportunities, Risks, and Engaging Positively with Technology
authorities, engage in some way with these emerging concepts of
1.6.10 Technology providers (big and small) and other third parties, are well mobility, as well as other innovations in transport. By being involved
positioned to enter this emerging mobility market. They can make the early, there is the opportunity to take a seat at the table and help
most of any existing customer relationships, their experience in areas shape how these new mobility services and technologies evolve.
such as advanced data analytics, and their head-start in user focused Without this early involvement, an opportunity may be missed as
design, to integrate services and provide an attractive offer to potential guiding roles diminish.
potential customers. They can do this without becoming a transport
operator themselves, building upon the integration of existing and
new transport systems.
1.6.11 The entrance of new players raises questions about the role of public
authorities within the transport context of the future. With MaaS
providers and other innovators potentially having a focus only on
delivering an attractive offer for end users, difficult questions have to
be considered regarding the behavioural elements of transport and
21 22
Holmberg et al, MaaS: Describing the Framework, 2016 Connecting Cambridge, Smart Travel – Mobility as a Service (MaaS),
https://www.connectingcambridgeshire.co.uk/smart-places/smart-
cambridge/mobility-as-a-service/, accessed on 28/11/2018
CPCA Strategic Bus Review
Cambridgeshire and Peterborough Strategic Bus Review: Options Report 107607
Final Report 16/01/2019 Page 18/ 812. INTERVENTIONS IN THE CITIES’ NETWORKS 2.2 Enhancing the Existing Bus Networks
Establish Minimum Levels of Service
2.1 Introduction
2.2.1 In Peterborough, analysis presented in the Part 1 SWOC report
2.1.1 Both Cambridge and Peterborough will face challenges in showed that there was a robust foundation on which to build future
accommodating significant future growth in population and enhancements, namely:
economic activity without a commensurate increase in car travel.
Strong ridership on city network;
2.1.2 While not trying to dictate the detailed planning of future bus Reasonable geographical coverage; and
networks in either city, for the reasons outline in Section 1.1.2, this Existing cross city links.
section presents a range of conceptual interventions which highlight
they types of actions which could be explored further, to tackle the 2.2.2 However, commercial pressures on the local bus operators coupled
challenges they face in each city. with the limited budget available to councils for subsidising bus
services have resulted in a more limited provision of services in the
2.1.3 It is recognised that the majority of the options outlined below would evenings and on Sundays, as described in the Part 1 report. Improved
require increased spend on public transport and that this would need services outside the main Monday-Saturday core times would be very
to be delivered through additional sources of funding. However, to valuable as they would support economic activity at all times,
deliver the ambitious targets for mode share in the area, as well as including that associated with industries with an extended shift
wider Government objectives, such as reducing air pollution and pattern (e.g. many logistic operations have a daily two-shift system,
emissions, easing social deprivation and health inequality, and or even 24/7 operations, and employment centres such as hospitals
delivering sustainable growth, options should not be discounted at will have working hours patterns which differ significantly from the
this early stage because they represent a step-change in delivery and conventional Monday-Friday routines). A consistent offer for users
resources. Having noted this, it is also recognised that issues such as also provides confidence in bus options and reduces uncertainty in
cost cannot simply be ignored, and therefore options for new delivery the decision-making process where evening or weekend travel is
models and funding are provided later in this report, in Sections 4.5 involved. An example of daytime to evening/Sunday service is
and 4.6 respectively. provided in Table 1.
2.1.4 Longer-distance inter-urban travel to/from the cities, and rural The concept of ‘minimum levels of service’ can be used to provide
transport services are covered in more detail is covered in the a more equitable network across time periods by adopting rules
following section on rural and inter-urban transport; this section is of provision for evening and Sunday services which relate to the
focused on travel within the two cities themselves. core daytime frequency. This could be explored for both cities.
CPCA Strategic Bus Review
Cambridgeshire and Peterborough Strategic Bus Review: Options Report 107607
Final Report 16/01/2019 Page 19/ 81Table 1. Example of Relationship of Daytime to Evening/Sunday Bus Frequencies 62. Peterborough – Werrington – Glinton – Maxey; and
MINIMUM EVENING AND 63. Peterborough – Newark Sainsburys – Keys’s Park.
MAIN DAYTIME FREQUENCY SUNDAY FREQUENCY
BASED ON MON-FRI 0900-1700 PROVISION PROVIDED MON-SAT AFTER 1900, AND 2.2.6 With the exception of the 61 (hourly), these do not offer consistent
SUNDAY 1200-1800 frequency across the day, with the 62 offering a service every 3 hours,
60 offering five services a day, and the 63 offering two/three services
Every 10 minutes or more frequently At least every 20 minutes a day depending on direction of travel.
Every 12-15 minutes At least every 30 minutes 2.2.7 The existing Citi services 1 and 3 offer access to two of the three most
deprived areas within the city. High frequencies (every 10 minutes)
Every 20-30 minutes At least every 60 minutes are offered on these routes during the day, however, evening and
Sunday services delivered to the relative levels described above
No service unless required by specific would represent an increase.
Less frequent than every 30 minutes
demand
2.2.8 The 61 service provides access to the third area of deprivation,
Committed Equity of Access for Areas of Deprivation although the frequency is noted to be hourly, and does not include a
weekend service. This falls short of many of the less deprived areas
2.2.3 To ensure that local residents have equitable access to the
in the city.
opportunities growth will generate, bus services to deprived areas
should be priorities for support and enhancement, including evening 2.2.9 In Cambridge, there are relatively few areas of deprivation, with only
and Sunday provision to support the maximum possible accessibility two areas ranked in the top 20% most deprived in the country, and
to employment opportunities. six within the top 30% most deprived. The deprived areas are located
in the east and north of the city and are currently relatively well
2.2.4 Peterborough faces some specific challenges associated with
served by bus services to the city centre in the peak, although this
deprivation, with a significant proportion of the urban area ranked
may not be the final travel destination of these bus-users.
within the 10% to 30% most deprived areas in England.
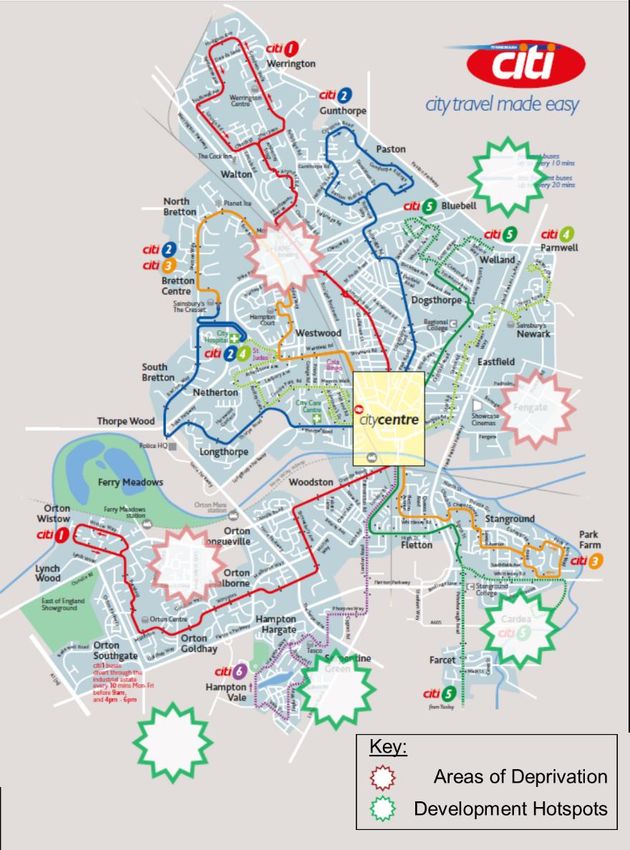
2.2.5 Figure 4 highlights the three worst areas of deprivation in A commitment could be made to serve areas of high deprivation
Peterborough identified in the Part 1 report, and the Citi bus services with a defined ‘attractive’ level of service provision, reviewed
across Peterborough. In addition to these Citi services, there are the regularly to ensure this is in line with the most attractive service
60, 61, 62, and 63 services: levels provided in each city in terms of single service frequency.
60. Peterborough – Hampton – Orton; As growth takes place, areas of deprivation should be prioritised,
61. Peterborough – Fengate – Newark Sainsburys; where possible, to ensure that they have access to new
CPCA Strategic Bus Review
Cambridgeshire and Peterborough Strategic Bus Review: Options Report 107607
Final Report 16/01/2019 Page 20/ 81employment opportunities, and services (such as retail, health, Figure 4. Peterborough Citi Bus Route Map with Main Areas of Deprivation &
and education) are maximised. Development
Enhanced Radial Bus Services in Peterborough
2.2.10 Providing improved bus services in isolation is unlikely to be
successful – what will be critical is providing worthwhile links to
existing and emerging centres of economic activity, some of which
are also highlighted on Figure 4.
2.2.11 In Peterborough, continued growth of the outer suburbs will result in
extended journey times from these suburbs to the city centre if
existing bus services are simply extended further out and other
measures are not put in place to speed up services.
2.2.12 In some cases, Section 106 Agreements may be leveraged to provide
changes to the network, however, where this is not possible,
additional funding sources would need to be considered. Constraints
on local authority budgets make it unlikely that this funding would be
available via this avenue in the short term at least, and so alternative
sources would be needed.
Where growth is targeted at specific outer suburban locations,
then bus services could be reconfigured to offer more direct
linkages to the city centre.
By this reasoning, examples of such changes would be to provide
enhanced or new peripheral links between:
CPCA Strategic Bus Review
Cambridgeshire and Peterborough Strategic Bus Review: Options Report 107607
Final Report 16/01/2019 Page 21/ 81 City Centre – Norwood & Paston 2.2.15 Pairing of services can only occur in conjunction with either a
reduction in congestion or adequate bus priority interventions which
City Centre – Hampton
ensure punctual and reliable operation throughout the network.
City Centre – Great Haddon Suggestions for this are covered later in this chapter.
A funding arrangement which does not rely solely on s106
Agreements may be required to ensure this is feasible where Consider the feasibility of providing targeted cross-city services
required most. for high demand movements, aligned to congestion reduction or
bus priority interventions.
Bus Service Pairs could be Cross-linked across Cambridge City
Centre
2.2.13 In Cambridge, the network is slightly less optimised than
Peterborough, partly because increasing traffic congestion has meant
that many of the formerly cross-city services now operate separately
either side of the city centre. Congestion can affect reliability and
make cross-city service difficult to deliver. The offset nature of the
railway station (south-east of the city centre) and concentrations of
activity around Addenbrookes Hospital (also to the south-east of the
city) mean reliable cross-city links would be particularly valuable in
Cambridge.
2.2.14 Where possible, it would be beneficial for pairs of services to be
linked across the city, removing interchange requirements, and
potentially improving journey times for key movements. The Part 1
SWOC accessibility analysis showed that journey times from north to
south are particularly impacted. With much of the residential
development being in the north of the city, and employment in the
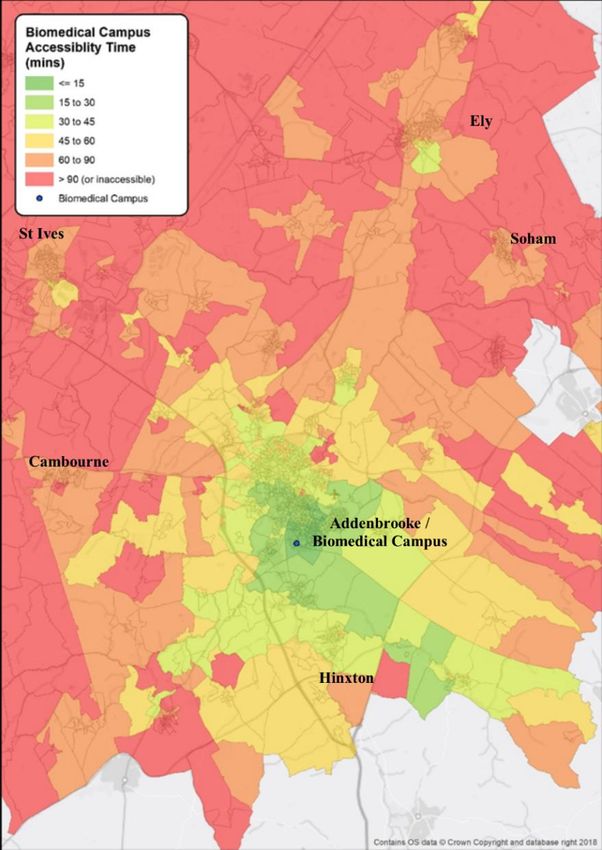
south, this represents a real issue for daily commuter trips. Figure 5,
shows the journey time by public transport for access to the
Addenbrooke and Biomedical Campus in the morning peak, with
journey times in the north typically up to 45 minutes, with almost 10
minutes of this being made up by interchange in the city centre.
CPCA Strategic Bus Review
Cambridgeshire and Peterborough Strategic Bus Review: Options Report 107607
Final Report 16/01/2019 Page 22/ 81Figure 5. Addenbrooke / Biomedical Campus Accessibility – Journey Time Map
Evolve into a ‘turn-up-and-go’ Network
2.2.16 Some areas of both Peterborough and Cambridge are served by lower
frequency services, and although there is a need to ensure value for
money from all bus operations, we suggest considering an option to
reviewing the potential to enhance frequencies to make services
more attractive. Turn-up-and-go bus services need to operate at
least every 12 minutes to be attractive, and many bus services in
Peterborough and Cambridge fall below this standard.
2.2.17 Engagement with local authorities has highlighted that funding is
currently an issue, with cuts to costs required in the short term;
therefore, enhancements to services would potentially require new
avenues of funding to be considered. However, as discussed later,
accelerating bus services through targeted bus priority, and accepting
adverse impacts on other road users along selected corridors, could
support improved bus frequencies without excessive additional costs.
2.2.18 A turn-up-and-go frequency has also been suggested in the GCP’s
First and Last Mile Strategy23 in relation to Park & Ride (P&R) travel
hub sites only, but as a longer-term strategy could be something
which is aimed for across the majority of the core network.
Consider targeting the creation of a turn-up-and-go service. This
would largely require enhancing all major radial corridors from
Peterborough and Cambridge city centres to at least a bus every
12 minutes (Mon-Sat daytime).
23
GCP, Greater Cambridge CaMKOx First/Last Mile Strategy, September 2017.
CPCA Strategic Bus Review
Cambridgeshire and Peterborough Strategic Bus Review: Options Report 107607
Final Report 16/01/2019 Page 23/ 81You can also read