Overview - Sustainable Energy Africa
←
→
Page content transcription
If your browser does not render page correctly, please read the page content below
Sustainable Transport

Overview
Transport enables trade, commerce, employment, social interaction and indeed brings people together out of their
immediate communities in a national and increasingly global life. Still mostly relying on fossil fuel and using roads
shared by multiple competing modes including private vehicles designed for very high speeds and accelerations,
transport is also characterised by many negative externalities. These include urban congestion, being a dominant
source of local air pollutants, a major source of greenhouse gases and accounting, in South Africa, for 12 944
fatalities in accidents in 2015 and many more serious injuries annually of which pedestrians constitute over a third
(RTMC, 2016).1
In countries like South Africa that are reliant on rapidly increasing quantities of crude oil to fuel its transport system,
there are additional risks to energy security and a negative impact on the national balance of payments. Given the
complexity of transport systems it is not possible to explore the details of all the social costs and risks that make
current transport systems unsustainable and furthermore impractical to detail the many policy and engineering
solutions being attempted to mitigate these costs. However it is possible to articulate some key sustainable
transport concepts, present broad best practice in policy and planning and feedback key lessons from recent
transport projects in South Africa, as much as they exist in the public domain.
Transport is becoming an increasing priority for local government in South Africa, particularly in the large metros.
This was given considerable momentum by the hosting of the 2010 World Football Cup which saw investment
at scale by national government in the transport infrastructure of hosting cities. Efforts have generally been
focussed on bus rapid transit (BRT) systems although Gauteng has also seen the implementation of the Gautrain
high speed rail system and there is now a considerable body of experience from which to draw lessons from both
successes and failures. The large projects undertaken, have generally not been primarily motivated by aspirations
for sustainability and rather respond to growing congestion and the persistent problem of access to transport in
cities and towns subject to sprawl and the location of poor communities on the urban periphery. Cities stand to
gain considerably however in many spheres, long term efficiency not the least, by orientating transport policy
and its implementation toward goals of sustainability. Investment in public transport, particularly, can offer social,
economic and sustainability benefits.

Key concepts and features of the transport system
Below are some key concepts that underlie sustainable transport policy and technology levers and give an overview
of the transport system in South Africa in a sustainability context.

The impacts of transport on sustainability
As alluded to above, the transport system has many impacts which are borne both by individuals and society at large.
The current transport system and the urban environment that it serves however arose in response to the needs and
desires of people and persists as a result of strong drivers. The impacts and drivers of a petroleum fuelled car centred
transport system are contrasted in Figure 1 below. A great many costs and benefits, some quite intangible, are at play.
In general, the persistence over time of a pattern of car ownership and sprawl as a society’s income grows, would
suggest that people have been willing to pay for the impacts of the transport system. Wealthier countries have
also been able to partially mitigate some impacts such as accidents and local air pollutants through regulation and
enforcement. Transport globally is however a significant contributor to greenhouse gas emissions that pose a high

1 Road Traffic Management Corporation (RTMC) (2016) Cost of Crashes in South Africa Research and Development Report.
Municipal Initiatives
risk of negative and potentially catastrophic climate change. This has proved difficult to mitigate with the growth
of the world population and economy despite the emergence of low carbon technologies. The rapid growth of
cities in developing countries has also seen serious congestion and marginalisation of the poor due to constrained
mobility that threatens the transition of these societies to a more prosperous and equitable level. This has seen
renewed pressure and new thinking directed at changing the transport system and the urban form which it serves.
The rapid growth of Figure 1: Contrasting the impacts and drivers of a petroleum fuelled car
cities in developing centred transport system
countries has also seen
serious congestion
and marginalisation
of the poor due to
constrained mobility that
threatens the transition
of these societies to
a more prosperous
and equitable level.
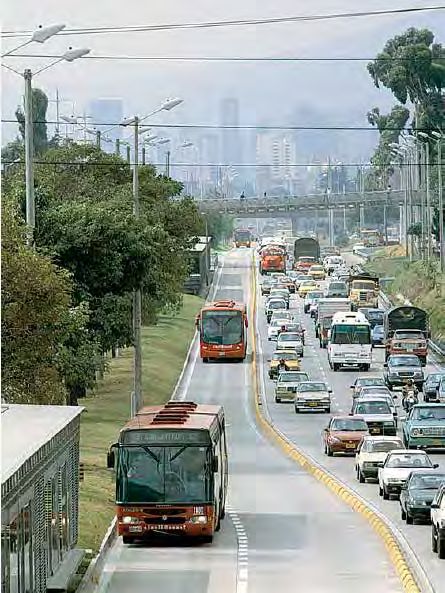
Mode choice and congestion
As shown in Figure 2 below, cars cause congestion in cities because they take up a lot of space. Motorcycles or
bicycles take up less but there are safety risks unless there are dedicated lanes for the latter. Buses are safer and
take up far less road space.
88
Sustainable Transport

  Figure 2: Passenger Modes and their Use of Road Space
                                                                                                         This set of photos
                                                                                                         demonstrates how the use of
                                                                                                         public transport, cyclists or
                                                                                                         private motorbikes over the
                                                                                                         use of private cars can reduce
                                                                                                         congestion in a city. Each
                                                                                                         option will transport the same
                                                                                                         amount of passengers!

  Source: Cycling Promotion Fund

Emissions from conventional                Figure 3: Sources of Toxic and Greenhouse Gas emissions from Motor
Internal Combustion                        Vehicles and their relative scale in new technology Euro 6 petrol and
Engine (ICE) vehicles                      diesel vehicles

The gaseous and particulate
emissions from motor vehicles,
particularly when petroleum
fuelled, is a major source of impacts
from transport. The main types of
emissions and their relative scale in
new technology petrol and diesel
passenger cars is shown in Figure 3
Diesel light vehicles typically
produce in the region of 10% less
CO2 than petrol fuelled equivalents
however as shown below for some
recent passenger car models from
the South African market, vehicle
size generally has a much greater
impact on emissions. This is because
larger vehicles will consume more
energy when accelerating because
of their higher mass and in certain
cases are less aerodynamic and
have more rolling resistance
due to bigger tyres (SUVs).
                                           Source: Pastorello & Mellios (2016) Explaining road transport emissions –A non-technical guide.
                                           Copenhagen: European Environment Agency (EEA) adapted from the European Environment Agency.

                                                                                                                                             89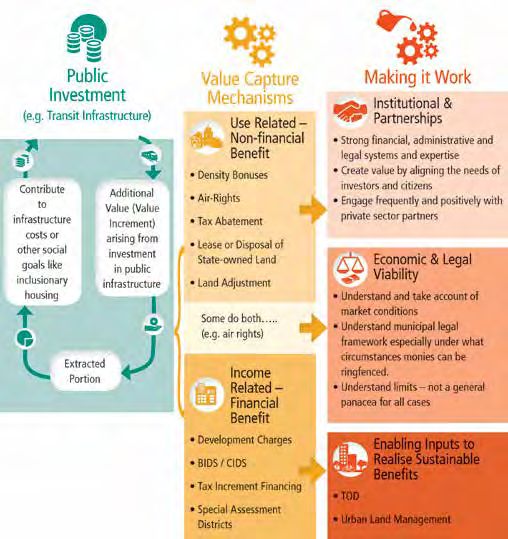
Municipal Initiatives

            The gaseous and                        Figure 4: relative impact of engine type and vehicle size (engine capacity in
        particulate emissions                      litres used as proxy) on CO2 emissions as illustrated by selected recent light
                                                   vehicle models
         from motor vehicles,
            particularly when
            petroleum fuelled,
         is a major source of
      impacts from transport.

                                                   Source: data from manufacturer’s published specifications

     Useful transport indicators
     In order to usefully quantify the demand for transport it is common to define it in terms of the following indicators:
     yy Trips – a single journey for one or more defined purposes e.g. work trips
     yy Vehicle kilometres (vkm) – The total distance travelled by a vehicle or fleet of vehicles in a specific time period.
        Longer trips will clearly require more vehicle km.
     yy Passenger kilometres (pkm) – the distance travelled by a single commuter for one or more trips e.g. A minibus
        with 10 passengers travels 1 km = 10 pkm. A car with one passenger travels 10 km = 10 pkm. Clearly then if
        there are more passengers in a vehicle there are more pkm for the vkm travelled.
     yy Tonne kilometres (tkm) – The distance travelled by a tonne of goods for one or more trips e.g. A truck with a 10
        tonne payload travels 1 km = 10 tkm. A pickup/bakkie with a 1 tonne payload travels 10 km = 10 tkm
     These indicators can be extended to energy and emissions as follows:
     yy Fuel Consumption (litres/100 km) – Most of us are familiar with this indicator usually expressed as litres of fuel
        consumed per 100 km travelled (litres/100 km) or its inverse Fuel Economy which is kilometres travelled per
        litre of fuel consumed (km/litres).
     yy Specific Fuel Consumption (litres/pkm or litres/tkm)– If the occupancy or payload of the vehicle is divided into
        fuel consumption it is possible to calculate the volume of fuel required to deliver a passenger km or tonne km
     yy Energy Intensity (MJ2 /pkm of MJ/tkm) – Liquid fuels have quite consistent energy content, termed the Lower
        Heating Value (LHV) or Net Calorific Value, which for petrol is about 33 MJ/litre and for diesel about 36.5 MJ/
        litre. By multiplying this by Specific Fuel Consumption it is possible to convert to Energy Intensity. The fuel
        economy of an electric car is frequently expressed as kWh/km but this is easily converted to MJ/pkm by the
        factor 3.6 MJ/kWh.
     yy CO2 Intensity (g CO2/pkm or g CO2/tkm) – As shown in Figure 3 above, liquid fuels are mostly carbon atoms and
        most of this becomes CO2 in the combustion process. Given the narrow range of specifications of petrol and

     2 MJ is the symbol for Megajoule which is equivalent to 1 million Joules of energy

90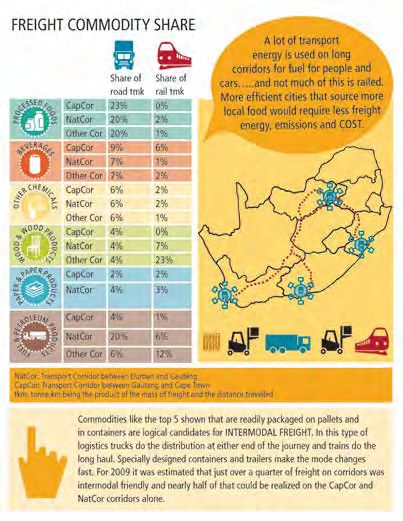
Sustainable Transport

   diesel, carbon content is quite consistent. Thus it is possible to readily estimate the amount of CO2 in grams
   generated per pkm delivered by multiplying our energy intensity by emissions factors. These are around 75 g
   CO2/MJ for diesel and 72 g CO2/MJ for petrol. An electric car would not produce CO2 emissions from the car at all.
yy Wells to Wheels CO2 intensity (g CO2 /pkm or g CO2 /tkm) – The emissions attributable to a trip are not just
   produced by the vehicle however. There can be considerable emissions produced in the supply chain of
   the fuel (including electricity) at mines, oil refineries and power stations. This is particularly important when
   assessing the impacts of electric vehicles fuelled by coal-fired power as discussed below in more detail.
yy Lifecycle CO2 intensity (g CO2 /pkm or g CO2 /tkm) – There are also emissions associated with the manufacture
   of the vehicle and the extraction and refining of its constituent materials like steel for the chassis and lithium
   for batteries. Including these emissions with the vehicle and fuel supply chain emissions would yield the full
   lifecycle emissions intensity. This becomes complicated to assess given the global nature of automotive parts
   production however and requires difficult to access data, complex analysis and specific expertise.
While fuel consumption will be higher for bigger and heavier vehicles, a number of factors drive a lower energy
intensity for larger public transport and freight vehicles including reduced relative losses from drag, the fact that
larger engines are generally more thermally efficient and that the cargo area/volume as a percentage of total
increases with vehicle size. It follows from this that if it possible to double the load of goods or people on a vehicle
with a marginal increase in fuel consumption large gains in efficiency when meeting transport demand can be
made. A large city bus will for instance use around 2.5 times as much fuel per km as a minibus taxi but can carry
more than 4 times as many people. This principle is illustrated for a number of examples below in Figure 5.

  Figure 5: Energy efficiency of Vehicle Types and the Impact of Occupancy on                             In the discussion above that
  Energy Intensity - Data typical of City of Cape Town
                                                                                                          LARGE and FULL vehicles will use
                                                                                                          the least energy and produce
                                                                                                          the LEAST emissions when
                                                                                                          transporting goods and people.
                                                                                                          BUT it is evident that LARGE
                                                                                                          and EMPTY vehicles will use
                                                                                                          the most energy and produce
                                                                                                          the MOST emissions when
                                                                                                          transporting goods and people.
                                                                                                          Matching the vehicle to the
                                                                                                          application or the operational
                                                                                                          circumstances is therefore
                                                                                                          extremely important. In
                                                                                                          certain circumstances this
                                                                                                          may be a minibus taxi
                                                                                                          rather than a large bus.

  Source: Kane L (2016) What do we mean by low carbon transport? Undertstanding how people move in Cape
  Town. Cape Town : Open Streets Briefing Paper

                                                                                                                                             91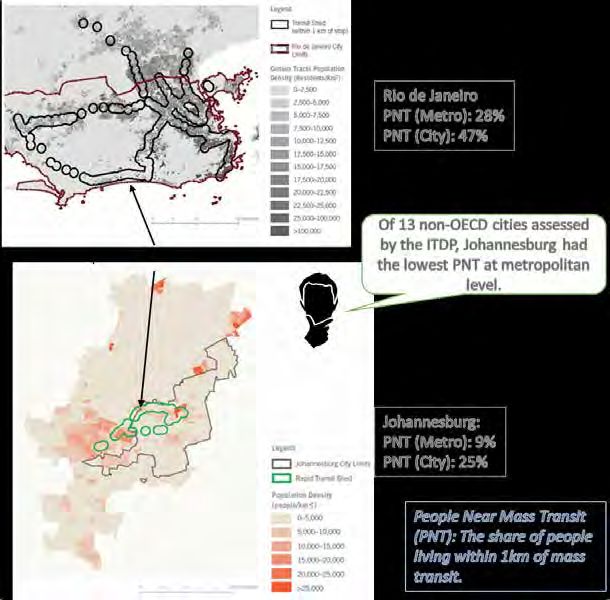
Municipal Initiatives

     Transport, the economy and the environment
     While reducing trips clearly saves energy, it is important not to lose sight of the direct relationship between trips and the
     economy. As well as being required for the exchange of goods, trips enable the personal interactions that open up new
     opportunities for people and organisations for future employment and trade. Different economic directions may be
     more or less transport intensive, but broadly transport demand will grow in lockstep with the economy over and above
     the population growth. There is thus a trade-off between economic growth and the constraints that arise on continued
     growth through congestion and the need for more transport infrastructure that may not have been priced into the cost
     of the goods being traded. The following important principles arise from this:
     yy Trips are economically beneficial but policy should aim to make these as short and efficient as possible.
     yy It stands to reason then that the design and co-location of commercial and industrial developments and the
        residential developments that feed them with labour need to facilitate trips that are as short and efficient as possible.
        See Transit Orientated Development (TOD) and Integrated Land Use Planning below.
     yy If such urban design facilitates a high proportion of non-motorised trips (walking and cycling) then substantial cost
        and emissions savings are possible.
     yy If mass transit is operated efficiently at high capacity in urban areas it can similarly have both substantial economic
        and sustainability benefits.
     yy On the other hand, public transport that poorly matches the urban environment it serves and has low average
        occupancy will have both economic and sustainability dis-benefits. This trade-off makes the operation of
        transport services extremely challenging because availability is a major component of the quality of service from
        the commuter’s perspective but unused capacity is very costly for the operator. This speaks to the importance of
        investment in the people and systems that support operations.
     yy Mechanisms need to be put in place to price the future cost of transport infrastructure into public and private goods
        and services. Land Value Capture below briefly expands on this in practice.

     Urban transport in South Africa – the passenger picture in brief
     The broad transport situation in South Africa is well understood thanks to travel surveys undertaken at national and city
     level.3, 4 As can be seen in Figure 6 below there is a marked contrast in mode choice between income groups, a very high
     share of walking trips for low-income commuters and a very high share of private car use for the highest income quintile.

       Figure 6: share of modes in daily trips by income group (calculated using national household travel survey
       2013 per person data for random travel day

     3 Stats SA. National Household Travel Survey Statistical Release P0320. s.l. : Statistics South Africa, 2013.
92
     4 Nel City of Cape Town: Secondary data analysis of the Household Travel Survey (2012) for the Low Carbon Central City Transport
       Strategy. s.l. : Report Commissioned by Open Streets http://openstreets.org.za/ (2016).
Sustainable Transport

In a large metropolitan city like Cape Town, the modal split is around 50% private to 50% public transport going
into the CBD (Nell, 2016). Surveys show that driver only car trips are over fourfold higher than passenger car trips (4)
indicating that private commuting is generally by single occupancy vehicles which leads to increased congestion
and inefficient fuel consumption with associated high levels of carbon emissions. The transport sector is currently
responsible for about 25% of carbon emissions in South African cities with the share of car ownership having
grown from 23% to 33% between 2003 and 2013. (SEA, 2015). 5
Information on people’s travel time budgets are gathered by the National Household Travel survey and this is
useful in assessing the efficiency of the transport system and if congestion is affecting this. Evidence suggests
that on average around the world and across cultures there is a preference for a daily time budget of around 1.1
hours, a number sometime referred to as the ‘Marchetti’ constant 6. Surveys suggest average time budgets in
South Africa are significantly longer than this and this tells a story of economic ‘drag’ due to transport difficulties
and growing congestion as shown below.

Table 1: Indicative Change in commuter travel times by income group between 2002 and 2013 for Cape Town

                                    2002                                    2013
  Income level                      Total Personal Time                     Work Trips (hr/day)                    Education
                                    Budget (hr/day)                                                                Trips (hr/day)
  Low                               1.6                                     1.8                                    1.0
  Middle                            1.1                                     1.9                                    1.0
  High                              0.9                                     1.7                                    1.1

Source 2002: Adapted from Behrens (2002) Findings of an activity-based household travel survey in Cape Town, with particular reference to walking as a travel mode.
21st Annual South African Transport Conference South Africa 15 – 19 July 2002.

Source 2013: Cape Town Household Travel Survey Data (separate study to NHTS) in Kane (2016) What do we mean by low carbon transport? Understanding how people move
in Cape Town, Open Streets Briefing paper, September 2016.

Table 2: Daily Work Travel Times for South Africa by income group indicated by the National Household Travel Survey
(NHTS) 2013

  Income Group                      Excl. Walking                          Including walking
                                    Only Trips (hrs)                       Only Trips (hrs)

  All                               1.6                                    1.3
  Highest quintile                  1.4                                    1.3
  Quintile 4                        1.6                                    1.4
  Quintile 3                        1.7                                    1.3
  Quintile 2                        1.7                                    1.2
  Lowest quintile                   1.6                                    1.2

Source: Calculated from the published data files for NHTS 2013 available from Datafirst, University of Cape Town

5 SEA (2015) State of Energy in South African Cities, Sustainable Energy Africa, Cape Town.
6 Schafer & Victor (2000) The future mobility of the world population. Transportation Research Part A, 34, 171-205.

                                                                                                                                                                      93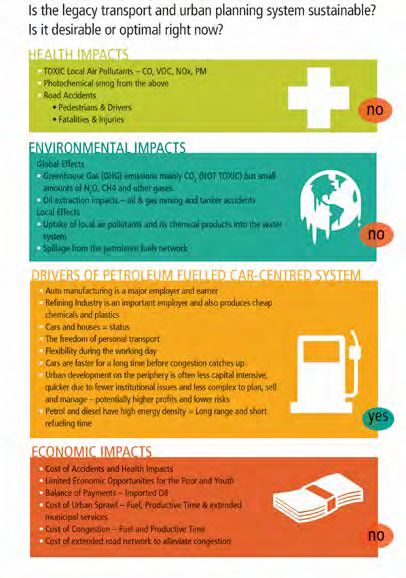
Municipal Initiatives

     The data suggests the following:
     yy In Cape Town, whereas 10 years ago the car mode was a lot faster than public transport, evidence suggests this
        gap has closed significantly due to congestion.
     yy National figures for travel time are also very high relative to global norms although the car mode (high income)
        still has an advantage (dominates highest income quintile).
     Informal or semi-regulated minibuses remain the dominant form of public transport in South Africa with an
     increased modal share indicated between 2003 and 2013, having apparently attracted learners and workers from
     walking, despite increased public investment in formal public transport. Available public transport services differ
     across cities. In most cities there are bus and minibus taxi systems, with rail found in the main metropolitan
     cities, but not in the smaller cities (Stats SA, 2013).7 City bus and train systems provide the most efficient forms of
     transport in terms of energy per commuter kilometre; however, even though these are by and large the same price
     or cheaper than minibus taxis, they are sometimes underutilised. This is due to:
     yy Inconvenience. Bus and train systems do not service many informal settlements and efficient feeder systems
        to nodes in main routes are frequently not in place.
     yy Unreliable reputation although the perception of service of some BRT systems is good. The high end Gautrain
        has high levels of satisfaction but is expensive
     yy Perception that they are slower than taxis.
     yy Safety concerns, particularly on Metrorail trains.
     There is a need not only for continued investment in large scale infrastructure to improve the formal public
     transport system but also investment in its operational systems in terms of security, fare systems and responsive
     operational management in order for it to improve its current share of commuters.
     For many years scheduled bus services were operated by concessions to private operators such as Golden Arrow
     bus Service in Cape Town and Putco in Durban, administered by provincial government effectively operating on a
     substantial subsidy basis to cover areas and times of low demand. With exceptions, in general the quality of service
     has been low in terms of commuting speed, accessibility and reliability and on occasion subject to serious abuses
     of the subsidy. The Department of Transport and Metro Authorities took the opportunity of the 2010 World Soccer
     Cup to act strongly in favour of transport system reform. Large public transport projects initiated in South African
     cities in the last 10 years include the following:
     yy Gautrain high speed rail – Gauteng
     yy Rea Vaya BRT System – City of Johannesburg
     yy A Re Yeng BRT System – City of Tshwane
     yy MyCiti BRT System – City of Cape Town
     yy GoDurban Integrated Rapid Public Transport Network (IRPTN) – eThekwini
     yy GoGeorge Integrated Public Transport Network (IPTN) – George
     yy Libhongolethu Integrated Public Transport Network (IPTN) – Nelson Mandela Bay Municipality
     yy Yarona – Rustenburg’s rapid transport service
     yy Ekurhuleni’s Harambee Bus Rapid Transit (BRT) has undertaken initial testing and is set to launch in July 2017 8
     yy Polokwane’s Municipality’s Integrated Rapid Public Transport Service (IRPTS) is reported to be on schedule to
        go live in March 2018 9
     yy Buffalo City, Mangaung and Msunduzi completed public transport network development planning and service
        contract designs in 2013/14 10 but the current status of these projects is unclear.

     7 Stats SA (2013) National Household Travel Survey Statistical Release P0320.
     8 http://ewn.co.za/2017/02/08/watch-ekurhuleni-test-for-long-awaited-brt-system
94   9 http://www.observer.co.za/integrated-rapid-public-transport-service-on-track/
     10 http://www.gov.za/about-government/government-programmes/bus-rapid-transit-system-brt
Sustainable Transport

Despite vast capital expense, these projects have not however, in the view of some, delivered affordable and
financially sustainable public transport. This is primarily, it is believed, because urban densities are generally low and
where residential densities are high in former apartheid era townships, economic opportunities and infrastructure
are limited and distances to potential work long, resulting in inefficient cities with long travel times. The costs of
transport services and doing business are therefore high and this combined with the limited purchasing power of
the lower income cohorts who are the primary public transport users, results in a smaller share of public transport
costs being recovered than is generally the case in the rest of the world as shown in Figure 7 below.

  Figure 7: Cost recovery Rate of Public Transport in South Africa compared to Selected Regions and Costs per Trip of
  Modes

  Source: National Treasury (2014), Performance and Expenditure Review - Public Transport, Government Technical Advisory Centre, National Treasury, Pretoria.

Also evident from Figure 7 is that while very large sums are spent on transport subsidies none of it, since the
winding down of a difficult and sporadic taxi recapitalisation programme, is now spent on minibus taxis, the
mode which conveys the vast majority of public transport passengers.

                                      City bus and train systems provide the
                                    most efficient forms of transport in terms of
                                     energy per commuter kilometre; however,
                                     even though these are by and large the
                                    same price or cheaper than minibus taxis,
                                         they are sometimes underutilised.

                                                                                                                                                                95
Municipal Initiatives

     Urban transport in South Africa – the freight picture in brief
     South Africa’s large cities are geographically dispersed across a large land area with its economic hub of Gauteng
     on an inland plateau, relatively far from the nearest port. It has been described as having a ‘spatially challenged’
     economy (CSIR, 2013)11 and the corridors between the major cities dominate the demand for general freight
     (excluding mining commodities) with most of that supplied by road transport as shown below.

       Figure 8: Distribution of General Freight Demand in the South African Economy in 2014

       Source: Havenga, JH, et al. (2016) Logistics Barometer South Africa 2016, Stellenbosch University

     Metropolitan freight actually contributes almost 50% of the total volume of freight demand in tonnes compared
     to 16% for corridor freight, but the shorter distance reduces its share of total freight tonne-km to around 15%. The
     energy and emissions intensity of freight transport varies markedly by mode as shown below with rail typically
     producing a third of the emissions of long haul road transport and a tenth of smaller rigid trucks.

       Figure 9: Typical CO2 equivalent Emissions Intensities of Freight Modes

       Source: WWF (2013), Low Carbon Frameworks: Transport - Understanding Freight Emissions, World Wildlife Fund

96   11 CSIR (2013) 10th Annual State of Logistics Survey for South Africa 2013 – Bold Steps Forward, Council for Scientific and Industrial
        Research (CSIR).
Sustainable Transport
When corridor freight is regarded at a commodity level it is easier to see
opportunities for making logistics more sustainable. As shown below Corridor Freight
on some corridors the most freight, energy and emissions intensive
commodities emissions are processed food and petroleum fuels. This
and Intemodal
presents opportunities for reducing emissions by localising food or tolling Transport
certain commodities that make the whole intercity journey by truck.
Solutions
Figure 10: opportunities for intermodal freight transport for key A lot of freight tonne.km is
commodities and the freight impacts of moving petroleum fuels on major metropolitan as expected but
corridors in South Africa (2009 Data) nearly double this is on the
corridors between metropoles:
It’s not in the city but it’s of
the city.
It can see that rail is much less
emissions intensive and fuel
consumption and costs are
lower but that it has a minority
share of corridor freight. Rail
lost market share because of
speed and convenience but
with new methods rail can be
used in an efficient, cleaner and
cheaper logistics process with
intermodal transport.
“The process of intermodal
transport consists of short-
distance road feeder services
to an intermodal terminal in
a logistics hub where freight
is consolidated into main-
line block trains running the
length of the corridor to a
destination terminal. From
the destination terminal, it
is transported to distribution
centres or end destinations
via road transport”,
Source: Adapted from Centre for Supply Chain Management, Department of Logistics, University of Centre for Supply Chain
Stellenbosch and the WWF
Management, Department
van Eeden & Havenga (2010) Identification of Key Target Markets for Intermodal Freight Transport Solutions
in South Africa. Journal of Transport and Supply Chain Management. of Logistics, Stellenbosch
University.1
The use of intermodal freight transport solutions does not have to damage
the trucking industry because the number of trucking trips actually 1 Havenga, Simpson, Fourie & de
increases but they are far shorter. In fact the trucking companies would Bod (2011) Sustainable Freight
do as much or more logistics but their costs in terms of overtime, fuel Transport in South Africa:
Domestic Intermodal Solutions.
costs, maintenance and insurance decrease. Consequently a joint venture Journal of Transport and Supply
between road hauliers and the rail utility could benefit all parties12. Chain Management.
97
12 Centre for Supply Chain Management, Department of Logistics, University of
Stellenbosch and the WWFMunicipal Initiatives
Electromobility in South Africa and potential impacts
on sustainability in the short and long term
Electromobility refers to a broad category of vehicles which are generally characterised by having electric motors
drive the wheels some or all the time instead of mechanical drive from an internal combustion engine. These include
the following:
yy Battery Electric Vehicles (BEV): Where externally charged batteries are the energy source
yy Hybrid Vehicles: These have come to refer broadly to a hybrid of a battery electric vehicle and a combustion
engine and fall into two main categories:
yy Non Plug-in Hybrids: Also termed ‘conventional’ hybrids these vehicles are never connected to an external
electricity source. The battery is kept charged by recovering braking energy and the combustion engine if
necessary.
yy Plug-in Hybrids: Plug-in hybrids can be fueled with both petroleum fuel and electricity from a filling pump or
charger. The driver now has much more control over the share of electricity and petroleum fuel they use and can
respond to the limits on availability of either. Some types of plug-in hybrids are called Extended Range Electric
Vehicles (EREVs).
yy Fuel-Cell Vehicles (FCV): Fuel Cells produce electricity from on-board hydrogen fuel. The electricity produced by
the fuel cell can either supply the wheel motors directly or charge a battery, effectively acting as a range extender.
Battery electric vehicles, in general, have higher capital costs than conventional petroleum fuelled vehicles although
prices are dropping with battery costs having fallen by a factor of 4 since 2008 (IEA, 2016)13. Electricity is furthermore
significantly cheaper than diesel in most countries, including South Africa and maintenance costs are claimed to be
around 30-50%14 cheaper for battery electric vehicles. This may in certain circumstances offset a price premium over
the lifetime of a high mileage vehicle like a public bus. Caution should however be exercised around the full costs
of charging infrastructure, particularly if a project aim is to power vehicles with ‘green’ energy as discussed below.
While battery electric vehicles produce zero emissions from the vehicle itself, there may be considerable emissions
associated with the fuel supply chain. In South Africa most electricity is produced from coal and therefore the
emissions from coal power stations needs to be taken into account when comparing the current emissions of an
electric car operating in South Africa to those of a petroleum fuelled vehicle. In addition, the supply chain of South
African petroleum fuels is also higher emitting than globally typical particularly in terms of CO2 because of a large
Coal-To-Liquids (CTL) refinery 15.
To assess the current environmental benefits of electromobility the emissions need to be estimated for the supply
and production of the fuel and electricity as well as those from the vehicle itself (wells-to-wheels basis). The results of
such an assessment for selected passenger car models is shown below in Figure 11 and Figure 1216. The discretionary
choice of whether to drive a big car or a small car makes a big difference to energy economy as demonstrated
above and small conventional cars currently give rise to lower GHG emissions than battery electric vehicles in the
South African context if CTL emissions are not considered. In this case non-Plug in hybrids seem to give rise to
the least GHG emissions. If CTL is included at its national production share, battery electric vehicles significantly
outperform gasoline fuelled conventional vehicles on a GHG emissions basis but small diesel fuelled IC engine
cars are comparable because the CTL refinery produces proportionally less diesel.
13 IEA (2016) Global EV Outlook 2016 – Beyond one Million Electric Cars. International Energy Agency, Paris.
14Fuso Trucks: http://media.daimler.com/marsMediaSite/en/instance/ko/World-premiere-the-new-all-electric-Fuso-eCanter.
xhtml?oid=13669591; BYD Buses: http://www.tct.gov.za/docs/categories/1562/Alternative%20transport%20solutions.pdf
15 The CTL production process produces liquid fuels from coal by first gasifying the coal and then liquefying the gaseous products
by catalysis in a relatively energy and greenhouse gas intensive series of processes.
16SEA (2016) Well-to-Wheels Greenhouse Gas Emissions and Energy Comparison between Battery Electric Vehicles, non-Plug
98 in Hybrids and Conventional Passenger Cars for South Africa. http://www.cityenergy.org.za/uploads/resource_401.pdf; Excel
Calculator: http://www.cityenergy.org.za/getfile.php?id=400&category=7Sustainable Transport
Figure 11: Wells-to-Wheels GHG Emissions for selected model passenger cars when CTL production is excluded from
refinery supply system
Source: SEA (2016). Well-to-wheels greenhouse gas emissions
BEV: Battery Electric Vehicle, ICE: Internal Combustion Engine, NPIF: non-plug in hybrid. The models have been selected to cover a range of manufacturers and illustrate a
range of emissions. For ICE vehicles the higher emitting models are heavier vehicles with bigger engines.
Figure 12: Wells-to-Wheels GHG Emissions for selected model passenger cars when CTL production is included in the
Refinery Supply System
Source: SEA (2016). Well-to-wheels greenhouse gas emissions
BEV: Battery Electric Vehicle, ICE: Internal Combustion Engine, NPIF: non-plug in hybrid. The models have been selected to cover a range of manufacturers and illustrate a
range of emissions. For ICE vehicles the higher emitting models are heavier vehicles with bigger engines.
99Municipal Initiatives
Assuming, however, that 25% of battery charging is shifted from using the national grid to off-grid solar embedded
generation at home and the workplace and that nuclear and renewable generation rises to a 25% share of grid
electricity, then GHG emissions from the operation of battery electric cars would drop to around half of even small
conventional cars and non-plug in hybrids as shown below.
Figure 13: Simulated Wells-to-Wheels GHG Emissions for Selected Model Passenger Cars when CTL production is
included in the Refinery Supply System and 25% of BEV Charging is Embedded PV and Grid Electricity is 25% Nuclear/RE
Source: SEA (2016).
In general, South Africa’s coal intensive electricity supply means that the operational wells-to wheels GHG emissions
from battery electric passenger cars are comparable to compact conventional passenger cars operating on crude
oil distilled liquid fuels despite the far superior energy efficiency of the electric vehicles. This gives non-plug in
hybrids a GHG emissions advantage in areas solely supplied by conventional refineries. There is however significant
synthetic CTL fuel production in South Africa and if this is taken into account at its national share of production,
then battery electric cars start to offer significant GHG emissions advantages over compact gasoline fuelled cars.
Diesel fuelled cars are still comparable17 because the CTL production is more gasoline heavy. Clearly then, in areas
that are exclusively or mostly CTL supplied (such as areas of Gauteng), electric cars are significantly lower emitting
on a relative basis with the caveat that if fuel demand were to drop in those areas because of electric cars, the CTL
fuel would simply be distributed elsewhere given the nature of the supply system in the country.
If 25% of Battery electric vehicle charging is however shifted from the national grid to embedded solar supply
at home and work and the grid electricity supply shifts to 25% nuclear and renewable sources, both attainable
targets, then the operational GHG picture shifts unambiguously in favour of battery electric cars. The shift to
carbon free energy sources supplying the electricity grid will however likely take quite some time as indicated by
the latest Integrated Resource Plan Update Base Case results shown in Figure 14 below. Clearly then, in principle,
South African policy supporting electric cars should incentivize small scale embedded charging as much as the
cars themselves for the time being. The City of Cape Town is proposing rather ‘wheeling’ or ‘offsetting’ with solar
energy to reduce the net emissions of their order of 11 electric buses from BYD, a chinese automobile manufacturer
for the MyCiti service to come into operation at the end of 2017.
17 Diesel passenger cars still only account for around 10% of the car market if SUVs are included, with few compact models to
choose from. In general, the fuel savings attained with diesel passenger cars have also not offset the capital and maintenance
premium in South Africa.
100Sustainable Transport
Figure 14: Projected share of carbon-free electricity generated (Nuclear, CSP, Solar PV and Wind) in the
IRP Update Base Case
Source: DoE (2016) Integrated Resource Plan Update Assumptions, Base Case Results and Observations,
Department of Energy, Government Gazette, 25 November 2016, No. 40445
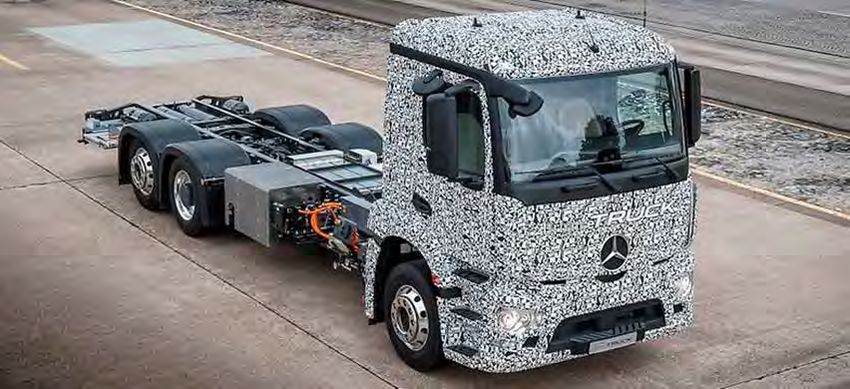
Hydrogen Fuel Cells
Research and development into the automotive applications of hydrogen fuel cells continues, including on heavy
vehicles, as fuel cells have the potential to extend the range and terrain accessible by electric freight vehicles
and commuter buses. A recently announced long-haul freight truck prototype, the Nikolai, a non-plug in fuel cell
battery electric hybrid, claims an impressive just less than 2000km range18. Like battery electric vehicles, fuel cell
vehicles have zero emissions from the tailpipe. While not as energy efficient as battery electric vehicles, fuel cell
vehicles typically have an equivalent fuel economy 40-60% better19 than conventional vehicles with less of an
urban driving energy penalty as well as, in most cases, a greater driving range than battery electric vehicles.
While capital costs of emerging offers have come down, the advances have not been as great as for battery
electric vehicles. The practical experience of the Stuttgart Public Bus Company Stuttgarter Strassenbahnen AG
(SSB) offers useful perspective(Wiedermann & Raff, 2017)20. They ran two fuel-cell bus demonstrator projects ten
years apart in 2003 and 2014, the latter involving 6 fuel cell-battery hybrid buses running as a fully integrated
component of their service. The price premium of the buses relative to a conventional diesel bus came down from
5-fold in 2003 to two-fold in 2014 and energy efficiency improved from 22 kg H2/100 km in 2003 to10-14 kg H2/100
km in 2014 mostly due to regenerative braking technology.
Hydrogen has very low volumetric energy density such that even when compressed to the very high pressure
of 700 bar of modern hydrogen fuelling systems, it only has an energy content of around 9 MJ/litre compared
to around 36 MJ/litre for diesel at atmospheric pressure. The challenge with hydrogen is therefore in the cost
effective production, storage and distribution of the fuel. Global production of hydrogen is mostly by reforming of
18 https://nikolamotor.com/one
19 http://www.fueleconomy.gov/feg/fcv_sbs.shtml
20 Wiedemann & Raff (2017) Presentation at Fuel Cell Bus Workshop – Unleashing Industrial Opportunities for South Africa through
a Zero Emission Choice. Department of Trade and Industry and GiZ workshop, Cape Town, 20th February 2017.
101Municipal Initiatives
Figure 15: Hybrid Battery Electric Fuel-cell Hybrid Bus operated by SSB Stuttgart
Source: Wiedemann & Raff (2017) Presentation at Fuel Cell Bus Workshop – Unleashing Industrial Opportunities for South Africa through a Zero Emission Choice.
Department of Trade and Industry and GiZ workshop, Cape Town, 20th February 2017.
fossil methane (Gupta, 2009)21 and in 2003 SSB installed their own on-site Steam Methane Reforming (SMR) plant
at considerable cost to the project but sold this plant and changed to sourcing hydrogen more cost effectively
from a waste incineration plant for the 2014 project. SSB are very clear however that the 2014 project is still not
financially viable without considerable external subsidy.
The leading concept for ‘carbon-free’ hydrogen production is water electrolysis supplied by solar PV electricity.
This is potentially a useful way to store excess electricity produced by renewable plants at scale when demand
is low. Aside from the efficiency penalty of converting electricity to hydrogen (around 25%) however, the costs
of small on-site electrolysis has generally been high(Dodds &McDowall, 2012). 22 As such the costs in Germany of
‘green’ hydrogen from electrolysis is reported to be currently around Euro 9.50/kg compared to Euro 2.60/kg for
hydrogen produced by SMR 21.
The Department of Science and Technology is supporting a concerted research initiative called Hydrogen South
Africa (HYSA) which has three centres of excellence working to give the country a foothold in the industrialisation
of the nascent global hydrogen economy. 23 They have developed production, fuel cell and storage technologies
and potentially may make early public transport demonstrator projects viable in South African municipalities if
their technical support can be combined with sufficient financial and institutional support.
21Gupta (2009) Hydrogen Fuel Production, Transport and Storage. Boca Raton: CRC Press Taylor and Francis Group.
22 Dodds & McDowall (2012) A review of hydrogen production technologies for energy system models – UKSHEC Working Paper
No. 6. London: UCL Energy Institute, University College London.
23 http://www.hysasystems.com/index.php/about-hysa
102Sustainable Transport
Concepts to policy frameworks
The concepts above have been
structured into evolving policy Figure 16: EASI– a robust conceptual framework to guide
public action
frameworks designed to promote
sustainable transport starting
with Lee Schipper’s World Bank
Activity, mode Share, Intensity and
Fuel mix (ASIF) framework (World
Bank, 2016)24 and the simplified
Activity, Shift and Improve (ASI)
(UNEP, 2011)25 framework, both
focussed on energy efficiency. A
recently developed variation on
these, EASI (World Bank, 2015)26
has a strong additional institutional
and governance component.
EASI is outlined in Figure 16. Source: The World Bank (2015) Policies for sustainable accessibility and mobility in urban areas of Africa,
Africa Transport Policy Programme (SSATP), TRANSITEC Consulting Engineers Ltd (M. Stucki), in collaboration
The 4 pillars of EASI expand with ODA, CODATU and Urbaplan.
into policy recommendations
which are presented below.
Current transport policies
and implementations in South Africa are briefly assessed against these recommendations:
Table 3: Policy Recommendations to support the ‘Enable’ Pillar of the EASI framework
E1 To define, adopt and implement, at central government level, a national urban transport strategy
that ensures the sustained development and management of urban transport systems.
E2 To ensure that the main urban transport public responsibilities at
urban/metropolitan level are assigned and carried out.
E3 To set up an entity in charge of urban transport planning and of guiding and coordinating
public action aimed at the provision of a multimodal urban transport system.
E4 To provide all institutions and stakeholders in the urban
transport sector with adequate human resources.
E5 To increase financial resources allocated to urban transport systems and to
ensure the availability of long-term funding for urban transport.
E6 To create the preconditions for continued civil society participation
in the development of urban transport systems.
E7 To enhance the involvement of the private sector in the provision
of transport infrastructure and services.
Source: The World Bank (2015), “Policies for sustainable accessibility and mobility in urban areas of Africa”, Africa Transport Policy Programme (SSATP), TRANSITEC Consulting
Engineers Ltd (M. Stucki), in collaboration with ODA, CODATU and Urbaplan
24 World Bank (1999) Transportation and CO2 Emissions: Flexing the Link – A Path for the World Bank. Paris: The World Bank.
25 UNEP (2011) Towards a Green Economy – Transport – Investing in Energy and Resource Efficiency. United Nations Environment
Programme.
26 The World Bank (2015) Policies for sustainable accessibility and mobility in urban areas of Africa, Africa Transport Policy
Programme (SSATP), TRANSITEC Consulting Engineers Ltd (M. Stucki), in collaboration with ODA, CODATU and Urbaplan.
103Municipal Initiatives
In South Africa a comprehensive national level transport strategy (E1) has been adopted in the form of the recently
updated National Transport Master Plan (NATMAP) (DoT, 2016)27. Financial resources have been (E5) made available
nationally to urban transport systems through programmes such as the Public Transport National Grant (PTNG)
although the long term sustainability of current subsidy levels and established levels of compensation to minibus
taxi operators, as formalisation expands, is in question (DoT, 2016). Large metropoles such as the City of Cape Town
have however undertaken financial scenario analysis of their BRT expansion plans with the target of remaining
within the target of 4% of property rates income in a future environment of reduced subsidy (City of Cape Town,
2015) 28.
Transport authorities (E3) have been set up by Cape Town (TCT) and eThekwini (ETA) but urban passenger rail is
still centrally administered by PRASA and legacy subsidised bus contracts with private concessionaires are still
administered by provincial governments. The steady expansion of Integrated Public Transport Network (IPTN)
projects in the large metropoles and some secondary cities like George and Rustenberg over some 10 years has
built a cohort of supporting professionals, private suppliers and to a lesser extent civil society bodies that to some
degree address the remaining policy recommendations above in key regions. A good start has therefore been
made on the ‘enable’ pillar with the potential to leverage the emerging institutional expertise to overcome the
many challenges to expanding current systems, extending systems to new regions and improving the financial
sustainability of all networks.
Table 4: Policy Recommendations to support the ‘Avoid’ Pillar of the EASI framework
A1 To plan for urban forms and land use that minimize the need for individual motorized
travel and promote public transport and non-motorized transport modes.
A2 To deploy transport infrastructure and services in a manner
that promotes sound urban forms and land use.
A3 To strengthen land use management.
Source: The World Bank (2015), “Policies for sustainable accessibility and mobility in urban areas of Africa”, Africa Transport Policy Programme (SSATP), TRANSITEC Consulting
Engineers Ltd (M. Stucki), in collaboration with ODA, CODATU and Urbaplan
Generally low urban densities have been widely identified as a barrier to the financial sustainability of public
transport in South Africa. Cape Town has identified Transit Orientated Design (TOD) in urban planning as a long
term cornerstone of its plan to make its public transport network more financially sustainable. It is not clear
however whether private developers and supporting professionals in the main as yet prioritise integration with
a low carbon transport system. Furthermore, legislated public consultation processes can have the outcome of
stalling mixed use developments at increased densities due to conflict with private interests. Broad policy is in
place for this pillar in the large metros but implementation at scale will likely take some time. Secondary cities
implementing public transport projects will be even more vulnerable to operational efficiency problems due to
unsuitable urban form. Integrating land use efficiency through the urban planning and approval functions will
therefore need to form a key component of long term planning for future projects.
27 DoT (2016) National Transport Master Plan, Synopsis Update, Draft Final Report, Pretoria: Department of Transport, Republic of
South Africa.
28 City of Cape Town (2015) MyCiTi Business Plan 2015 Update Phase 1 and N2 Express, Transport for Cape Town (TCT),
Cape Town.
104Sustainable Transport
Table 5: Policy Recommendations to support the ‘Shift’ Pillar of the EASI
S1 To adopt and systematically introduce, at all levels and scales, a multimodal
approach to the development and management of urban transport systems.
S2 To develop and maintain for each urban area a pedestrian network that
is continuous, safe and accessible for all throughout the day; and to
develop and maintain bicycle paths with similar characteristics.
S3 To provide an integrated and hierarchical public transport system that is efficient, reliable and
capable of serving the needs of constantly evolving populations and the urban economy.
S4 To plan and implement mass transit systems that operate on exclusive infrastructure
and can form the backbone of the urban public transport system.
S5 To enhance the level of service provided by paratransit (minibus taxi)
operators by way of full integration in the public transport system, which
requires restructuring, modernizing and promoting them.
Source: The World Bank (2015) Policies for sustainable accessibility and mobility in urban areas of Africa, Africa Transport Policy Programme (SSATP), TRANSITEC Consulting
Engineers Ltd (M. Stucki), in collaboration with ODA, CODATU and Urbaplan
The public transport projects of the last 10 years were initially very BRT focussed in what has been described as BRT
“mania” or “fever” inspired by the remarkable achievements in South America particularly in the cities of Bogota
and Curitiba. The political considerations of the times have made the rapid provision of modern formal motorised
transport a priority and a multimodal approach, particularly inclusive of non-motorised modes, has perhaps
suffered. An early recognition in eThekwini that the structure of the city precluded meeting major demand with
full BRT and that an integrated multi-modal system centred around the existing rail network was more practical
was, for example, subsumed by the Department of Transport’s then focus on BRT as a condition for grant funding
(Esteves & Bannister, 2015)29.
The reframing of large scale national grant funded initiatives as Integrated Public Transport Network (IPTN) projects
has however broadened the scope of planning and responses to challenges considerably. The City of Cape Town
has indicated its intention of implementing the future phases of its public transport network expansion as a
‘hybrid’ system which, recognising the efficiency of the minibus taxi industry, aims to integrate an improved quality
minibus service as feeders to trunks and core feeder routes with the possible further integration of the legacy
provincially contracted private bus company (GABS) (Naidoo, 2016)30. The Go George IPTN directly purchased
minibus taxis modified for full disabled access and fare system integration and have maximised flexibility in their
fleet and scheduling to optimise financial sustainability.
Given the high walking mode share in low-income groups and the high rate of pedestrian fatalities, robust
pedestrianisation initiatives are justified on safety and cost considerations alone but in general have yet to be
prioritised outside of a broad commitment to TOD principles. Investment in cycling infrastructure is however
more difficult to justify given the current low mode share but has niche applications. Aside from non-motorised
transport then, the trend in policy implementation in current IPTNs has shifted broadly in line with the “shift”
pillar recommendations above and future projects can draw directly from the planning and practice innovations
currently unfolding.
29 Esteves & Bannister (2015) Implementing BRT in eThekwini. [Online]
Available at: http://www.erln.co.za/images/jevents/5624aa29b92726.87366313.pdf
30 Naidoo (2016) Cape Town’s Experience – Presentation to SABOA, Transport and Urban Development Authority, City of
Cape Town.
105Municipal Initiatives
Table 6: Policy Recommendations to support the ‘Improve’ Pillar of the EASI framework
I1 To improve planning, operation and maintenance of urban roads
taking into account and balancing the needs of all transport modes and
keeping the use of individual motorized vehicles under check.
I2 To define and implement realistic and gradually more demanding requirements
in terms of fuel components, energy efficiency and gas emissions.
I3 To promote safe and environmentally responsible behavior by all urban transport
stakeholders, by strengthening technical control of vehicles and by keeping the
public informed of the negative externalities of individual motorized transport.
Source: The World Bank (2015) Policies for sustainable accessibility and mobility in urban areas of Africa, Africa Transport Policy Programme (SSATP), TRANSITEC Consulting
Engineers Ltd (M. Stucki), in collaboration with ODA, CODATU and Urbaplan.
After the initial phases of IPTNs all implementing municipalities are acutely aware of the risk of reliance on subsidy
and are focussing on operational efficiency of their bus fleets through mixing bus sizes, moderating expensive
peak services and investing in control centres that monitor and respond flexibly to demand.
While the mass transit programmes discussed above do not, in general, have an implicit sustainability rationale,
many of the larger metropoles have compiled greenhouse gas inventories and are in the process of setting
mitigation targets. The impact of vehicle occupancy on energy efficiency is seen in Figure 5 above and it is likely
that this will lead to policies targeting control of private motor vehicles and higher occupancies. These might
include permission to use restricted lanes for cars carrying passengers or relaxation of restrictions to access parts
of the central city for cars with passengers. Other than a small national level carbon tax on the purchase of
passenger cars and light trucks there is, for the time being, little activity aligning with the ‘improve’ pillar of policy
recommendations as regards private vehicles.
Electric vehicles are seeing rapid growth off a low base in Japan and Norway31 and offer opportunities for energy
efficiency but as is discussed in more detail below, South Africa’s coal fired electricity largely erodes these gains
unless solar charging is implemented.
31 https://electrek.co/2017/02/15/norway-electric-vehicle-market-share-record/
106Sustainable Transport
Implementation
A universe of implementation measures, appropriate to local government, that align with the EASI framework and
thus promote sustainable transport are presented below in Table 7.
Table 7: Selected Sustainable Transport Implementation Measures for Local Government
Type of Measure Description of Measure
Taxes Congestion charges, vehicle registration fees, road tolls (e-tolls).
Vehicle emission taxes at license renewal.
Parking charges for high emission or low occupancy vehicles.
Emission tolls on freight delivered by road corridors, in particular processed food.
Incentives Reduction of parking costs and relaxation of access restrictions for low emission vehicles.
Rebate of tolls for freight delivered by rail or multi-modal rail technologies.
Waive vehicle licensing costs for low emission vehicles.
Subsidies Access national Transport infrastructure and operations subsidies.
General Revenue Funds (national, provincial and local levels for parking, road
development, transport infrastructure and road transport operation).
Regulations Regulatory restrictions to encourage modal shifts (road to rail).
Restriction on use of private vehicles in certain areas and at certain times.
Restriction on the use of higher emitting and low occupancy vehicles.
Planning Urban planning and zoning restrictions e.g. enforce the urban edge and limit access to the CBD.
Management of investment and usage of transport infrastructure.
Development of NMT/bus/public-transport lanes/zones.
Limitation of parking for private vehicles in congestion zones.
Sector specific energy performance and GHG targets based on scenarios developed for a State of Energy.
Standards Develop minimum policy level of service specifications for public transport services (e.g. operating times and frequency).
Emissions standards for public transport fleets and municipal vehicle fleets .
Information Programmes Information campaigns on externalities of car use and promotion of public transport alternatives.
Marketing of public transport services.
‘Green / Eco Driving’ Campaigns.
Government Low emission vehicle procurement for IPTN systems.
Procurement of Public The Green Energy Efficiency Fund (GEEF) (facilitates the implementation of
Goods or Services energy efficiency initiatives and renewable energy projects).
Direct Infrastructure Energy management and monitoring systems for fleets.
Investment Investment in alternative fuel infrastructure e.g. solar charging points for EVs.
Investment in low emission vehicles for municipal fleets.
Investment in mass public transport with dedicated infrastructure.
Investment in transit (expansion of transport network) and non-motorised transport (Pedestrian walkways or cycle lanes).
Institutional Measures Creation of a Transport Authority with a clear vision, mandate and resources.
Integration of transport planning with environmental and urban planning.
Integrate minibus taxi operators not yet incorporated as operators or
shareholders of IPTNs to support the system on feeder routes.
Collaborate with tertiary institutions on transport system engineering and management course
content design. Offer bursaries and internships linked to human resource supply.
Research and Continued investment in the development of energy and environment systems models and traffic flow models
Development and their application to inform decisions on targets, policy evaluation and development impacts.
Collection and dissemination of transparent, replicable, comparable and accurate public data on transport.
*See Section 8, Appendix – Overview of measures and responsibilities in GIZ’s Urban Transport and Energy Efficiency Module 5h of the Sustainable Transport: A Sourcebook for 107
Policy-makers in Developing Cities for an extensive list of available measures.You can also read