Connectivity-led development of Northeast India through BBIN corridor - FICCI
←
→
Page content transcription
If your browser does not render page correctly, please read the page content below

Connectivity-led
development of
Northeast India
through BBIN corridor

                On Solid Ground: A.T. Kearney   1
Foreword

Ranjit Barthakur
Chairman, FICCI North East Advisory Council

3rd Connect North East 2016: It is our proud privilege to present the 3rd Connect North East, a brand created to
promote economic and socially inclusive strategies for the North East India. We are pleased to note that the North East
has slowly, but surely featured in an aggressive agenda by successive Governments, both in Delhi and the States,
focusing on People to People, Government to Government and Business to Business connect. No doubt the emphasis
on connectivity by road, river, rail and air has been well received, but the implementation has been challenging.

We are hopeful that over the next 20 years of India’s growth story, our country’s North East Region (NER) will be in the
spotlight. With 45 million people in the region and abundant natural resources, the region has the potential to make a
significant impact on India’s economic and social development.

Pan Asian Connectivity: We believe the core issue impacting development in the region is that of connectivity. With
5,300 km of international borders and its geographic position, the NER can easily be positioned as the hub of trade,
commerce and connectivity between India and SE Asia and even China in times to come. Already, three major projects
of Pan Asian Connectivity, the Asian Highway I and II and the Trans-Asian Railway are proposed to criss-cross the region
before connecting Bangladesh, Nepal, the Indian Mainland and beyond. While these initiatives inspire hope, a lot more
will be required in terms of planning and action on the ground. We believe the potential in energy is another area where
there is an inherent scope for cooperation with neighbouring countries. FICCI has proposed a comprehensive devel-
opment strategy which aims to fulfil the aspirations of the region and presents a vision for the region when Independent
India turns 75, six years from now.

Connect North East 2014 & 2015, organised by FICCI, highlighted the need for connectivity through roads, IWT, railways,
air, digital connectivity and improved market access. Connect Northeast 2016 will highlight the potential for value
creation by enhancing connectivity networks.

Bangladesh–Bhutan–India–Nepal (BBIN) corridor is of vast geostrategic and economic relevance to the region as it
has the power to unlock significant value by improving connectivity, which will enhance trade, transhipment, and the
movement of people.

Border Trade: The theme of this conference is focused on Border trade and this report highlights the potential
impact of the BBIN corridor on economic development, trade, transhipment and passenger movement. The report
also discusses current conditions, identifies interventions that will be needed to accelerate development and delves
into the idea of creating cross-border value chains and potential benefits for the region and the neighbouring countries.

North-East Implementation Agency: Over the years, we have seen several strategic plans laid out for the North East
which have resulted in benefitting the region in varied aspects. If some of these plans did not achieve the full measure
of success, it is because the agencies implementing those plans were not synced with the plans. It is, therefore,
pertinent that we work on augmenting the implementation capacity within the region. I feel this can best be achieved by
setting up a North-East Regional Project Implementing Authority, which will not only handle funding but will also be in
charge of hands-on monitoring of projects, coordinating with State Governments and all other relevant agencies, which
will implement and monitor each vertical with select private sector partners.

I would like to thank A.T. Kearney for partnering with us in creating this report.

                                   A.T. Kearney | FICCI | Connectivity-led development of Northeast India through BBIN corridor   2
Mayank Bansal
Partner, A.T. Kearney

Developing India’s North East Region has long been on the country’s national interest radar, especially when it comes to
initiatives to enhance the region’s connectivity. With the signing of the Bangladesh, Bhutan, India, Nepal Motor Vehicle
Agreement, the region’s development has moved into the spotlight.

The BBIN corridor would bring substantial economic and cultural value to the region thanks to its strategic location, and
it would have a significant impact on the region’s connectivity. But despite significant support within the North East
states, development has been slow with only a few programs facilitating regional trade, transport, and passenger
movement.

To identify a targeted approach for developing the BBIN corridor, we have conducted a thorough assessment of the
current state of affairs. This report begins by baselining the existing situation in the BBIN region while keeping the NER in
focus. We also examine several examples of successful inter-country corridors and tourism development in other Indian
states to understand best practices. Then, we detail the necessary interventions and expected benefits for the North
East Region with the development of the BBIN corridor.

A.T. Kearney would like to thank the NER chapter of the FICCI for its support in creating this report, to be presented
at the North East Connectivity Summit in Agartala, Tripura.

                                    A.T. Kearney | FICCI | Connectivity-led development of Northeast India through BBIN corridor   3
Message

Dr. A. Didar Singh
Secretary General, Federation of Indian Chambers of Commerce and Industry

North-eastern India and the neighbouring countries of Bangladesh, Bhutan and Nepal have natural complementarities
which could be exploited to create robust, mutually beneficial economic relationships. Trade relations between these
countries and the North East India date back many centuries and strengthening these relations will give a major boost to
the region’s development.

FICCI has taken up a number of initiatives aimed at catalysing economic development in North East India. The North
East Connectivity summit, organised by FICCI in November 2015, highlighted the key connectivity and infrastructure
requirements that need to be addressed to harness the full economic potential of the region. We are happy to note a lot
of forward movement and an overall improvement in connectivity.

The signing of the BBIN Motor Vehicle Agreement has lent new impetus to the collaborative efforts to harness economic
complementarities and create value chains that transcend borders. The agreement envisages free movement of goods
and people between the BBIN countries and once fully implemented, will bring about far reaching changes in the
course of economic development of the region.

This report on “Connectivity-led development of Northeast India through BBIN corridor” makes an attempt to assess the
potential benefits of developing the BBIN corridor, identifies the key interventions necessary to realise these benefits
and proposes a way forward to create few sustainable cross border value chains.

I would like to thank A.T. Kearney for collaborating with us in preparing this report and I hope the report stimulates
thought and provides a starting point for further work in fast-pacing the economic development in North East India.

                                  A.T. Kearney | FICCI | Connectivity-led development of Northeast India through BBIN corridor   4
Table of Contents

Introduction                                                                                            6
Baselining the flow of freight and passengers                                                           9
2.1 Baselining current freight flows                                                                    10
2.2 Baselining the current flow of passengers                                                           16
Best practices to improve the flow of freight and
passengers                                                                                              21
3.1 Best practices from cross-country
    corridors and customs transit systems                                                               22
3.2 Best practices from Indian states
    for tourism development                                                                             31
Key areas of intervention                                                                               46
4.1 Interventions to increase the flow of freight                                                       47
4.2 Interventions to increase the flow of passengers                                                    58
Benefits of the BBIN corridor for NER states                                                            68
5.1 Improved connectivity of the North East Region                                                      69
5.2 Increase in intraregional trade                                                                     71
5.3 Increase in GDP for NER states and
    employment generation                                                                               72
5.3.1 Increase in gross value addition                                                                  73
5.3.2 Employment generation                                                                             73
5.4 Creating value chains                                                                               74
5.5 Other benefits                                                                                      79
Conclusion                                                                                              81
                   A.T. Kearney | FICCI | Connectivity-led development of Northeast India through BBIN corridor   5
Introduction

       A.T. Kearney | FICCI | Connectivity-led development of Northeast India through BBIN corridor   6
The development of the corridor for the Bangladesh, Bhutan, India, Nepal (BBIN) Motor
Vehicle Agreement is rooted in the formation of the South Asian Growth Quadrangle (SAGQ),
a collective organization established by the four South Asian nations. SAGQ was formed in
1996 in a bid to emulate the success of other regional organizations such as the European
Union (EU) and the Association of Southeast Asian Nations (ASEAN), which have ensured
cooperation, political and economic integration, and dialogue among states within the
organizations’ geographical or geopolitical boundaries.

To meet its goal, SAGQ was tasked with improving cross-border connectivity, boosting trade
among member countries, and strengthening subregional economic integration. Although
the four nations were members of the South Asian Association for Regional Cooperation
(SAARC), this new subregional framework allowed them to engage in direct discussions
focused on enhancing cooperation in regional transport, tourism, trade and investment, and
the environment.

The strategic location of North East India implies that the BBIN corridor will significantly
impact the development of the region. Because of this, the North East states have been
strong BBIN supporters.

However, over the past 20 years, despite dedicated programs and attempts from multiple
stakeholders within the SAGQ to promote development within BBIN, not enough has
happened to facilitate regional trade, transport, and the movement of goods and people
across the region.

Consider the existing state of affairs: intraregional trade among South Asian countries
accounted for only 5 percent of their trade in 20151. In stark contrast, the trade among
ASEAN countries during the same period was about 25 percent of their total trade. This low
level of regional integration in South Asia is manifested in poor intraregional investment.
Higher levels of integration to ensure smooth access to regional and international markets is
even more important for smaller, less developed, and landlocked nations such as Nepal and
Bhutan. There are many reasons for this subpar performance, ranging from lack of adequate
connectivity in the region to more complex political barriers.

Within India, keeping the North East Region (NER) in focus, there is much to be desired in
terms of infrastructure development and growth of trade. This has led to NER contributing
only 3 per cent to India’s gross domestic product, while commanding 9 per cent of the
country’s geographical area2. However, given its natural resources and strategic location, the
region has the potential to be an important player in India’s trade and investment.

1 Intra-BBIN Trade: Opportunities and Challenges, Observer Research Foundation Issue Brief, Issue No. 135, March 2016
2 Gross state domestic product, Government of India Planning Commission, May 2014

                                       A.T. Kearney | FICCI | Connectivity-led development of Northeast India through BBIN corridor   7
The above suggests that a targeted approach is needed to develop the BBIN corridor—both for
the development of trade and for passenger movement within the BBIN nations and around the
NER.

Ensuring improved connectivity within and beyond the region will be the first step.
Connectivity, in turn, will involve identifying key freight routes and land ports, which will be
crucial in setting up adequate communication channels. Procedural, regulatory, and
documentation requirements, along with bilateral and multilateral agreements, form the
foundation of physical connectivity and will need to be assessed in order to develop
well-rounded recommendations that will eventually lead to the creation of a
smooth-functioning BBIN corridor.

The development of the corridor will also need to be complemented with initiatives to increase
passenger movement within the region. These would include:

• Infrastructure development to improve overall connectivity, including rail, air and water

• Creation of tourist spots and restoration of sites along with development of passenger
  amenities such as hotels, restaurants, and intra-city mobility

• Government interventions to implement policies for taxation, training, and licensing as well
  as marketing the NER to attract tourists

The benefits of this development project are manifold. The BBIN corridor will significantly
increase trade activities between BBIN nations, which in turn will allow for greater market
access for production centres in these countries, chiefly for the NER. Moreover, transporters
moving from mainland India towards the NER and vice versa will be able to take advantage of
transiting through Bangladesh, thereby reducing their logistics cost and time by a sizeable
margin. Lastly, with the development and extension of the corridor, there will be greater
economic integration, not only between the BBIN nations, but also with other neighbouring
regional alliances such as the Greater Mekong Subregion (GMS) and ASEAN.

The focus of this report is on understanding the impact of the BBIN corridor along two
dimensions: trade and transhipment; and the impact on passenger movement.

                             A.T. Kearney | FICCI | Connectivity-led development of Northeast India through BBIN corridor   8
Baselining the flow of
freight and passengers

       A.T. Kearney | FICCI | Connectivity-led development of Northeast India through BBIN corridor   9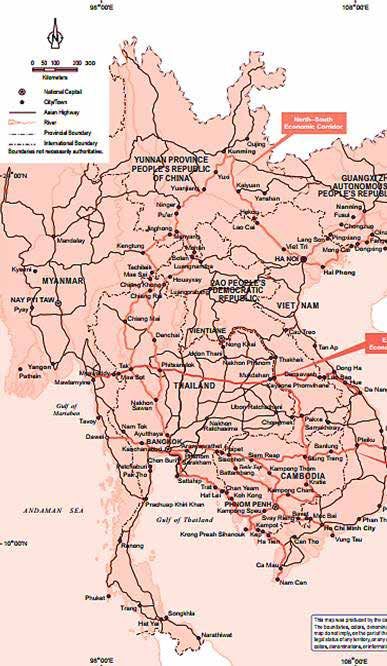
Before formulating initiatives for the development of the BBIN corridor, it is important to have a
thorough understanding of the existing trade, transhipment, and passenger movement within
the region.

A detailed baseline of India’s trade with Bangladesh and Bhutan has been developed to examine
trade within the BBIN corridor with respect to the NER. Moreover, the flow of domestic freight
within the region has also been baselined using the origin-destination freight study.3

In addition, existing passenger movement from tourism within the NER has been detailed to
understand the current state of tourism across various categories.

2.1 Baselining current freight flows
India’s collective trade, including exports and imports, with the BBIN nations in fiscal year 2016
was $9.8 billion (see figure 1).4,5 The flow of trade shows a heavy skew, with exports from India
amounting to $8.6 billion (87 per cent) and imports to India adding up to $1.2 billion (13 per
cent).

Among the three nations, Bangladesh emerges as the largest trading partner with $5.6 billion of
total trade. Exports from India accounted for about 88 per cent and imports about 12 per cent.
India–Bhutan trade was the smallest in the group, adding up to only $0.5 billion. However, the
split of exports (75 per cent) and imports (25 per cent) was slightly more balanced when
compared with India–Bangladesh and India–Nepal trade. An assessment of the current trade
profile with two countries, Bangladesh and Bhutan, which are of strategic importance to the
NER, is detailed in this section.

3 Trade values include cargo cleared through inland container depots, air cargo complexes, special economic zones, and container
  freight station.
4 Trade data excluding electrical energy, fiscal year, Directorate General of Commercial Intelligence and Statistics
5 Trade values include cargo cleared through inland container depots, air cargo complexes, special economic zones, and container
  freight station.

                                        A.T. Kearney | FICCI | Connectivity-led development of Northeast India through BBIN corridor 10
Figure 1:
Trade between India and Bangladesh, Bhutan, and Nepal
Fiscal year 2016 ($ million)
Fiscal year 2016 ($ million)
Nepal
3,160 (87%)
460 (13%)
Bhutan
370 (75%)
125 (25%)
Bangladesh
4,990 (88%)
650 (12%)
Exports
Imports
A.T. Kearney | FICCI | Connectivity-led development of Northeast India through BBIN corridor 112.1.1 India–Bangladesh trade
Figure 2:
Split of trade between India and Bangladesh
$ million
4,990 650
6% 1%
12%
39%
87%
55%
Export Import
Air Sea Land
In fiscal year 2016, exports from India to Bangladesh totalled $5.0 billion with a share of 88 per
cent in total trade (see figure 2). The split of exports based on modes of transport showed 55 per
cent land, 39 per cent sea, and 6 per cent air. Major commodities exported from India included
cotton, iron and steel, onions, wheat, rice, coal, and vehicles (motorcycles and three-wheelers)
and their spare parts.
Imports to India from Bangladesh accounted for $0.65 billion (12 per cent) in fiscal year 2016.
Land was the dominant mode of transport with a share of 87 per cent, while sea and air
transport were 12 and 1 per cent respectively. Jute (raw and finished products such as sacking
bags), ready-made garments, nuts, finished products of cotton, vessels for goods and people
transportation, unrefined lead, and shingle ballast were major components of imports.
India–Bangladesh trade and transhipment via road
In fiscal year 2016, the India–Bangladesh value of trade and transhipment via road totalled $3.3
billion, of which $2.7 billion came through exports and the remaining $0.6 billion through
imports.
Trade with Bangladesh, using road, is facilitated through designated land ports or land custom
stations (LCS) dispersed on the India–Bangladesh border. More than 40 stations have been
established over the years; however, many are either not functional or have minimal trade.
Figure 3 shows major LCSs for India–Bangladesh trade.
A.T. Kearney | FICCI | Connectivity-led development of Northeast India through BBIN corridor 12Figure 3:
Land custom stations at the India–Bangladesh border
Fulbari Changrabandha
( 0.8%, 0.2%) ( 0.3%, 4%)
Banglabandha
Burimari
Hili Dawki
(4%, 0.4%) Hili
Sonamosjid Tamabil
Mahadipur
(6%, 4%) Sheola Sutarkandi
(0.2%, 2%)
Akhaura
Agartala
Petrapole (-, 6%)
(68%, 76%) Benapole
Thegamukh Kawarpuchiah
Ghojadanga Bhomra
Major land custom stations (% land exports, % land imports)
Corresponding station in neighbouring country
The Petrapole–Benapole border dominates trade volumes. The LCS handled 68 per cent exports
and 76 per cent imports that happened via land-based transport modes in fiscal year 2016.
Mahadipur and Hili are important points on the western Bangladesh border, cumulatively
handling about 10 per cent land exports and 5 per cent land imports. Changrabandha on the
North Bangladesh border is a strategic point from the perspective of subregional connectivity
of Bangladesh–India–Bhutan. On the eastern border of Bangladesh, Agartala is a significant
import location, accounting for about 6 per cent of land imports.
2.1.2 India–Bhutan trade
Figure 4:
Split of trade between India and Bhutan
$ million
370 125
3% 0% 0%
97% 100%
Export Import
Air Sea Land
A.T. Kearney | FICCI | Connectivity-led development of Northeast India through BBIN corridor 13India’s trade with Bhutan in fiscal year 2016 was smaller than with Bangladesh. Exports from
India to Bhutan added up to $0.37 billion, with a share of 75 per cent in total trade (see figure 4).
Since Bhutan is landlocked, trade is dominated by land transport. Major commodities exported
from India include high-speed diesel, chemicals, machinery, motor cars, aviation turbine fuel,
iron and steel, coal, and food products.
Imports to India from Bhutan were $0.125 billion, with land transport accounting for almost all
import. Major commodities imported include chemicals, especially silicon-related. In addition,
electrical energy contributed $0.15 billion to total imports.
India–Bhutan trade and transhipment via road
India–Bhutan trade based on land transport added up to $0.36 billion in exports (97 per cent of
total exports) and $0.125 billion in imports (100 per cent of total imports). Land transport with
Bhutan is facilitated through 6-8 LCSs. Figure 5 shows the major points of India–Bhutan trade.
Figure 5:
Land custom stations at the India–Bhutan border
Samtse
Phuentsholing SamdrupJongkhar
Chamurchi Gelephu
(2%, 2%)
Jaigaon Hatisar SamdrupJongkhar
(91%, 95%) (6%, 3%)
Major land custom stations (% land exports, % land imports)
Corresponding station in neighbouring country
The Jaigon–Phuentsholing border is the most crucial site for India–Bhutan trade, accounting for
more than 90 per cent of total imports and exports. Other important LCSs include Hatisar,
Chamurchi, and Samdrup Jongkhar.
2.1.3 Domestic freight in the North East Region
The NER is landlocked and only connected to the rest of India via the Siliguri Corridor, a narrow
strip of Indian land that runs between Nepal and Bangladesh and connects West Bengal to
Assam. The NER’s border with India is a mere 83 kilometres (km), which is only 2 per cent of the
region’s total international border of 5,437 km.6 The NER stands to gain immensely through the
improvement of India–Bangladesh connectivity as part of the corridor development. India and
Bangladesh share more than 4000 km of contiguous border. If domestic freight to or from NER
is permitted to transit through Bangladesh, this would lead to substantial improvements in NER
connectivity.
6 Ministry for Development of the North East Region
A.T. Kearney | FICCI | Connectivity-led development of Northeast India through BBIN corridor 14Figure 6:
Freight landscape in the North East Region
Fiscal year 2016
110 54
1,385 routes
million MT billion TKM
13%
29% 34%
13%
25%
36%
74%
46%
31%
Routes Freight Net TKM
Inflow into NER Outflow from NER Within NER
As part of baseline development, all domestic freight flows in and out of the NER were assessed
(see figure 6). There are almost 1,400 routes carrying a cumulative freight of 110 million tons
either into or out of NER or both. About 74 per cent of total freight is such that both origin and
destination are within the NER while origin only or destination only (with respect to NER) freight
volumes are evenly distributed to about 13 per cent each. However, when the flow of freight is
assessed from the angle of net ton-km, the split is much more balanced. Routes within the
region contribute about 31 per cent of the total 54 billion ton km as a result of the shorter travel
distance compared with routes that have one point outside the NER.7
As mentioned, the real advantage of the corridor development among these 1,400 routes will
be for the routes that circle the India–Bangladesh border to connect NER with the rest of the
nation, as shown in category 1 in figure 7. Transit via Bangladesh will be vital to achieving time
and cost efficiencies on these routes.
7 Planning Commission, 2008, RITES Total Transport System Study, projected for fiscal years 2015 and 2025 levels using state-wise
commodity growth and state GDP growth
A.T. Kearney | FICCI | Connectivity-led development of Northeast India through BBIN corridor 15Figure 7:
Freight routes in the North East Region
Category 1 Category 2
Routes that circumnavigate the
All other routes
Indo–Bangladesh border
Clear route
without circling
Indo–Bangladesh
border
Siliguri
Siliguri Guwahati Dimapur
Guwahati
Muzarfarpur
Malda Imphal
Route with
Agartala both origin and
Kolkata destination in the
North East Region
2.2 Baselining the current flow of passengers
India’s rapidly growing travel and tourism industry contributed 6.9 per cent to the country’s GDP
in fiscal year 2012–13.8 The industry has also contributed INR 135,193 crores to the foreign
exchange reserves in 2015 with a growth of 9.6 per cent compared with the previous year.9
Highly labour intensive, the sector is the second major employment generator after agriculture
and has a 12.4 per cent share of employment. India is ranked 12th in the Asia Pacific region and
52nd globally based on The Travel and Tourism Competitive Index 2015.10
• India is an attractive tourism destination for foreign tourist thanks to its vast natural and
cultural resources. The country attracted 7.7 million tourists in 2014 with an annual growth of
10.6 per cent.11
• Being the second most populous country in the world, India has huge domestic tourism.
The number of domestic tourists in 2014 was 1,290 million—12.9 per cent more than in 2013.12
Some states such as Tamil Nadu, Uttar Pradesh, and Karnataka are the front-runners in
attracting tourists and hosted close to 50 per cent of all tourists in India in 2014 (see figure 8).
8 E-book Ministry of Tourism, August 2016
9 Annual Report 2015–16, Ministry of Tourism
10 Travel and Tourism Competitive Index 2015, World Economic Forum
11 Indian Tourism Statistics 2014, Ministry of Tourism
12
Indian Tourism Statistics 2014, Ministry of Tourism
A.T. Kearney | FICCI | Connectivity-led development of Northeast India through BBIN corridor 16Figure 8:
Tourist arrivals in Indian states
Million, 2014
229 332
(17%) (25%)
34
(3%
)
35 (3
%)
50 (4%)
64
(5%) 186
72 (14%)
(6%)
93
(7%) 119
99
(9%)
(8%)
Tamil Nadu Andhra Pradesh Rajasthan
Uttar Pradesh Telangana Jharkhand
Karnataka Madhya Pradesh Others
Maharashtra West Bengal
None of the NER states appear in the top 10 despite the region’s rich cultural and natural
heritage. The NER hosts less than 1 per cent of tourists but is home to 4 per cent of India’s
population. Assam alone attracts 70 per cent of all tourists in the region, while the rest of the
seven states fall in the bottom quartile in terms of number of tourists (see figure 9).13
Figure 9:
Tourist arrivals in North Eastern states
Annual number of tourists, 2014 (‘000)
46,000 45,674
45,500
45,000
5,500
5,000 4,848
4,500
4,000 Third quartile
3,500 (3,754)
3,000
2,500
2,000
1,500
1,000 725 612
500 388
186 118 69 62
0
Average number Assam Meghalaya Sikkim Tripura Arunachal Manipur Mizoram Nagaland
of tourists
(except North
East Region)
13 Indian Tourism Statistics 2014, Ministry of Tourism
A.T. Kearney | FICCI | Connectivity-led development of Northeast India through BBIN corridor 17A closer look reveals the top-performing states in terms of attracting tourists annually are also
the biggest states in terms of land area. To eliminate this bias, the performance of the states
with respect to per capita tourism and per square km was also studied. The analysis shows that
all the NER states fall in the bottom quartile except Sikkim, which is performing better but below
the national average (see figure 10).
Figure 10:
States’ performance on number of tourists
Tourists per square kilometre, 2014
(log scale)
100,000
All India
Delhi
10,000 Chandigarh Daman & Diu
Puducherry Tamil Nadu
Dadra & Nagar Haveli
Karnataka Goa All India
1,000 Uttar Pradesh
West Bengal Punjab
Bihar Maharashtra Jharkhand
Haryana Andhra Pradesh
Himachal Pradesh
Madhya Uttarakhand
Kerala
Lakshadweep Gujarat Pradesh
Chhattisgarh
100 Assam
Rajasthan
Sikkim
Odisha
Jammu
and Kashmir A & N Islands
Meghalaya
Tripura
10 North East Region
Manipur states have the
Nagaland
lowest per capita and
Mizoram per square km tourism
1 Arunachal Pradesh
0.0 0.1 0.2 0.3 0.4 0.5 0.6 0.7 0.8 0.9 1.0 1.1 1.2 1.3 1.4 1.7 1.8 1.9 2.0 2.1 2.2 2.3 2.8 2.9 3.0 3.1 3.2 4.7
Tourists per capita (2014)
The growth rate of tourist arrivals in the NER is also low at 5 per cent, compared with 13 per cent
for India. However, the growth rate of foreign tourist arrivals is higher at 16 per cent compared
with 11 per cent for India (see figure 11).14
Figure 11:
Tourism growth in North Eastern states
Total number of tourist arrivals Number of foreign tourist arrivals
(‘000) (‘000)
8,000 120
+5%
7,000
100
+16%
6,000
80
5,000
4,000 60
3,000
40
2,000
20
1,000
0 0
2008 2010 2012 2014 2008 2010 2012 2014
14 Indian Tourism Statistics 2014, Ministry of Tourism
A.T. Kearney | FICCI | Connectivity-led development of Northeast India through BBIN corridor 18The contribution of the travel and tourism sector to state gross value added (GVA) for the NER
states (averaging 4.9 per cent) is also much lower than the national average of 6.9 per cent (see
figure 12).15 This indicates that the NER states as a whole have huge potential to draw more value
from travel and tourism, which will generate employment and improve the quality of life in the
region.
Figure 12:
State-wise percentage of tourism
TDGVA/GVA
(% GDP contribution by tourism, 2010)
17%
10% 10%
9%
8%
8% 8% 7% 7% All India
7% 7% 7% 7% 6% (6.9%)
6%
6% 5% 5% 5% 5%
4%
4%
Goa
AP
Kerala
HP
TN
Rajasthan
J&K
Maharashtra
Gujarat
Odisha
Karnataka
WB
UP
Punjab
Bihar
Tripura
Jharkhand
Assam
MP
Sikkim
Puducherry
Arunachal
To design the interventions, it is important to understand the categories of tourism:
• Direct tourism such as leisure, shopping, religious, and wellness tourism can be developed in
the short term.
• Indirect tourism such as education and training and medical and business tourism needs
more investments and infrastructure development.
• Social tourism, such as visiting friends and family, is one of the largest categories, but it has
minimum contribution to the state GDP.
The subcategories within direct and indirect tourism are detailed in the following section.
2.2.1 Direct tourism categories
Direct tourism categories can be developed in a short timeframe. Some of the subcategories
are detailed below:
15
Tourist Satellite Account Data for 2010, Ministry of Tourism
A.T. Kearney | FICCI | Connectivity-led development of Northeast India through BBIN corridor 19Leisure and shopping tourism. This category has the highest spending per trip and draws a
significant number of inter-state and foreign tourists. It also creates the most employment
within the state while boosting hospitality and allied services transport.
Religious tourism. This is usually categorized by low spending per trip. However, it draws a
significant number of tourists. Uttarakhand, for example, has 36 per cent of its tourists in the
religious category, which is the highest in the country.16 This category is extremely seasonal but
helps generate income for low-skill workers. The downside is that it puts significant pressure on
the tourism infrastructure during the season.
Wellness tourism. This category is associated with travel taken to improve the physical and
psychological well-being. Ayurveda and natural wellness has recently gained a lot of traction.
For example, Patanjali Yogpeeth and Haridwar attract a huge number of people for Ayurvedic
treatment and yoga practice. In addition, the Uttarkahand government funded the research of
herbal plantation on a commercial basis to develop the wellness tourism category even further.
2.2.2 Indirect tourism categories
Indirect tourism categories need a significant amount of infrastructure development and
investment. Some of these categories are detailed below:
Medical tourism. In contrast to wellness tourism, medical tourism, which is associated with
complex surgeries and critical illnesses, needs significant infrastructure and skills that can only
be developed over time.
Education and training tourism. This category creates an ecosystem for skill development
within the state and equips people for employment. Infrastructure such as training institutions
and universities, along with quality faculty, are needed to develop this category.
Business tourism. This is defined as travel for an official purpose. It is a high spend category
and attracts substantial foreign and interstate tourists. The main way to develop this category is
to enhance the ease of doing business and create an ecosystem to attract private investments.
16
Indian Tourism Statistics 2014, Ministry of Tourism
A.T. Kearney | FICCI | Connectivity-led development of Northeast India through BBIN corridor 20Best practices to improve
the flow of freight and
passengers
A.T. Kearney | FICCI | Connectivity-led development of Northeast India through BBIN corridor 21Examining examples of established systems that have enhanced the flow of freight and
passengers is useful for distilling best practices, which can then be used to help design inter-
ventions by BBIN nations, and NER states in particular, to enhance the flow of freight and
passengers within the corridor.
In the first half of this section, international examples of cross-country corridors are examined
to provide insights about enhancing the flow of freight. The latter half takes a look at three case
studies of Indian states that have increased the flow of passengers by enhancing tourism and
allied industries.
3.1 Best practices from cross-country corridors and
customs transit systems
Successful cross-country freight corridors have been developed in several geographies,
including Africa (Northern Corridor), Asia (Greater Mekong Subregion Corridor), and North
America (CANAMEX). Moreover, transnational customs transit systems such as the Transports
Internationaux Routiers (TIR) in Euro-Russia can be showcased as successful examples of
international collaboration that enables efficient movement of trade and transhipment across
borders.
All of these programs have had a significant impact in terms of reducing transit times, leading to
lower transportation costs. Additionally, these programs led to substantial trade growth
between participating countries. This section details the initiatives implemented as part of the
development of these corridors and the impact on reducing transit times and increasing trade
between participating countries. Best practices from these examples have been gathered and
used to design interventions for the BBIN corridor.
3.1.1 Northern Corridor, Africa
The Northern Corridor links the landlocked countries of Uganda, Rwanda, Burundi, Democratic
Republic of Congo, and South Sudan with Kenya’s maritime port of Mombasa (see figure 13).17 It
is governed by the Northern Corridor Transit Agreement (NCTA), which was signed in 1985 and
came into force in 1986 after ratifications.18
17
Background of Northern Corridor, Northern Corridor Transit and Transport Coordination Authority
18
The Norther Corridor Transit Agreement, Northern Corridor Transit and Transport Coordination Authority Road Network, Northern
Corridor Transit and Transport Coordination Authority
A.T. Kearney | FICCI | Connectivity-led development of Northeast India through BBIN corridor 22Figure 13:
Africa’s Northern Corridor
South
sudan
Uganda
Kenya
Congo Rwanda
Burundi Mombasa
Port
The Northern Corridor is a multimodal corridor encompassing road, rail, pipeline, and inland
waterways transport. It has a total road network length of 8,800 km and accounts for more than
70 per cent of the total transit flow within the region.19 The rail network accounts for more than
20 per cent of the total transit flow and has a length of 1,650 km.20 The annual transit and
transhipment traffic through this corridor exceeds 2.2 million metric tons (MT), which has been
growing at a rate of 20 per cent a year.
The major initiatives used to develop the Northern Corridor fall into three categories:
Policy initiatives. Framing and ratification of policies has been the most significant step in the
development and eventual success of this corridor. Some of the key policy interventions are
described below:
19
Road Network, Northern Corridor Transit and Transport Coordination Authority
20
Rail Network, Northern Corridor Transit and Transport Coordination Authority
A.T. Kearney | FICCI | Connectivity-led development of Northeast India through BBIN corridor 23• COMESA Treaty: Except for South Sudan, all countries that are part of the Northern Corridor
are signatories of the 1993 Common Market for Eastern and Southern Africa (COMESA) Treaty.
COMESA is an overarching framework to institutionalize trade facilitation with 19 member
states stretching from Libya to Swaziland.
• Standardisation of NCTTA provisions: The provisions of the Northern Corridor Transit and
Transport Agreement (NCTTA) are being standardized by member states across respective
national laws to streamline the Northern Corridor regulations and procedures.21
• The Northern Corridor Transport Observatory: The Northern Corridor Transit and Transport
Coordination Authority (NCTTCA) has set up a fully operational department that is tracking 25
key performance indicators related to volume and capacity, transit time and delays, rates and
costs, efficiency, and productivity.22
Procedural simplifications. The main initiatives used to simplify procedures for freight
movement along the Northern Corridor are described below:
• One-stop border posts: A one-stop border post (OSBP) is essentially a single-step border
crossing that is jointly managed by the neighbouring countries with activities streamlined
to maximize efficiency. The OSBP was implemented as a pilot at the Malaba border post
(between Kenya and Uganda), where average border-crossing time dropped from 24 hours to
four hours, resulting in economic benefits to the tune of $70 million per year.22
• Electronic single window system: The electronic single window system (e-SWS) is designed
to allow parties in trade and transport to lodge standardized information and documents
once through a single entry point to fulfil all import, export, and trade-related regulatory
requirements for various stakeholders. The same window is also used to return responses
and approvals. The system also enables electronic payment of duties and taxes on goods
imported or exported.23
• Single customs document: The Northern Corridor member states have adopted the
Common Market Customs Document (COMESA-CD) by merging customs documents used
in various countries for import, export, warehousing, transit, transhipment, and re-exports.
The benefits of standardization include reduced documentation costs and easier exchange of
information across the transit route.
21
E-transit Motor, Issue 1, Northern Corridor Transit and Transport Coordination Authority
22
Border crossing along the Northern Corridor, April 2013, Sub-Saharan Africa Transport Policy Program
23
Transforming the Northern Corridor into an Economic Development Corridor, April 2012, 6th Northern Corridor Stakeholders
Consultative Forum Meeting
A.T. Kearney | FICCI | Connectivity-led development of Northeast India through BBIN corridor 24Infrastructure improvements. Some of the major developments are described below:
• Highway network expansion: The highway network across Kenya, Uganda, Rwanda, Burundi,
and the Democratic Republic of Congo has been significantly expanded. The total highway
network within the Northern Corridor is 8,800 km.
• Increased port capacity: The Port of Mombasa at Kenya is the gateway port for East Africa
and has seen strong growth in traffic as a result of the Northern Corridor. To handle the
increased demand, the Kenya Ports Authority has embarked on major expansion projects to
increase the cargo-handling capacity at the port from 1.2 million containers to 2.5 million by
2018.24
• Enhanced ICT infrastructure: The member states of the Northern Corridor have developed
a centralized data exchange system (RADDEx 2.0 Centralized Architecture), which enables
efficient cargo tracking and corridor management.25
The Northern Corridor had a significant impact in terms of growth in trade and freight between
member states, passenger movement, and other areas of economic integration. These are
described below:
• Trade and freight: The Northern Corridor led to growth in intraregional trade between
member nations by 50 per cent from an estimated 3.6 million tonnes to 5.4 million tonnes
between 2008 and 2013.26 One of the driving factors behind this increased freight movement
was reduced transit time between member states. For instance, the transit time between
Mombasa, Kenya, and Bujumbura, Burundi has been reduced from more than 30 days to
about 15 days.27
• Passenger movement: The Norther Corridor improved cooperation among East African
nations, indirectly easing the movement of passengers. For example, Kenya, Rwanda, and
Uganda have partnered to create the East Africa Tourist Visa, which allows seamless travel for
visitors between Kenya, Rwanda, and Uganda.28
• Other economic benefits: The Northern Corridor also led to economic integration in other
areas apart from freight and passenger movement, such as power trading. For instance, Kenya
would start exporting power to Uganda under the Northern Corridor Infrastructure Power
pool.29
24
Ongoing port expansion to boost capacity, December 2015, KBC Channel
25
The Northern Corridor Trade and Transport Facilitation study on improving the use of COMESA facilitation instruments and strength
ening the Northern Corridor stakeholders forum, National Trade Facilitation Committees, November 2014, Pohl Consulting and
Associates
26
Impact Assessment of the Northern Corridor Performance Improvement Activities, May 2015, Northern Corridor Transit and Transport
Coordination Authority
27
Achievements of Northern Corridor, Northern Corridor Transit and Transport Coordination Authority
28
East Africa Borderless Visa, Borderless Borders
29
Kenya to sell power to Uganda, October 2015, Business Daily Africa
A.T. Kearney | FICCI | Connectivity-led development of Northeast India through BBIN corridor 253.1.2 Greater Mekong Subregion Corridor, Asia
Located in the Mekong River Basin in Southeast Asia, the Greater Mekong Subregion Corridor
links six counties: Cambodia, Laos, Myanmar, Thailand, Vietnam, and China’s Yunnan Province
(see figure 14). Established in 1992, the Greater Mekong Subregion (GMS) Economic
Cooperation Program is the first regional cooperation initiative of Asian Development Bank.
These countries have cooperated in investment projects that cumulatively amounted to $15
billion as of June 2012. Investments in the transport sector have been focused on developing
three regional corridors in the GMS:30
• East–West Economic Corridor from Mawlamyine (Myanmar) to Da Nang (Vietnam)
• North–South Economic Corridor across Kunming (People’s Republic of China) to Bangkok
(Thailand) and Hai Phong (Vietnam) via Hanoi (Vietnam) and Nanning (People’s Republic of
China) to Hai Phong (Vietnam) via Hanoi (Vietnam)
• Southern Economic Corridor from Bangkok (Thailand) to Ho Chi Minh City (Vietnam) via
Phnom Penh (Cambodia)
Figure 14:
The Greater Mekong Subregion Corridor
30
Trade and Trade Facilitation in the Greater Mekong Subregion, 2012, Asian Development Bank
A.T. Kearney | FICCI | Connectivity-led development of Northeast India through BBIN corridor 26The major initiatives of the GMS Corridor are classified into three categories:
Policy initiatives. The biggest policy intervention in the GMS Corridor is the Cross-Border
Transport Facilitation Agreement (CBTA), which creates provisions for trade and transit in the
GMS. The CBTA consolidates all non-physical measures to facilitate cross-border goods and
passenger movement into a single legal instrument. The CBTA does not intend to change any
policies related to immigration or trade, but aims to provide time- and cost-efficient
transboundary movement. This is pursued in all areas, including the following:31
• People: To ease the movement of people within member states, the CBTA contains
provisions to recognize drivers’ licenses, facilitate the issuance of visas, harmonize health
inspections according to international standards, and allow for customs exemptions for
personal belongings.
• Transport operators and motor vehicles: The CBTA allows transport operators established
in one signatory state to operate in the other signatory states. It also removes the customs
constraints on motor vehicles by giving temporary admission in member states on the basis
of home country registration, technical standards, roadworthiness inspection, and insurance
cover.
• Goods: The CBTA eases the flow of goods between member states by providing a clear
definition of prohibited goods and special categories of goods that require appropriate
treatment before entry into the host country.
Procedural simplifications. The main initiatives used to simplify procedures for freight
movement along the GMS Corridor are described below:
• Fast-track lanes: Several border-crossing points within the GMS have been designated with
fast-track lanes for truck drivers with valid CBTA documents along the East–West Economic
Corridor. These lanes ensure minimum inspection by authorities to ease freight movement
between these countries.32
• Harmonized customs documents: Customs documents are now designed in a standardized
manner for nations not only within the GMS but also within the ASEAN region.
• ICT-enabled customs management system: Member states of the GMS have rolled out
ICT-enabled customs management systems such as the Automated System for Customs
Data (ASYCUDA), a computerized system that handles manifests and customs declarations,
accounting, and transit procedures.33
31
Greater Mekong Subregion Cross-Border Transport Facilitation Agreement, 2011, Asian Development Bank
32
Greater Mekong Subregion Cross-Border Transport Facilitation Agreement, 2011, Asian Development Bank
33
About ASYCUDA, Automated System for Customs Data
A.T. Kearney | FICCI | Connectivity-led development of Northeast India through BBIN corridor 27Infrastructure improvements. Some of the major infrastructure improvements are described
below:
• Construction of expressways: As part of the development of the GMS Corridor, there
have been major investments in highway construction. For instance, the Yunnan Yuanmo
Expressway, which connects Kunming and Simao in China’s Yunnan Province, was
constructed under the aegis of the GMS and has reduced travel time across the stretch from
twelve hours to less than six.34
• Construction of arterial infrastructure: On certain stretches, missing links such as bridges
and link roads still impede the realization of full corridor benefits. Some of these infrastructure
upgrades are under way, including the Champasack Road Improvement Project-enabled
development of a link road between Lao People’s Democratic Republic and Cambodia at Veun
Kham, which reduced travel time by 40 to 50 per cent.35
The GMS Corridor has had a significant impact on the growth of trade and freight between
member states, passenger movement, and other areas of economic integration. These are
described below:
• Trade and freight: The GMS Corridor has led to significant growth in trade, driven by a greater
outward orientation and increased economic integration with global economies. The
trade-to-GDP ratio has increased significantly for all GMS countries, except Myanmar.
Additionally, with implementation of initiatives, there has been a substantial reduction in
border-crossing times, for instance from 118 to 194 minutes at Lao Bao–Dansavanh in August
2005 to about 30 minutes in 2009. However, this hasn’t significantly impacted the land-based
cross-border trade along the GMS Corridors.36
• Passenger movement: Passenger traffic has increased significantly on the GMS Corridor.
For instance, at the Bavet (Cambodia)–Moc Bai (Vietnam) border, the number of passengers
has increased more than five times between 2005 and 2007, reaching an average of 1,660
passengers per day.
• Other benefits: The GMS Corridor also led to cooperation between member states in other
areas apart from freight and passenger movement, such as access to quality healthcare. For
instance, villagers from border areas in Laos have access to Vietnam hospitals for treatment of
serious diseases.
3.1.3 Transports Internationaux Routiers (TIR) System
The TIR system is an internationally successful customs transit system that enables movement
of goods between countries affiliated to the TIR Convention, a 1975 UN-ratified agreement
allowing for duty-free movement of freight across nations.
34
Transport and Trade Facilitation in the Greater Mekong Subregion: Time to Shift Gears, December 2008, Asian Development Bank
35
Transport and Trade Facilitation in the Greater Mekong Subregion: Time to Shift Gears, December 2008, Asian Development Bank
36
Trade and Trade Facilitation in the Greater Mekong Subregion, 2012, Asian Development Bank
A.T. Kearney | FICCI | Connectivity-led development of Northeast India through BBIN corridor 28Under the TIR convention, a container or vehicle is sealed after loading at the customs office in
the country of departure. An internationally standardized customs document with details of the
consignment, called the TIR carnet, is then issued and carried with the vehicle. At inter-country
borders, only the TIR carnet and the customs seal are required to be verified by officials, thereby
reducing the time and cost of traveling across borders. Vehicles using the TIR Convention are
marked with blue-and-white TIR plates and are allowed to use dedicated fast-track “green lanes”
at checkpoints for faster movement through electronic pre-declaration.
The mainstay of the TIR Convention is an international guarantee system that allows payment-
less movement of goods across other TIR nations. Within this system, an authorised national
association in each TIR nation guarantees all duties and taxes at risk throughout the transit
operations of a transport operator of that nation. Transport operators across each TIR nation are
guaranteed duty-free transit across the TIR region with the support of their local national
association.
All of the national associations across the TIR nations constitute a network that is overseen by a
single international body, the International Road Union, a private body that represents the
interests of road transporters worldwide. To become a participant in the TIR system, a transport
operator needs to deposit a predetermined “admissions guarantee” to the national association.
This is a monetary deposit with a value equivalent to the maximum duties at risk during the
transport operator’s journey.
Before beginning a TIR journey, the operator must get a TIR carnet issued in its name. This
document, which has been standardized across every TIR nation, acts as a financial guarantee.
In the event of any irregularity during a transport operator’s journey, the TIR carnet enables
compliance-checking agencies to invoke the payments cover of duties and taxes provided by
the operator’s national association.
In addition to the customs transit guarantee system, four elements support the TIR Convention
(see figure 15):
Figure 15:
Four pillars of the TIR Convention
TIR
Identifiable
Controlled Single Harmonized
and
access to customs border
tamperproof
transporters document controls
vehicles
International guarantee valid throughout the journey
A.T. Kearney | FICCI | Connectivity-led development of Northeast India through BBIN corridor 29Controlled access to transporters. Stringent admissions criteria apply to transporters at the
time of entry into the TIR to ensure the security and reliability of the system. Among a host of
other requirements, transporters must be able to provide proof of strong financial standing,
have sustained experience in the domain of international transport, and provide adequate
knowledge of the tenets governing the TIR Convention. Moreover, the transporter must deposit
an admission guarantee of at least $5,000 per carnet before the first carnet can be issued.
Identifiable and tamper-proof vehicles. National guaranteeing associations issue certificates
of approval only to vehicles that are secure, which by definition implies the vehicle is tamper-
proof, has no concealed spaces, and can have customs seals easily affixed to its body. While on
the TIR journey, approved vehicles must bear an identifiable metallic blue plate with the TIR logo
on its body to enable easy identification by customs officials at country borders.
A single customs document. The TIR carnet is one customs document that is issued for every
TIR journey. This document is accepted as an instrument of financial guarantee by every transit
nation’s customs office, thereby allowing duty-free travel. The TIR carnet is transitioning from
paper-based to electronic with e-carnets, which has been piloted in some member states.
Harmonised border controls. A key enabler of the TIR system is the harmonisation of border
controls across TIR nations. This implies a mutual recognition of control measures across TIR
nations, thereby enabling inspection-less movement of goods across TIR nation borders.
According to the TIR system, countries of transit and destination must accept the customs
control measures taken at the country of origin as thorough and complete. Vehicles traveling
with TIR carnets, inspected thoroughly by customs at the point of origin, are allowed to pass
without having their goods inspected by customs at points of transit and destination.
The benefits of the TIR system are shown in figure 16.
Figure 16:
Benefits of the TIR system
Simple Global Efficient Secure Economical
• Uniform • About 70 • Inspection and • Only • Faster border crossings
customs contracting payment-less tamperproof for TIR operators helps
clearance parties to the transit enables: vehicles are lower transport costs
process for all TIR Convention - Shorter allowed • Single guarantee for
TIR operators journey (time) • Vehicle entire journey
• International
• Single guarantee and fewer requirements
customs system covers man hours enable
document: TIR operator - Increased irregularities to
carnet transiting across productivity be easily
any TIR nation for customs identified by
Carnet allows customs
immediate • Computerised
clearance of e-carnets allow • Stringent
• real-time requirements
vehicles at
border tracking and to be met by
advance operator to join
submission of the TIR system
data to customs
A.T. Kearney | FICCI | Connectivity-led development of Northeast India through BBIN corridor 30Table 1 summarizes the main lessons learned from the international programs profiled for
enhancing the movement of trade and transhipment across regions:
Table 1:
Lesson learned from international corridors
Type Key learnings
Infrastructure • Upgrade key highway stretches to handle increased traffic; enable fast-track
improvement lanes for goods in transit
• Upgrade existing integrated checkpoints for transit, and provide priority
clearances for transit cargo
• Enhance port capacities and draft to handle intermodal traffic
Procedure • Enable single-window clearance with relevant departments for both countries
simplification (customs, forests, etc.) at the same checkpoint
• Eliminate physical inspection of goods in transit
ICT enablement • Develop infra to enable seamless data exchange between authorities and
countries
• Develop electronic cargo tracking system for real-time tracking
• Develop a Web-based system to monitor corridor performance and identify
specific bottlenecks
Customs transit • Develop a regional customs transit guarantee framework to ensure duties and
guarantee taxes at risk during transit journeys
• Develop a risk-management system to check for fraud and expedite transport
for operators with a proven record
• Enable electronic inspection of guarantees to reduce paperwork and cases of
fraud
Harmonisation of • Harmonize standards between participating countries for truck size and
standards weights; carrier licensing, transit plates, and transit charges; and road design
and classification
3.2 Best practices from Indian states for tourism
development
Multiple Indian states have been able to develop the tourism industry with focused interven-
tions. To identify ways to develop tourism in the NER, it is essential to study the existing best
practices. In the section below, best practices from Rajasthan, Gujarat, and Uttarakhand are
examined in detail. These states have been selected based on their tourism performance, the
initiatives used to develop tourism, and the topographic similarities with the NER.
Tourism development depends on five elements (see figure 17):
A.T. Kearney | FICCI | Connectivity-led development of Northeast India through BBIN corridor 31Figure 17:
Framework for tourism development
2
1
Passenger
Connectivity amenities
Tourism
development 3
5 Development
Marketing of tourist
circuits
4
Policy
interventions
Connectivity. It is important to ease tourists’ mobility with road, rail, and air connectivity to the
region. Connectivity is a significant factor for tourists and has a substantial impact on
affordability.
Passenger amenities. The availability of passenger amenities such as hotels, cabs, and
restaurants affects travellers’ comfort and experience and plays a significant role in consumers’
decisions about destinations, especially for business and leisure travellers.
Development of tourism circuits. A tourist circuit is defined as a route typically covering three
or more tourism destinations in different cities, separated by moderate distances, with
well-defined entry and exit points. Focused development of tourist circuits enhances the
attractiveness of individual tourist locations and helps increase the duration of stays and
tourists’ spending.
Policy interventions. State government policy interventions are necessary to create a
private-player ecosystem to develop tourism-related infrastructure.
Marketing. Tourists choose vacation destinations based on top-of-the-mind recall, especially
when they are visiting a place for the first time. Hence, state marketing efforts are needed to
attract tourists.
Three states have been studied across these five dimensions to understand the best practices.
A.T. Kearney | FICCI | Connectivity-led development of Northeast India through BBIN corridor 32You can also read


