The State of Maryland on the Present Status and Future Potential of - MEI2 REPORT TO
←
→
Page content transcription
If your browser does not render page correctly, please read the page content below
MEI2 REPORT TO
The State of Maryland
on the Present Status and
Future Potential of
MARYLAND’S
CLEAN ENERGY
INNOVATION SYSTEM
ACKNOWLEDGMENTS

Support for the Preparation of this Report Has Been Provided By:

The College of Computational, Mathematical, and Natural Sciences (CMNS)
The Maryland Energy Innovation Institute (MEI2)
The University of Maryland Global Sustainability Initiative (GSI)
The A. James Clark School of Engineering

Research and Preparation of this Report Has Been Performed By:

Prof. Ellen D. Williams (Professor, Department of Physics and Institute for Physical Science and Technology)
Dr. Kavita Surana (Assistant Research Professor, School of Public Policy)
Prof. Paul Albertus (Assistant Professor, Department of Materials Science)
Mr. Wojciech Krawczyk (Graduate Student, School of Public Policy)
Mr. Michael Montgomery (Graduate Student, Department of Materials Science)
Mr. Jon O’Neill (Graduate Student, Department of Materials Science)
Mr. Zachary Thomas (Intern, Department of Physics)
Ms. Amber Ying Zhang (Graduate Student, School of Public Policy)

With Support From:

The Center for Regional Economic Competitiveness (CREC)
Dr. Kenneth Poole, Principal Researcher
Dr. Allison Forbes, Director, Research
Ms. Cathy Katona, Director, Economic Development Services
Ms. Mereb Hagos, Research Analyst
Mr. Gabriel Moss, Research Assistant
Ms. Anuradha Dhar, Research Intern

Preparation of this report has also benefited from access to the 50-state data on regional energy innovation systems
developed by the Energy Futures Initiative in collaboration with the UMD Global Sustainability Initiative; State PACE
assessments (courtesy of Environmental Finance Center at the University of Maryland); and Joint Global Change Research
Institute state scenarios projections (courtesy of Morgan Edwards).
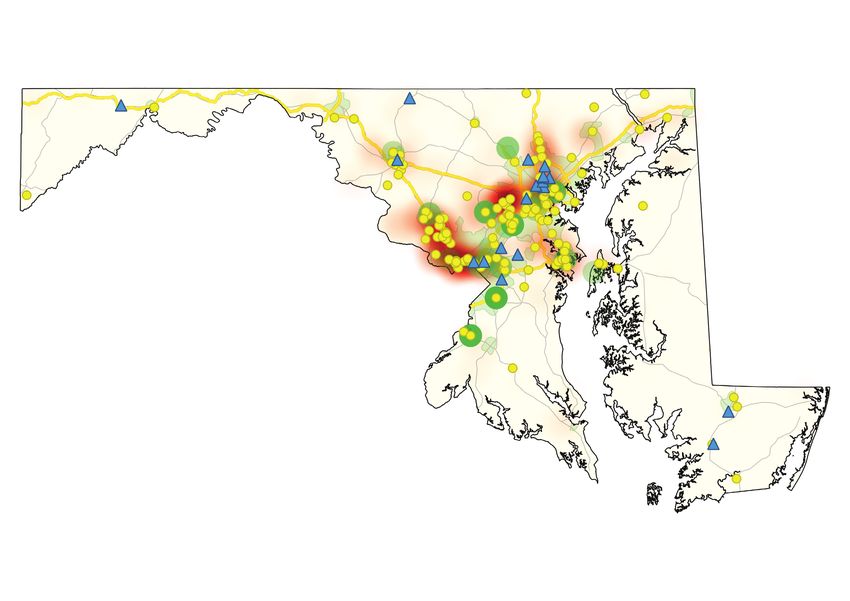
TABLE OF
      CONTENTS

ES: EXECUTIVE SUMMARY

SECTION I: INTRODUCTION
I.A      Maryland Policy Context

I.B      Maryland Strength in Innovation

I.C      Goals for Energy Innovation

I.D      Structure of the Report

SECTION II: AVAILABILITY AND EFFICIENCY OF USE OF FUNDING FOR CLEAN
ENERGY DEVELOPMENT, COMMERCIALIZATION AND DEPLOYMENT
II.A     Programs and Funding in Maryland’s Clean Energy Innovation System

II.A.1   Support for Proof of Concept and Early Commercialization
II.A.2   Support for Early Development and Market Growth
II.A.3   Department of Commerce (DOC)
II.A.4   Summary of the Maryland Funding for its Clean Energy Investment System

II.B     Status of Maryland’s Clean Energy Innovation System

II.B.1   Stage 3 to 4 Transition: Moving from Early Technology Deployment to Market Growth
II.B.2   Stages 1 and 2: From Proof of Concept, through Early Commercialization
II.B.3   Maryland’s Clean Energy Innovation System

II.C     The Health and Potential of Maryland’s Clean Energy Innovation Firms

II.D     Summary of Key Findings
REPORT TO THE STATE OF MARYLAND | 5
                                                                            MARYLAND’S ENERGY INNOVATION SYSTEM

SECTION III: FORECAST NEED FOR FUNDS FOR CLEAN ENERGY
DEVELOPMENT, DEPLOYMENT AND COMMERCIALIZATION
III.A   Comparisons Among Maryland, Colorado, New York and Connecticut

III.A.1 Direct State Financial Support for Clean Energy Commercialization
III.A.2 State Developmental Support for Clean Energy Commercialization

III.B   Metrics for Clean Energy Innovation Commercialization

III.C   Summary and Forecast Needs

SECTION IV: SOURCES AND LEVELS OF FUNDING AND FINANCING OPTIONS
IV.A    Report Findings and Recommendations

IV.B    Proposal for Maryland Clean Energy Innovation System Funding

APPENDICES:
Appendix A: Stages of Commercial Development
  A1: Definitions of Commercialization Stages Used for Assessment
		A2: Maryland Agencies and Programs: Assessment of Impact on Stages

Appendix B: Official Reports Referenced in Preparation of This Document
Appendix C: Examples of Innovative Clean Energy Technologies in Maryland
Appendix D: Management and Analysis of Database of State Firms
		D1: Data Sources and Technology Categories
		D2: Identification of Maturity of Clean Tech Firms
		D3: Analysis of Funding Timelines

Appendix E: Methodology and Summary of Comparison States
		E1: State Comparison Methodology
		E2: State Profiles

Appendix F: Interviews and Stakeholder discussions
Appendix G: Letters of Support
6 | MARYLAND ENERGY INNOVATION INSTITUTE

    EXECUTIVE
    SUMMARY
  Maryland’s future economic success depends on the ability of its
  companies and institutions to innovate – creating a competitive advantage
  in new areas that provide opportunities for its companies and citizens.
  Over the past several decades, the state systematically and successfully
  invested in commercial development based on in-state discoveries and
  intellectual property in biotechnology. Now, Maryland’s innovation in
  clean energy technologies provides another foundation on which the state
  can diversify and build a strong economic future.
  In the past decade, Maryland’s innovative scientists and        internationally. The opportunities developed through the
  engineers have taken strong advantage of new Federal            Maryland Clean Energy Innovation System will complement
  programs (primarily from the U.S. Department of Energy)         Maryland’s existing programs for increasing deployment
  designed to encourage commercial development of                 of commercially proven clean energy technologies, which
  new, cutting-edge clean energy technologies born                typically do not focus on products developed and produced
  from fundamental research. The recent establishment             in state.
  of the Maryland Energy Innovation Institute (MEI2) is a
                                                                  Opportunities and Challenges for Clean Energy
  testament to Maryland’s ability to capture innovations
  from universities and focus them toward growth of in-           Maryland’s opportunity in the clean energy innovation
  state clean energy development and manufacturing firms.         space is based on its strong technology foundations. The
  Based on the assessments carried out for this report, we        state leads in innovation (Maryland ranks 5th and 6th in
  conclude that with modest investment Maryland can build         recent rankings1) and has a strong base of research and
  on existing strengths to create a thriving Clean Energy         development (R&D) capabilities (Maryland ranks 2nd among
  Innovation System.                                              the states in annual per capita R&D expenditures, and 1st
                                                                  in per capita university R&D expenditures). Even though
  The purpose of this report is to present                        Maryland has historically not focused on clean energy as
  recommendations on how Maryland can develop                     an economic development opportunity, it now has over
  its Clean Energy Innovation System to strategically             150 clean technology firms engaged in development and
  leverage clean-technology innovations that foster               in-state manufacturing. These firms are clustered near the
  economic growth and complement the state’s strong               R&D hubs of the state around several Federal facilities,
  social commitment to energy efficiency, clean energy            state university campuses, and also distributed across the
  and the environment.                                            state from Garrett to Worcester Counties, illustrated in Fig.
                                                                  ES-1. Among these firms there is a growing cadre that have
                                                                  taken advantage of new types of Federal support designed
  The growth of innovation-based clean-energy firms
                                                                  to accelerate commercialization of innovative clean energy
  is important because this is the pathway to in-state
                                                                  technologies.
  manufacturing of new processes or products, with
  opportunities to sell or license these products nationally or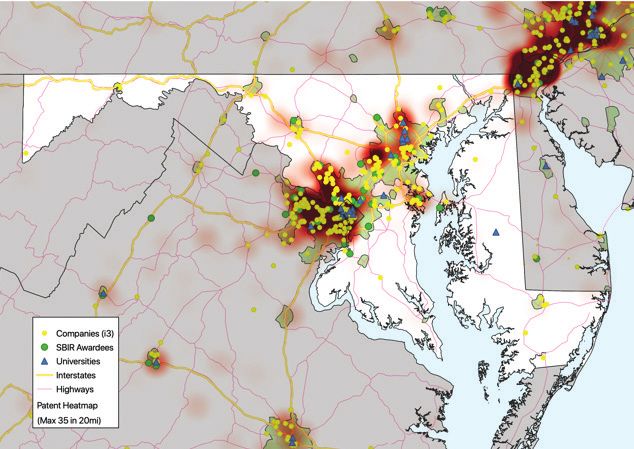
REPORT TO THE STATE OF MARYLAND | 7
                                                                                               MARYLAND’S ENERGY INNOVATION SYSTEM

                            Companies
                            Universities

                             SBIR Awardees

                             Heatmap: Patents

                      (Max 35 in 10 miles)

                            Urban Areas

FIGURE ES-1: Distribution of Maryland firms (bright yellow dots) involved in development, commercialization and manufacturing of
innovative clean energy technologies.

                                                                     Even though Maryland has clear assets and capabilities,
      State R&D Spending Distributions
                                                                     the state has until recently under-performed on what it
                                                      100            could be doing to create new economic opportunities
                                                                     that leverage the state’s strong commitment to clean
                                                      90
                                                                     energy and reduction of greenhouse gas emissions.
                                                                     The challenge is that Maryland has not focused on
                                                      80
                                                                     clean energy technology as a strategic approach to
                                                                     economic development with in-state commercial R&D
                                                      70
                                                                     and manufacturing.
                                                      60

                                                                     FIGURE ES-2: State-reported R&D spending, averaged over 2013-
                                                      50
                                                                     2017.2 Spending is reported to the NSF in the different categories
                                                                     indicated.
                                                      40

                                                                     LEFT BAR: Across the fifty states, technology focus is widely
                                                      30
                                                                     distributed. Median state spending is $5.93 per capita.
                                                      20             RIGHT BAR: MD has placed a strong strategic focus on health-
                                                                     related R&D, which has crowded out support in other areas. MD’s
                                                      10
                                                                     reported R&D spending is $4.66 per capita.

                                                      0
          State-by-state Average      Maryland

     Other                    Environment & Natural Resources
     Transportation           Agriculture
     Health                   Energy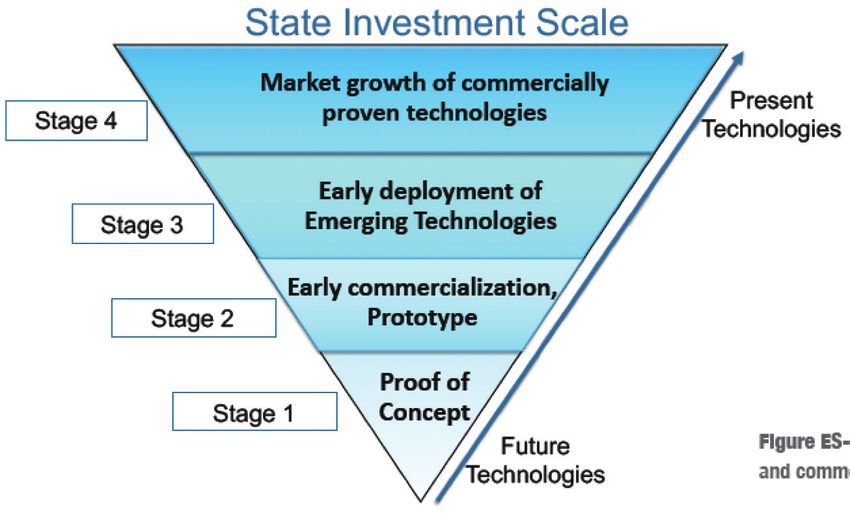
8 | MARYLAND ENERGY INNOVATION INSTITUTE

                                           Instead, Maryland has focused more narrowly than other states on a single area,
                                           health care-related technologies, as illustrated in Figure ES-2. While this positions
      Recommendation 1                     Maryland to take advantage of one research strength, it disregards a broader set of
                                           opportunities for its citizens. Notably, Maryland ranks lasts among the states in the
       The state of Maryland should
                                           diversity of its technology support with its singular focus (85% of reported state R&D
    diversify its strategic economic
                                           funding) on health-related technologies.
            development priorities to
         include multiple technology       These observations, which are developed fully in the body of this report, lead to
   pillars, beginning by specifically      the first of this report’s high-level recommendations.
           mandating a Clean Energy
  Innovation System that supports          Maryland has the opportunity to build its Clean Energy Innovation System by
       innovation, development and         leveraging new Federal programs to accelerate the commercialization of clean
    in-state manufacturing of clean        energy innovation. These programs address the future of clean energy systems
                energy technologies.       and support a diversity of technical areas. Maryland’s innovative scientists and
                                           engineers have embraced this future-looking approach to clean energy as
           The goals for the Clean         illustrated with the examples in the textbox. The companies shown are developing
        Energy Innovation System           alternative fuels, energy storage, bio-agricultural advances, and the replacement
      should align with the state’s        of energy-intensive materials. This diversity of topics is consistent with global
     social commitment to energy           trends in clean energy innovation, which is now broadly defined to encompass
  efficiency, clean energy and the         technologies that enable greater energy efficiency, lower costs for clean energy
 environment, including reduction          technology and provide new approaches to reducing greenhouse gas emissions.
    of greenhouse gas emissions.
                                           To address both Maryland’s societal and economic goals for clean energy, a
                                           broad range of enabling approaches will be needed.

                                           Examples of this breadth include:
      Recommendation 2
                                               •   Energy storage, grid modernization and demand reduction
       Future legislative language
                                               •   Biotechnology in clean energy and clean agriculture
       regarding Maryland’s Clean
Energy Innovation System should                •   Carbon dioxide removal, management and re-use
    reinforce a broad definition of            •   Clean fuels and displacement of energy-intensive products
       clean energy to ensure that
                                               •   Mobility – EVs, vehicle automation, transportation systems
     Maryland has the flexibility to
  support development of cutting-              •   Integrated systems – AI and ‘internet of things’
    edge new approaches to meet                •   New concepts in nuclear power to improve safety and lower costs
      the state’s clean energy and
 greenhouse gas reduction goals.           These observations on the technical opportunities in clean energy innovation, lead
                                           to the second high-level recommendation of the report.

                                           Designing the Clean Energy Innovation System

                                           Realizingthe goals of a thriving Clean Energy Innovation System for the state will
                                           require a planned structure of programs with metrics that can be used to gauge
                                           progress via intermediate goals. The general structure for moving innovative ideas
                                           into commercial products3,4,5 is illustrated in Fig. ES-3. Different types of support
                                           are required at each stage of development, with particular focus on coordinated
                                           state programs to address the difficulties that firms have in moving from one stage
                                           of development to the next (often called ‘valleys of death’).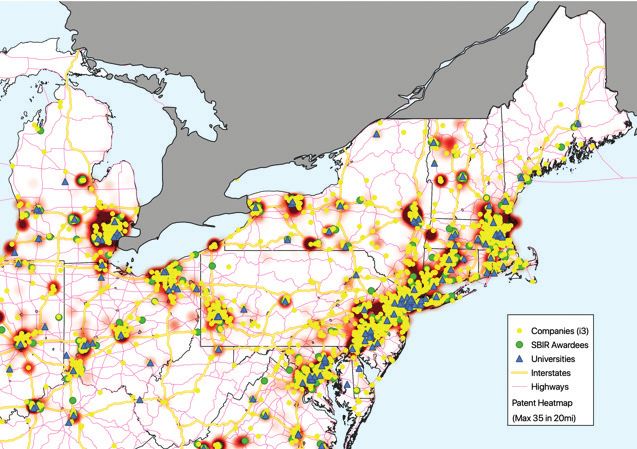
REPORT TO THE STATE OF MARYLAND | 9
                                                                                       MARYLAND’S ENERGY INNOVATION SYSTEM

Clean Energy Innovation encompasses diverse technologies

    INVENT WOOD is a start-up firm that is developing         ETCH, INC is a start-up firm that is developing a clean
  wood-based products that are strong and long-lived         and economical approach to producing hydrogen as an
 enough to replace energy-intensive building materials        alternative to fossil fuels, using an innovative concept
    such as steel and concrete. The company is using         developed at Johns Hopkins University. The production
    innovative concepts developed at the University of       method delivers valuable side products - solid carbon,
   Maryland-College Park. Their research publications         heat, and water – along with hydrogen gas. The value
     on their new wood products such as transparent           of this new approach has been demonstrated through
   wood, super wood and cooling wood have attracted            techno-economic analysis and market analysis. The
   international interest, and led the team to establish      firm was recognized as a finalist in the COSIA Natural
 their start up firm. The firm is part of a ~$4.0M ARPA-E        Gas Decarbonization Challenge and has recently
     award for scaling up and commercializing super               received an ARPA-E award of $3.7M for proof of
  wood led by the PI at University of Maryland, and also            concept and early commercial development.
  received ~ $1.25M SBIR funding from USDA and DOE
             Building Technology Office (BTO).

       ION STORAGE SYSTEMS is a young firm that is              PLANT SENSORY SYSTEMS is a young firm that is
     commercializing an innovative solid-state battery       expanding deployment of its advanced bio-agricultural
    technology that solves battery safety concerns and       technologies that reduce the need for energy-intensive
  increases the amount of energy a Li battery contains by        pesticides, fertilizer, and improve crops that are
   50%. The new technology is based on innovation by a               feedstocks for the bio-energy industry.
   University of Maryland – College Park team, leveraging
                                                              The firm has been supported by incubation at UMBC,
                $13M in Federal funds to date.
                                                               by DOE and NSF awards, by interactions with USDA,
   The development team progressed through patenting,         and has attracted private sector investors who have
    obtained commercialization funding from DOE, NASA        benefited from the Biotechnology Investment Incentive
     and Lockheed-Martin, and established supply chain        Tax Credit. The company has developed partnerships
  partnerships with other Maryland firms. It has obtained       on the Eastern Shore and in Frederick. It also has
   Stage A Venture funding of $8M, and is establishing its     developed relationships for licensing production to
  first production capability in the MEI2/MTECH incubator.           firms in other states and internationally.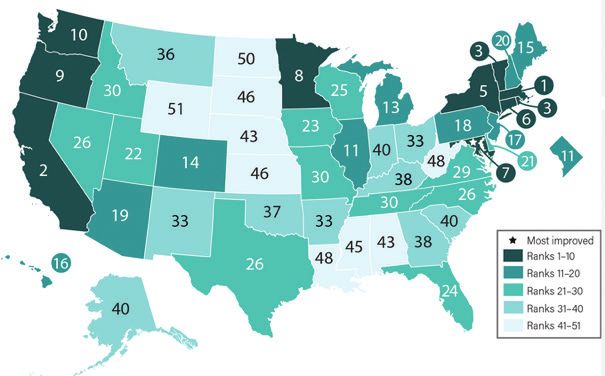
10 | MARYLAND ENERGY INNOVATION INSTITUTE

                   Government and Industrial
                                                                                                      Private Equity
                    Development Funding

                                  Seed, Angel, and Venture Funds                                      Debt Financing

     Basic               Proof of                    Early                           Early                    Market Growth
     R&D                 Concept                 Commercialization                Deployment
                                                                                                                    stage 4
                             stage 1                     stage 2                       stage 3

                                        Minimum Viable             Demonstration and                 Commercial
             Tech Creation
                                            Product                   Scale up                        Maturity

  Figure ES-3: Innovation Commercialization pathway. Adapted from references ES 3-5.

  In the early stages of development, Federal and industrial                   among these programs, Maryland’s Clean Energy
  funding generally play the largest financial role. In these                  Innovation System does not sufficiently support the
  stages, state intervention in the form of technology                         clear commercialization pathway illustrated in Fig. ES-3
  incubators, ‘seed funding’ awards, and incentives for                        or deliver the full benefits that would be possible if the
  investors can be used to keep the development of                             different areas of state spending shown in Fig. ES-4 were
  innovative technologies in-state. In the later stages of                     strategically balanced and coordinated. This observation
  development, state incentives, finance mechanisms and                        leads to the third high level recommendation of this report,
  regulatory structures can play a large role in expanding                     which is shown on the facing page.
  markets into which emerging technologies can grow. In
                                                                               To develop options that are well suited for Maryland, we
  our assessment of the Maryland Clean Energy Innovation
                                                                               selected three states for comparison: Colorado, New York
  System, we have used this structure to quantify state
                                                                               and Connecticut. These states have innovation and R&D
  financial commitments at different stages as illustrated
                                                                               rankings similar to Maryland’s, but stronger outcomes in
  in Fig. ES-4.
                                                                               clean energy innovation. One example, shown in Table
  Maryland provides support at each of these stages of                         ES-1, is the number of clean tech firms per million people
  development. In stage 4, the state support of energy                         in the state: Maryland has significantly fewer clean tech
  efficiency programs through EmPOWER provides                                 firms than would be expected based on its innovation and
  incentives for well-established commercial efficiency                        R&D strengths.
  products. In stage 3, the Maryland Energy Administration
  (MEA) supports programs to increase deployment of                                                  State Investment Scale
  renewable energy and energy efficient technologies.                                                 Market growth of commercially
                                                                                                                                          Present
  However, the authorizations for EmPOWER and MEA do                            Stage 4                   proven technologies
                                                                                                                                        Technologies
  not include supporting the development of innovative in-
                                                                                                            Early deployment of
  state firms, so their impacts in creating market-pull for new
                                                                                       Stage 3             Emerging Technologies
  technologies does not prioritize or specifically encourage
  the use of products from in-state manufacturing firms.                                                Early commercialization,
  Programs at MTech and TEDCO, designated for early-                                       Stage 2              Prototype
  stage support for any technology area, have provided                                                            Proof of
  some funding for early stage clean energy innovation, with                                     Stage 1          Concept
  strong year-to-year variability.6 Prior to the establishment                                                              Future
                                                                                                                         Technologies
  of MEI2 (which, beginning in 2018, provides $400k/yr of
  seed funding to help MD firms move from stage 1 to stage
                                                                                Figure ES-4: Stages of innovation, development
  2) and MCEC (which provided an average of $329k/yr
                                                                                and commercialization
  of stage 3 support over 2013-17), there was no support
  directed specifically toward clean energy innovation.
  One key observation from this report’s assessment is that
  the various agencies involved at different stages of the
  pipeline operate independently. Lacking coordination
REPORT TO THE STATE OF MARYLAND | 11
MARYLAND’S ENERGY INNOVATION SYSTEM
In assessing the factors underpinning the other states’ successful outcomes,
we considered developmental support (e.g. providing support through
infrastructure and mentoring), as well as direct financial support. Colorado has Recommendation 3
built on its entrepreneurial culture to develop strong developmental support for
The State should designate
early stage clean energy firms. Colorado coordinates a set of support programs
a responsible agency to
offered through universities, non-profit organizations and the Colorado Office
provide coordination among
of Economic Development and International Trade (CO-OEDIT). In New York,
the agencies that need to
New York State Energy Research and Development Authority (NYSERDA)
be involved in delivering
operates an integrated energy innovation system that incorporates a strong
the outcomes expected of
support system of incubators, business mentoring, as well as test facilities
the state’s Clean Energy
and demonstration options for in-state firms. Connecticut’s clean energy
Innovation System: Department
approach is strongly influenced by its large industrial base, and extensive
of Commerce (DOC), Public
use of tax incentives, and doesn’t provide clear lessons for Maryland’s
Service Commission (PSC -
Clean Energy Innovation System. Maryland at present has no developmental
EmPOWER), Maryland Energy
program of support specifically designed to meet the needs of innovative clean
Administration (MEA), Maryland
energy firms.
Energy Innovation Institute
The MEI2 has demonstrated, by establishing the Center for Research in (MEI2), Maryland Clean Energy
Extreme Batteries (CREB), how Maryland may provide developmental support Center (MCEC) and Maryland
through partnerships with local Federal laboratories and industry, in this case Technology Development
to advance clean energy innovation. Further progress in developing a clean Corporation (TEDCO).
energy innovation support infrastructure, similar to those successful in NY and
CO, is possible by building on Maryland’s system of biotechnology-focused
infrastructure and mentoring approaches. The University of Maryland System’s
MTECH and UM Ventures, and Johns Hopkins’ Technology Ventures all provide
support for commercialization of University innovations, with a historical focus
on biotechnology.
ITIF Innovation Potential: Number of clean tech companies
States
State Ranking per million people*
MD 6th 16
CO 7th 51
NY 11th 26
CT 10th 32
Table ES-1: Innovation scores and number of clean tech companies per unit (1 million
people) population for the comparison states. (firms comparison based on I3 database).12 | MARYLAND ENERGY INNOVATION INSTITUTE
TEDCO recently supplemented this developmental support with a state-wide
Incubator Assistance Program and a SBIR/STTR 7 proposal lab. With the
Recommendation 4 establishment of MEI2, there is now the opportunity to expand these programs
to include clean-energy specific programs as part of Maryland’s Clean Energy
As part of the state’s Clean Innovation System. This leads to the fourth high-level recommendation of this report.
Energy Innovation System
MEI2 should be tasked This report’s comparison with other states’ clean energy innovation systems also
and funded to deliver includes an assessment of direct state funding in the four stages of the clean
developmental support energy commercialization. The outcome of that assessment is shown in Fig. ES-5.
in the form of additional All three comparison states – Colorado, New York, and Connecticut provide more
infrastructure and mentoring direct funding per capita on early stage clean energy technologies (stages 1 and
specifically tailored to 2) than Maryland. New York spends three times more (200% more) Colorado 50%
the needs of early-stage more, and Connecticut 25% more per capita. Prior to 2018, Maryland’s average
clean energy firms, using early stage support of $0.33/capita did not include any funding targeting in-state
partnerships with MCEC, firms developing clean energy innovation8. Maryland also has an anomalously
TEDCO and University high ratio9 of support for market growth (stage 4) compared with early deployment
venture programs. of clean energy technologies (stage 3).
Cleantech Spending in MD, CT, CO, and NY (Per Capita)
$- $0.20 $0.40 $0.60 $0.80 $1.00 $1.20 $1.40
MD
$0.33
CT
$0.40
Stage11&
Stage & 22 CO
$0.52
NY
$1.08
Cleantech Spending in MD, CT, CO, and NY (Per Capita)
$- $10.00 $20.00 $30.00 $40.00 $50.00 $60.00
$0.33
$0.40
Stage11&
Stage & 22
$0.52
MD
$1.08
CT
$4.31
$20.34 CO
Stage 3
$2.91
NY
$6.07
$44.90
$56.27
Stage 4
$12.31
$26.94
Figure ES-5: Direct clean energy spending (per capita) relevant to commercialization in each of the comparison states, assessed as
described in Appendices A and E. Stage 1 & 2 are early development (prototype development and early commercialization). Stages 3 & 4
are later stages of development (early deployment and market growth). Values are averages over several years of funding between 2013
and 2018 for each state. For Maryland the average is for 2013-2017. Values represent assessment of spending in the commercialization
stages of Fig. ES-3 & 4, and thus do not represent all the energy-related spending in any of the states.REPORT TO THE STATE OF MARYLAND | 13
MARYLAND’S ENERGY INNOVATION SYSTEM
New York’s and Colorado’s strong outcomes in number of clean energy firms can
be reasonably attributed to the combination of their developmental support and
their higher direct funding levels for early stage clean energy innovation. These
Recommendation 5
observations, which are more deeply presented in Section III of this report, lead to As part of the state’s Clean Energy
the fifth high-level recommendation. Innovation System, MEI2 should
be tasked and funded to expand
Expanded support to establish an integrated Maryland Clean Energy Innovation
early-stage innovation funding for
System will require specific metrics, with a well-defined time-line. A clear metric
clean energy firms to a per-capita
for the Clean Energy Innovation System is to significantly increase the number and
funding level intermediate between
productivity of Maryland’s clean energy firms. Given this report’s assessments
Colorado and New York. MEI2
(see Section III) of clean energy firms’ time scale for commercial development and
should coordinate this program
private sector funding, it is reasonable to set a ten-year goal to double the rate of
with TEDCO, MIPS, and University
new clean energy firms formed each year10 and cut in half the rate at which these
venture programs.
firms fail. Progress against this goal should be based on intermediate metrics
including increased levels of Federal funding for commercialization, increased
rate of new-company formation, increased levels of private sector funding per
company and more rapid and more successful commercial growth. This outline of Recommendation 6
goals and metrics is the basis for the report’s sixth high-level recommendation.
The program to create a thriving
Each of the recommendations above is explained more fully in the report, sections Clean Energy Innovation System
I-III, along with expanded descriptions of implementation mechanisms for each. in Maryland should be managed
Based on understanding developed during preparation of this report, we also in 5-year stages and assessed
recommend further assessment of two topics related to later stage spending, as against quantitative metrics
outlined in recommendations 7 and 8. including growth in firm number,
Federal and private sector funding
per company, and rate and extent
of commercial maturation.
Recommendation 7
Given Maryland’s unusually low level of support for early deployment of new
clean energy technologies, compared with support for mature technologies,
the state should require an assessment of the potential for reallocating some
EmPOWER funds for emerging clean energy technologies that may provide
expanded consumer benefits.
Recommendation 8
The state should require an assessment of the potential for expanded impact of
EmPOWER funds by using green finance mechanisms (such as PACE11, CPACE,
Green Bank) for market growth of established clean technologies.14 | MARYLAND ENERGY INNOVATION INSTITUTE
Funding for Maryland’s Clean Energy Innovation System
Funding Maryland has successfully used a mechanism of combined tax incentives for
investment, dedicated funding through TEDCO, and indirect support via university
Recommendation 1 and other non-profit incubator services for commercialization of innovation in
The state should modify its biotechnology. Similar support is necessary if Maryland’s Clean Energy Innovation
present Investment Incentive System is to meet a key goal of increasing private sector investment and related
Tax Credits12 and associated firm maturation for clean energy firms in Maryland. To accomplish this without new
TEDCO Investment Funds13 to demands on the general fund, and in the spirit of Recommendation 2 (increasing
support investments in clean the technology diversity of Maryland’s technology-based economic development
energy technologies. DOC, goals), our first funding recommendation addresses diversification of Maryland’s
TEDCO and MEI2 should be investment incentives.
jointly responsible for delivery
Funding Recommendation 1 is specifically needed to support the goal of
of Maryland’s Clean Energy
increased private sector investment for Maryland’s portfolio of clean energy
Innovation System goals through
companies, and thus to increase the rate of successful outcomes for these in-
these programs.
state firms.
In the first two years of operation of, with an operating budget of $600k/yr for
stage 1 and 2 activities14, MEI2 has provided seed support to innovative clean
energy firms from Johns Hopkins University, University of Maryland Baltimore
Funding County and University of Maryland College Park and has demonstrated the utility
of developmental support in establishing the Center for Research in Extreme
Recommendation 2 Batteries, a consortium of University, Federal Lab and Industrial partners. As
The state should modify the discussed above, to deliver the required benefits to the state, both such early-
present allocation of the stage support and developmental support must be expanded and coordinated
Strategic Energy Investment with other support services and state programs for early deployment and market
Fund15 (SEIF) to include a growth stages. This expanded, coordinate effort is essential to delivering an
specific allocation of up to effective Clean Energy Innovation System. This leads to our second Funding
10% of the Fund’s budget to Recommendation.
support the Maryland Clean
The purpose of requested funding for the MEIF is outlined in Funding
Energy Innovation System,
Recommendations 2a, 2b and 3. Using $3M/yr of these funds MEI2 will provide
with a renewed authorization
expanded direct funding and clean-energy-focused developmental support for
considered in 5 years based on
innovative Maryland clean energy firms as per Recommendations 4 and 5. The
demonstrated progress
experience with MEI2’s first two years of providing direct support in the form of
toward goals. Of the reallocated
seed grants has shown the value and opportunity of supporting of more very
funds, $4.5M should be
early stage concepts, as well as firms that have demonstrated success in the first
allocated to the Maryland
year. At the present level of available seed funds, at most four early stage firms
Energy Innovation Fund (MEIF).
or one or two more-advanced firms can be supported in a given year. In addition
to seed grants, funds are needed to help young firms develop partnerships
with established firms or participate in funding opportunities that require they
provide matching money. Often this is an unsurmountable obstacle to young
firms, resulting in unnecessary company failures. State support for such matching
provides leverage for growth.REPORT TO THE STATE OF MARYLAND | 15
MARYLAND’S ENERGY INNOVATION SYSTEM
Funding Recommendation 2a’s allocation of additional
support of $2M/yr for seed funds, partnerships and
matching would increase Maryland’s level of stage 1 & Funding Recommendation 2a
2 support (as per Fig. ES-4) by $0.29 per capita. If the
Of the requested allocation from the SEIF to MEIF,
level of clean energy innovation support from MIPS and
$2 M/yr should be designated for expanded direct
TEDCO continues at its recent average rate ($0.33 per
support of innovative clean energy firms through the
capita), this would bring Maryland’s direct early stage
Clean Energy Seed Fund and the Partnerships and
funding (stages 1 & 2 as per Figures ES-4 and 5) to
Matching Fund.
$0.63 per capita. This is 20% higher than Colorado’s
value of $0.52 per capita and 40% lower than New York’s The expanded Clean Energy Seed Fund will provide
value of $1.08 per capita. awards to early stage innovation projects and later
stage projects that have demonstrated strong potential
Developmental support, which is the focus of
to leverage the seed funds to attract additional
recommendation 2b, when designed for the challenges
investment. The Partnerships and Matching Fund
clean energy firms must address, makes a crucial
will provide awards for development of partnerships
difference in the success of young firms. Developmental
with industry or Federal laboratories and to provide
support includes:
matching funding for clean tech firms applying
• Mentoring in technical and business issues for MIPS funding or other programs that require
essential to commercialization matching funds.
• Space (incubator) and seed funding MEI2 will lead in coordination with DOC, MCEC, TEDCO,
• Networking to develop supply chains, early and University Venture programs, and all will be jointly
markets and investment opportunities responsible for delivery of Maryland Energy Innovation
goals through the seed and matching programs.
• Networking and incentives for partnerships with
established businesses
• Guidance in accessing Federal, state and local
incentives and funding opportunities Funding Recommendation 2b
In addition to the direct support of the Maryland Energy Of the requested allocation from the SEIF to MEIF,
Innovation System under funding recommendations 2, $1 M/yr should be designated for developmental support
2a, and 2b, the reallocation of SEIF funds to MEIF should of Maryland clean energy firms through an innovation
also include increased support for MCEC’s outreach acceleration program.
and finance activities, which are an important resource
for clean energy innovation in the state. In particular, MEI2 will lead and work closely with MCEC and TEDCO
MCEC should use its financing and bonding authorities to provide awards to develop effective programs at
to support in-state clean energy manufacturing firms in Universities and other sites across the state. MEI2,
stage 3 (early deployment) through opportunities to test MCEC and TEDCO will be jointly responsible for delivery
and demonstrate their products in real applications. of Maryland Clean Energy Innovation System goals
through the innovation acceleration program.
Funding Recommendation 3
Of the requested allocation from the SEIF to the MEIF,
$1.5M/yr should be designated for support for MCEC
outreach programs and for use of MCEC’s financing
and bonding authority to leverage stage 3 deployment
of MD-developed clean energy technologies.16 | MARYLAND ENERGY INNOVATION INSTITUTE
SECTION I: INTRODUCTION
The economic opportunities due to growing development and deployment
of clean energy technologies are strong.
Worldwide, new investments in clean energy have Maryland is well positioned to support economic
exceeded $300 Bn annually in every year beginning in development through innovation because of its strong
2014,16 with more than $50 Bn/yr in the United States. research and development (R&D) capabilities, university
Venture investments, which are a significant source of system, and educated workforce. In the past decade,
support for the early stages of commercial deployment, Maryland University teams and small firms have been
have grown steadily from global levels of just above successful in attracting funding under new Federal funding
$12 Bn/yr in 2014 to more than $30 Bn in 201817. For programs designed to move innovative clean energy
states such as Maryland, where the statewide societal technology concepts into commercialization, as illustrated
commitment to clean energy is far more homogeneous in Section I.C and in Appendix C. Such programs
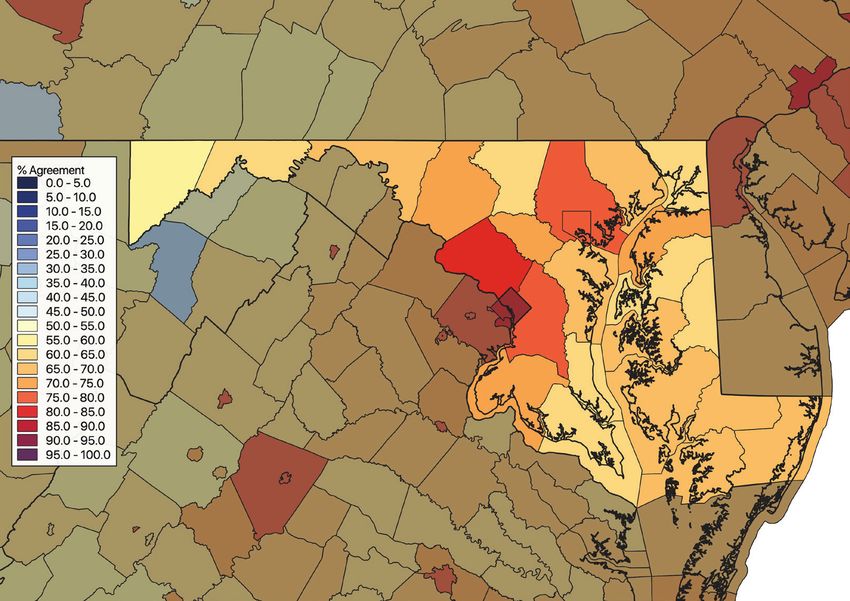
than the US overall, as illustrated in Figure I-1, the growing have demonstrated impact and attracted growing
world market provides a natural opportunity to develop Federal budgets19.
correlated economic development opportunities.
Figure I-1: Maryland public
opinions about climate change
issues are more homogeneous
than in the US overall, from the
Yale Climate Opinion surveys.18
Map illustrates that agreement
with a policy to “Set strict CO2
limits on existing coal-fired
power plants,” ranges from
54%-79% by county. Across the
US, county-by county agreement
with this statement ranges from
37%-80%.REPORT TO THE STATE OF MARYLAND | 17
MARYLAND’S ENERGY INNOVATION SYSTEM
In this report, which is required under Senate Bill 313, Chapter 365, “An Act
concerning economic development – Maryland Energy Innovation Institute,” we
will assess the status of clean energy technology innovation in Maryland and
its potential to expand the benefits of Maryland’s already-strong commitment
to clean energy. In the following sub-sections of this introduction we outline the
context provided by Maryland’s clean energy policies, its strengths in research
and development and technical innovation, and goals for increased clean energy
innovation and commercial deployment in Maryland. The overall goal of this report
is to present recommendations on how Maryland can develop its Clean Energy
Innovation System to strategically leverage clean-technology innovations that
foster economic growth and complement the state’s strong social commitment to
energy efficiency, clean energy and the environment.
I.A Maryland Policy Context12
2004
1st RPS
Maryland has actively and directly engaged in incentivizing energy efficiency and
renewable energy deployment. This is indicated by Maryland’s early adoption of
a renewable portfolio in 2004. In 2007, Maryland joined the Regional Greenhouse
Gas Initiative, a market-based program to cut greenhouse gas emissions that
2007
issues allowances and sets up mechanisms for regional CO2 allowance auctions Regional Greenhouse
and limits emissions of CO2 from electric power plants20. In 2009, Maryland Gas Initiative
enacted the Greenhouse Gas Emissions Reduction Act, which established a 2007
Clean Cars Act
statutory requirement to reduce emissions by 25 percent by the year 2020, and
which has since been updated to require a 40 percent reduction of emissions from
2006 levels by 203021. The EmPOWER Maryland Energy Efficiency Act of 2008
established a goal to reduce per capita electricity usage and peak demand by 15 2008
percent by 201522. It has been extended until 2023 with Senate Bill 185/House Bill EmPOWER
51423. Additional initiatives include the Clean Cars Act in 2007, and the Maryland
Wind Offshore Act in 201324. In 2019, Maryland passed the Clean Energy Jobs Act
which requires 50% of electricity from renewables by 203025. The Governor has
subsequently proposed the Clean and Renewable Energy Standards plan to take 2009
Greenhouse Gas
Maryland to 100% clean and renewable electricity by 204026. Reduction Act
Maryland’s policy projections will have profound impacts on the future of
Maryland’s energy system, in particular its electric power system – both the in-
state and out-of state generation of the electricity consumed in state as shown in
the text box27, and the distribution system that supports delivery of electricity to
Maryland’s residential commercial and industrial consumers.
2013
Maryland’s clean energy aspirations have included aspirations for correlated state MD Wind Offshore Act
economic development, including “the possibility of becoming a world leader in
the development of clean and renewable energy, alternative fuels, green building
technologies and cleaner burning cars”.28 However, as we will discuss in Section
II, the majority of Maryland’s support for clean energy technologies has focused
on deployment without attention to in-state development and manufacturing.
The establishment of the Maryland Energy Innovation Institute in 201729 was a
concrete step in recognizing the potential for drawing on Maryland’s strengths
in innovation to develop economic benefits correlated with Maryland’s existing
commitments to clean energy.
2019
Clean Energy Jobs Act18 | MARYLAND ENERGY INNOVATION INSTITUTE
Maryland’s Changing Energy System
Maryland’s ambitious clean energy policies – including the Clean Energy Jobs Act and the Greenhous Gas
Reduction Act – will result in major changes in electricity use in the state over the next decade. These changes
will provide opportunities for economic growth based on in-state innovative technology firms in areas such as
grid storage, grid optimization, power electronics, and new business models based on distributed, clean power.
They will also affect the context in which the state’s EmPOWER energy efficiency programs are renewed in 2024,
with support for energy storage and electrification of transportation and heating becoming increasingly important.
The figure below presents historical electricity generation and imports by source, and future projections for 2025
and 2030 based on current policies. Additional policies beyond 2030, for instance the 100% clean electricity
goal for 2040 embodied in the proposed Clean and Renewable Energy Standard (CARES), would require further
changes to the electricity mix.
60
50
Electricity Consumption (MWh)
40
in millions
30
10
10
0
1990 1995 2000 2005 2010 2015 2025 2030
Imports
CCS Wind Nuclear Oil Coal
(w/ RECs)
Other Solar Hydro Biomass Gas
FIGURE I-2: Electricity consumption in Maryland including in-state generation and other imports (“other” category on the
chart). Data from 1990-2017 are taken from EIAa, and imports with RECs are estimated by taking the difference between
the RPS requirement and qualified in-state generation (and validated using reported compliance from the Public Service
Commission). Projections for 2025 and 2030 represent a possible generation and import mix for complying with the state RPS.
They are based on a simulation of current policies throughout the U.S. and modeled in the Global Change Assessment Model
(GCAM). Qualified renewable generation increases from 16% in 2017 to 50% in 2030.
Maryland is a net importer of electricity, and historically the state has satisfied the majority of its RPS requirement
with out-of-state generation. For example, in 2017, approximately 25% of renewable energy credits (RECs) retired
were in-state, with the remainder coming from out-of-state electricity sources.d By investing in in-state clean
energy technology development and deployment, and coordinating its EmPOWER and SEIF programs with the
goals of the RPS and the Greenhouse Gas Reduction Act, Maryland could increase the share of its RPS satisfied
in state, and bring more savings for consumers, jobs and investment to local communities.REPORT TO THE STATE OF MARYLAND | 19
MARYLAND’S ENERGY INNOVATION SYSTEM
I.B Maryland Strength in Innovation R&D Spending ($ billion)
25
Maryland ranks highly in technology innovation among
the 50 states. The Bloomberg 2019 U.S. State Innovation
index places Maryland 5th, surpassed only by California, 20
Massachusetts, Washington and Connecticut,31 and
Maryland ranks 6th in the 2017 State New Economy
Index.32 One factor in Maryland’s strong innovation 15
rankings is its exceptional record of in-state R&D activity
illustrated in Fig. I-3. Maryland ranks 2nd among the 50
10
states in annual average per capita R&D performed,
and 1st in annual average per capita R&D performed
in universities.33 5
Maryland has demonstrated the ability to use its R&D
capabilities for economic development in the state 0
2012 2013 2014 2015 2016
through decades of support in the area of biotechnology34.
However, Maryland has not expanded its success
State Higher Education
to other areas, including clean energy technologies. Non profit FFRDC
Instead, Maryland stands out among all the states in Business Federal
the US due the narrow technology focus in its state FIGURE I-3: R&D performed in Maryland 2012-2016. R&D, by
supported research and development, as shown in Figure Federal agencies, Federally funded research and development
I-4. Maryland’s strong strategic focus on health-related centers (FFRDCs), higher education, and business, non-profit and
R&D has resulted in on-average 85% of the state’s total state sectors
reported35 R&D spending being allocated to health-related
areas. As a result, R&D spending in all the other areas
(agriculture, energy, environment and natural resources, State R&D Spending Distributions
transportation and other) are squeezed, leaving Maryland 100
with the least diversity in its targeted technology areas
among all fifty states. 90
80
70
60
50
40
30
FIGURE I-4: State-reported R&D spending, averaged over
2013-2017. Spending is reported to the NSF30 in the different 20
categories indicated.
10
LEFT BAR: Across the fifty states, technology focus is widely
distributed. Median state spending is $5.93/capita. 0
State-by-state Average Maryland
RIGHT BAR: Maryland has placed a strong strategic focus on
health-related R&D, which has crowded out support in other areas. Other Environment & Natural Resources
Maryland’s reported R&D spending is $4.66/capita. Transportation Agriculture
Health Energy20 | MARYLAND ENERGY INNOVATION INSTITUTE
FIGURE I-5: The number of clean tech firms per million people in each, modified from the I3 data base (see Appendix D) versus the
states’ innovation rankings in the New State Economy Index. Maryland and three selected comparison states are highlighted with
red text.
Given this lack of strategic state support for clean energy, it is not surprising that Maryland’s innovation ranking is much
lower in the Clean Tech Leadership Index36 (15th in 2017), compared with its overall innovation rankings (5th and 6th
in Bloomberg and ITIF scoring, see above). The number of clean tech firms per capita, which is a concrete indicator
of a state’s strength in energy innovation, is shown versus the State New Economy Index ranking in Fig. I-5. Despite
Maryland’s strong innovation capabilities, it falls significantly below other states with strong innovation rankings in the
number of clean energy firms. Among the top 18 states in innovation ranking, only Virginia and Michigan fall lower than
Maryland in the per capita number of clean energy companies in the state. In section III, we present a comparison of the
structure, funding levels, and outcomes of Maryland’s clean energy system with states of comparable innovation ranking,
but stronger numbers of cleantech firms (NY, CT, and CO).
I.C Goals for Energy Innovation
The energy system is undergoing profound changes, in the world, in the US and in Maryland, and innovation provides us
one mechanism to ensure that Maryland leads rather than only responds to those changes. The technologies needed to
shape the future energy system will extend to include new areas such as:
• Energy storage, grid modernization and demand reduction
• Biotechnology in clean energy, agriculture and forestry
• Clean fuels and displacement of energy-intensive products
• Carbon dioxide removal and management
• Mobility – EVs, vehicle automation, transportation systems
• Integrated systems – AI and ‘internet of things’
• New concepts in nuclear power to improve safety and lower costs
Four examples of the innovation potential demonstrated by young Maryland firms are shown in the textbox. A more
extensive listing of Maryland firms that have demonstrated potential is provided in Appendix C.REPORT TO THE STATE OF MARYLAND | 21
MARYLAND’S ENERGY INNOVATION SYSTEM
Clean Energy Innovation encompasses diverse technologies
INVENT WOOD is a start-up firm that is developing ETCH, INC is a start-up firm that is developing a clean
wood-based products that are strong and long-lived and economical approach to producing hydrogen as an
enough to replace energy-intensive building materials alternative to fossil fuels, using an innovative concept
such as steel and concrete. The company is using developed at Johns Hopkins University. The production
innovative concepts developed at the University of method delivers valuable side products - solid carbon,
Maryland-College Park. Their research publications heat, and water – along with hydrogen gas. The value
on their new wood products such as transparent of this new approach has been demonstrated through
wood, super wood and cooling wood have attracted techno-economic analysis and market analysis. The
international interest, and led the team to establish firm was recognized as a finalist in the COSIA Natural
their start up firm. The firm is part of a ~$4.0M ARPA-E Gas Decarbonization Challenge and has recently
award for scaling up and commercializing super received an ARPA-E award of $3.7M for proof of
wood led by the PI at University of Maryland, and also concept and early commercial development.
received ~ $1.25M SBIR funding from USDA and DOE
Building Technology Office (BTO).
ION STORAGE SYSTEMS is a young firm that is PLANT SENSORY SYSTEMS is a young firm that is
commercializing an innovative solid-state battery expanding deployment of its advanced bio-agricultural
technology that solves battery safety concerns and technologies that reduce the need for energy-intensive
increases the amount of energy a Li battery contains by pesticides, fertilizer, and improve crops that are
50%. The new technology is based on innovation by a feedstocks for the bio-energy industry.
University of Maryland – College Park team, leveraging
The firm has been supported by incubation at UMBC,
$13M in Federal funds to date.
by DOE and NSF awards, by interactions with USDA,
The development team progressed through patenting, and has attracted private sector investors who have
obtained commercialization funding from DOE, NASA benefited from the Biotechnology Investment Incentive
and Lockheed-Martin, and established supply chain Tax Credit. The company has developed partnerships
partnerships with other Maryland firms. It has obtained on the Eastern Shore and in Frederick. It also has
Stage A Venture funding of $8M, and is establishing its developed relationships for licensing production to
first production capability in the MEI2/MTECH incubator. firms in other states and internationally.22 | MARYLAND ENERGY INNOVATION INSTITUTE
Because of the growing changes in the energy system, the goals for Maryland’s Clean Energy Innovation System must
include a broad perspective on the definition of clean energy. The text below proposes language to set goals that
effectively encompass the future and evolving opportunities in clean energy innovation:
Goals Statement
The Maryland Clean Energy Innovation System shall be designed to leverage Maryland’s strong position in
innovation, Federally funded University research, and societal commitment to clean energy to deliver in-state
commercialization and deployment of advanced clean energy technologies for the energy system of the future.
Clean energy innovation programs shall be structured to adapt to new technical opportunities and approaches,
and will identify scientific advances and cutting-edge innovations. They will be tasked to accelerate innovations
through the multiple stages of commercial development to deliver the economic and environmental benefits of:
1. A growing number of commercial firms in Maryland that attract investment, generate revenues, and grow
employment in development and manufacturing of the advanced clean energy technologies of the future
2. Increasing deployment of more effective technologies that contribute directly or indirectly to producing
energy from clean and renewable sources, to improving efficiency in the use of energy, or to reducing
emissions including greenhouse gases.
I.D Structure of the Report
The remainder of this report is structured to sequentially address the three topics spelled out in the authorizing legislation:
Section II: the availability and efficacy of the use of funds for the development and deployment of clean energy
technology in the State and the commercialization of that technology
Section III: the forecast need, if any, for additional funding or financing options for these purposes
Section IV: appropriate sources and levels of funding and financing options for these purposes
In Section II, we categorize Maryland’s use of clean energy funds in terms of their application to the different stages of
commercial development, and how well the different activities are integrated to support state economic development.
In Section III, we use comparisons with other states that are comparable to Maryland in innovation capability to identify
mechanisms and funding levels that have supported better energy innovation outcomes. We use these results to identify
approaches to improve Maryland’s clean energy innovation outcomes, and the resulting forecasted needs for state
support. In section IV we briefly summarize the recommendations of this report and present a plan of action with better
coordination among state agencies, clear metrics for desired improvements in Maryland’s clean energy innovation
outcomes, and options for funding and financing.REPORT TO THE STATE OF MARYLAND | 23 MARYLAND’S ENERGY INNOVATION SYSTEM
24 | MARYLAND ENERGY INNOVATION INSTITUTE

  SECTION II
  Availability and efficiency of the use of funding for clean energy
  development, commercialization and deployment

  Here we address the first of the three topics requested for              To be successful, an innovation system must address
  this report, evaluating “the availability and efficiency of the          each stage individually, and also ensure coordination
  use of funds for the development and deployment of clean                 among the stages so that individual technologies have
  energy technology in the State and the commercialization                 opportunities to move forward. In evaluating Maryland’s
  of that technology.” In making this evaluation, we consider              Clean Energy Innovation System, we use the definitions
  the present Maryland energy innovation system in terms                   and structure outlined in the textbox. The definitions are
  of the stages of commercial development beginning with                   explained further in Appendix A.1.
  innovative new ideas, and moving through entrepreneurial
  development of commercial practicality, and on to early
  deployment and then market growth. The basic steps
  in the pathway of a new technology from discovery to
  market37,38,39,40 are illustrated in Figure II-1:

                     Government and Industrial
                                                                                                        Private Equity
                      Development Funding

                                   Seed, Angel, and Venture Funds                                      Debt Financing

     Basic                 Proof of                      Early                           Early                 Market Growth
     R&D                   Concept                   Commercialization                Deployment
                                                                                                                     stage 4
                              stage 1                        stage 2                       stage 3

                                            Minimum Viable             Demonstration and              Commercial
              Tech Creation
                                                Product                   Scale up                     Maturity

  Figure II-1: Innovation Commercialization pathway. Adapted from references 37–40.
REPORT TO THE STATE OF MARYLAND | 25
MARYLAND’S ENERGY INNOVATION SYSTEM
Defining the Stages of Development, Commercialization and Deployment
Proof of Concept: The early stage research that Early Deployment: Further growth occurs as
leads to innovative ideas is often supported by the companies demonstrate their first (‘first-of-
basic research grants, and the resulting ideas a-kind’) manufacturing capability and begin to
must be further developed to determine whether deploy products. Development costs require
they have practical technical potential – this is the expanded private sector investment, which will be
proof of concept stage. The potential of promising strongly influenced by assessment of the market
technologies is often lost in a ‘valley of death’ pull for the product. The Early Deployment stage
resulting from limited support to accomplish the represents another ‘valley of death,’ where promising
transition into and through the next stage technologies often founder due to lack of the
of development. investment needed for growth.
Early Commercialization: Demonstration of Market Growth: Technologies that succeed in
practical technical potential must be followed deploying a viable project will see production costs
by development of practical commercialization driven down due to the ‘learning curve’ resulting from
potential, which may include developing supply further R&D and manufacturing experience, making
chains, scale-up to manufacturing, identifying first their products more competitive. They will be able
markets, and demonstrating robust operations in a to attract loans to expand manufacturing and sales.
working prototype. During this stage of development, Government regulations and incentives can impact
successful companies will begin to attract private the rate of market growth dramatically.
sector investment.
Development R&D Time Line for
Finance Impact
Stage Costs
Continuous
Loans, Sales
Multiple years to
,
ds
improvement
try n
Market decades, technology
us t Fu
after 1st of a kind
Ind men s,
lop nk
Growth dependent
costs
ve Ba
3-10 years to
De
Early 5-10x prototype commercial
Deployment
Equity
manufacturing
Str tur l,
ate e,
Ve nge
gic
2-6 years to
A
n
Early Commercialization, 10x proof of prepare for
Prototype concept
deployment
ic
rop
Grants
Ph te, l,
Sta dera
Proof of Concept for Technology
nth
Future
Fe
ila
Early Stage Innovation dependent technologies
Figure II-2: The stages of commercial development from innovation to market growth. Success in this pathway is crucially
dependent on transitions between the stages.You can also read