GENDER-BASED VIOLENCE ON PUBLIC TRANSPORT - WOMEN AND GIRLS' EXPERIENCES OF IN GAUTENG & THE WESTERN CAPE PROVINCE
←
→
Page content transcription
If your browser does not render page correctly, please read the page content below
WOMEN AND GIRLS’ EXPERIENCES OF
   GENDER-BASED VIOLENCE
    ON PUBLIC TRANSPORT
      IN GAUTENG & THE
   WESTERN CAPE PROVINCE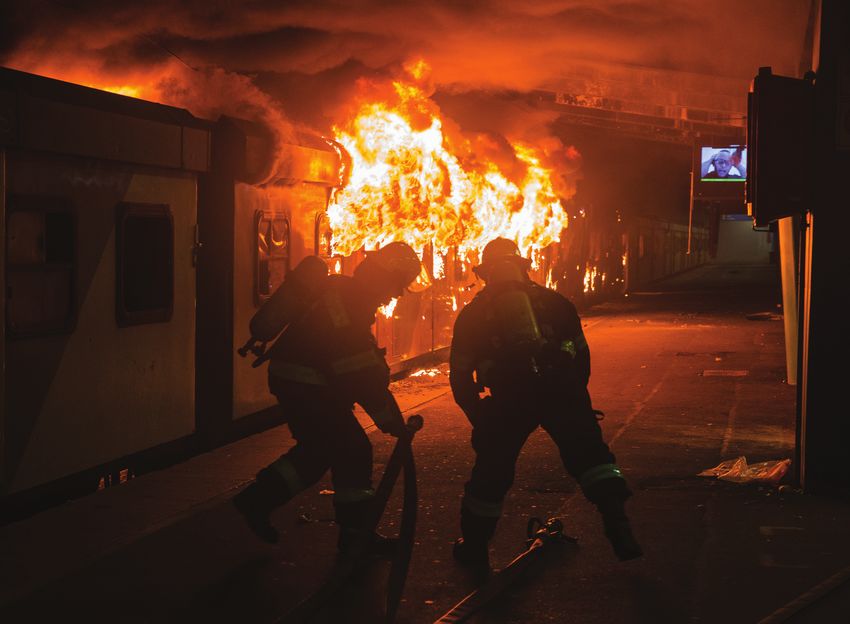
First Published in 2019 by Sonke Gender Justice
                             © 2019 Sonke Gender Justice, Cape Town
                                    www.genderjustice.org.za

 All rights reserved. No part of this publication may be reproduced, stored in a retrieval system
or transmitted, in any form or by any means, electronic, mechanical, photocopying, recording or
                 otherwise, without the prior written permission of the publisher.

                               Report compiled by: Zanele Mabaso

 Citation: Mabaso, Z. (2019). Women and girls’ experiences of gender-based violence in Gauteng
              and the Western Cape Province. Sonke Gender Justice, South Africa.

Sonke Gender Justice would like to thank the research participants for their courage and
willingness to share their lived experiences. The researcher would also like to acknowledge and
thank the organisations and individuals who were involved with the research and appreciative
thanks to Siphokazi Sikawuti, Yvonne Shwane, Thobeka Gxoyiya, Kayan Leung, Fredalene Booysen,
Nonhlanhla Skosana and Joseph Rasethe for the valued contributions, guidance and lavish support.

Data entry: Melissa Ofoedu
Editing: Penny Morrell
Design: Jaywalk Design
Photography: Ground Up and Umbono Art Media
Printed by: Silver B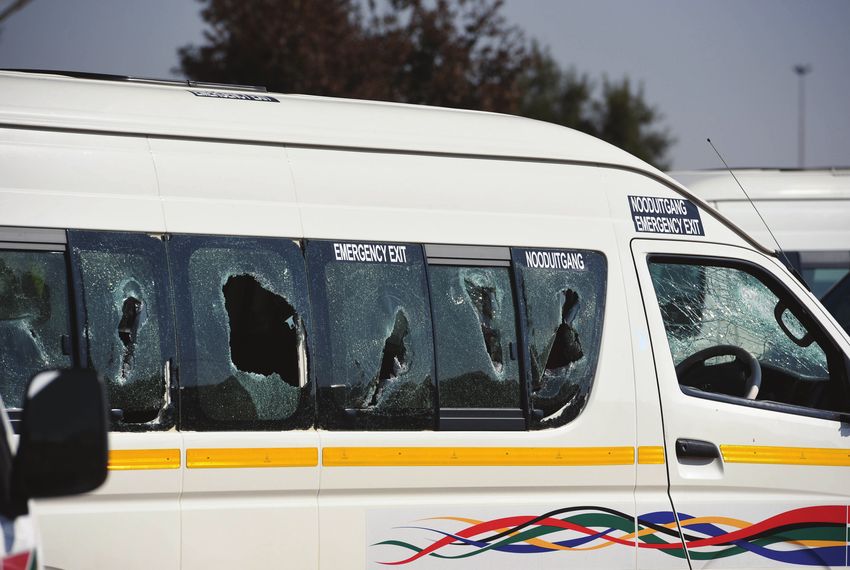
TABLE OF CONTENTS
TABLE OF CONTENTS..............................................................................................................................1
ACRONYMS and ABBREVIATIONS........................................................................................................ 3
GLOSSARY OF TERMS............................................................................................................................. 4
1.      EXECUTIVE SUMMARY.................................................................................................................... 5
2.      INTRODUCTION............................................................................................................................... 8
     2.1 Background.................................................................................................................................... 11
        2.1.1 Poverty, women and girls........................................................................................................................... 11
        2.1.2 Safety and security.................................................................................................................................... 12
        2.1.3 Evidence and research.............................................................................................................................. 13
        2.1.4 What can be done...................................................................................................................................... 13
     2.2 The provision of public transport in South Africa...................................................................15
        2.2.1 Trains................................................................................................................................................................ 15
        2.2.2 Mini-bus taxis.............................................................................................................................................. 15
        2.2.3 Buses.............................................................................................................................................................. 16
3.      METHODOLOGY..............................................................................................................................17
     3.1 Aims and objectives......................................................................................................................18
     3.2 Research study methods and data collection instruments....................................................18
        3.2.1 Target audience........................................................................................................................................... 18
        3.2.2 The surveys.................................................................................................................................................. 18
        3.2.3 Focus group discussions........................................................................................................................ 19
        3.2.4 Collation of data........................................................................................................................................ 19
     3.3 Project phases..............................................................................................................................20
        3.3.1 Phase 1: Project Inception.......................................................................................................................20
        3.3.2 Phase 2: Participatory research tools testing................................................................................20
        3.3.3 Phase 3: Field worker training and data collection process....................................................20
        3.3.4 Phase 4: Data entry and analysis processes..................................................................................20
        3.3.5 Phase 5: Inter-project consultations.................................................................................................20
        3.3.6 Phase 6: Post-research interventions................................................................................................ 21
4.      DEMOGRAPHICS AND PROFILE OF SURVEY RESPONDENTS............................................... 22
     4.1 PROFILE OF SURVEY RESPONDENTS...................................................................................... 23
        4.1.1 Gender............................................................................................................................................................ 23
        4.1.2 Age.................................................................................................................................................................. 23
        4.1.3 Children......................................................................................................................................................... 24
        4.1.4 Occupation.................................................................................................................................................. 25
        4.1.5 Residence and location........................................................................................................................... 26
5.      FINDINGS........................................................................................................................................ 28
     5.1 Frequency of use and time spent on public transport...........................................................29
        5.1.1 Frequency of public transport use....................................................................................................... 29
        5.1.2 Number of trips and modes of transport......................................................................................... 29
        5.1.3 Time spent on public transport............................................................................................................30
        5.1.4 Summary....................................................................................................................................................... 32

                                                                                                                                                                                     1
5.2 Women’s perceptions of risk to their safety and personal security.................................... 32
         5.2.1 Pickpocketed or robbed......................................................................................................................... 33
         5.2.2 Sexually harassed and/or grope........................................................................................................ 33
         5.2.3 Only men on board...................................................................................................................................34
         5.2.4 Public transport at night........................................................................................................................34
      5.3 Experiences of violence and abuse on public transport....................................................... 35
         5.3.1 Sexual assault and violence....................................................................................................................35
         5.3.2 Visual and verbal harassment...............................................................................................................36
         5.3.3 Violence and crime...................................................................................................................................37
         5.3.4 Drivers...........................................................................................................................................................40
         5.3.5 While waiting/walking.............................................................................................................................40
         5.3.6 Persons with disabilities.........................................................................................................................41
      5.4 Crime or danger situations and hotspots................................................................................ 42
         5.4.1 Situations.......................................................................................................................................................42
         5.4.2 Hot spots......................................................................................................................................................43
      5.5 Why women don’t report these experiences.......................................................................... 45
      5.6 Safety precautions taken by women and girls who use public transport........................... 46
         5.6.1 Main safety precautions suggested by survey respondents......................................................47
         5.6.2 Public transport that is considered safe to use.............................................................................48
         5.6.3 Immediate actions to mitigate crimes, gender-based violence and sexual harassment......49
6.       SAFE PUBLIC TRANSPORT PRACTICES IN OTHER COUNTRIES........................................... 51
      6.1 Seoul............................................................................................................................................... 52
      6.2 India............................................................................................................................................... 52
      6.3 Sweden.......................................................................................................................................... 54
      6.4 France........................................................................................................................................... 54
      6.5 Mexico........................................................................................................................................... 54
7.       RECOMMENDATIONS AND FUTURE RESEARCH...................................................................... 55
      7.1 Programmatic Recommendations for immediate action........................................................ 56
         7.1.1 Infrastructure..................................................................................................................................................56
         7.1.2 Training............................................................................................................................................................56
         7.1.3 Reporting.......................................................................................................................................................57
         7.1.4 Accountability..............................................................................................................................................57
         7.1.5 Community interventions.........................................................................................................................57
      7.2 Systematic Long-term recommendations................................................................................ 58
         7.2.1 Stakeholder mobilisation..........................................................................................................................58
         7.2.2 Policy Interventions...................................................................................................................................58
         7.2.3 Education and capacity building.........................................................................................................59
      7.3 Future research............................................................................................................................ 60
8.       REFERENCES.................................................................................................................................. 62
      Additional references........................................................................................................................ 64
9.       APPENDIX A: Residential areas in which survey participants are located........................... 66
10. LIST OF FIGURES........................................................................................................................... 69
11.      LIST OF TABLES............................................................................................................................. 69

2
ACRONYMS and ABBREVIATIONS
      CBD    Central Business District
             Convention on the Elimination of all forms of Discrimination Against
   CEDAW
             Women
      CGE    Commission for Gender Equality
      CPT    Cape Town
      DoH    Department of Health
      FGD    Focus group discussion
      GBV    Gender-based violence
       GP    Gauteng Province
      JHB    Johannesburg
     NEET    Not in employment, education or training
     NHTS    National Household Travel Survey
NSP on GBV   National Strategic Plan on Gender-Based Violence
    NSPTP    National Safety in Public Transport Policy
   PEPUDA    Promotion of Equality and Prevention of Unfair Discrimination Act
    PRASA    Passenger Rail Agency of South Africa
    PUTCO    Public Utility Transport Corporation
     SDGs    Sustainable Development Goals
     Sonke   Sonke Gender Justice
       UN    United Nations
       WC    Western Cape Province
     WFC     Women Friendly City

                                                                                    3
GLOSSARY OF TERMS
Cat-calling is a form of street harassment of women and refers to men shouting rude sexual
remarks that are often sexually suggestive, threatening or derisive. It includes behaviours like
“kissing noises”, gestures, wolf-whistling, persistent sexual advances as well as unwanted non-
sexually explicit comments. In this report, cat-calling is considered a form of harassment (visual,
verbal and sexual).

Gender refers to the social, cultural and economic constructs, norms and expectations based
on binary biological characteristics, male and female. Gender is not the same as sex (biological
characteristics of male and female). Gender differences have been learned, are changeable over
time and have wide variations both within and between cultures.

Gender equality refers to a situation where women and men have equal rights for realising their
full human rights and potential; can contribute equally to national, political, economic, social and
cultural development and benefit equally from the results. Achieving gender equality entails the
systematic identification and removal of the underlying causes of discrimination. The context of
this report is one in which there is a lack of gender equality and women are largely in socially
subordinate positions.

Gender-based violence (GBV) is violence against another person because of their gender, gender
identity and/or sexual identity. The violence can be physical, sexual, emotional, psychological,
verbal, economic or cultural. GBV often occurs as a result of the normative role expectations
associated with each gender, along with the unequal power relationships and socio-economic
imbalances between genders. Examples of GBV include domestic violence, femicide, sexual
violence, sexual harassment, ‘corrective rape’ and homophobic attacks, amongst others.

Hegemonic masculinity, in the context of this report, is defined as practices that legitimise men’s
dominant position in society and justifies the subordination of women as well as more nuanced or
marginalised ways of being a man.

Sexual harassment primarily consists of being on the receiving end of unwanted sexual comments,
suggestive sexual advances, honking, cat-calling, indecent public exposure, following, groping,
touching as well as public masturbation and flashing. It can be by known people or by strangers
– in private spaces or in public areas such as streets, shopping malls and public transportation.
Harassment can also include persistent requests for someone’s name, contact details, destination
and other personal information after this has already been denied. In this report, sexual harassment
includes actions and comments that have a sexual connotation (also see ‘cat-calling’).

Violence against women: Violence against women encompasses, but is not limited to, physical,
sexual and psychological violence including rape, sexual abuse, sexual harassment and intimidation
at work, in educational institutions and elsewhere. It also includes trafficking and forced prostitution,
amongst others.

4
EXECUTIVE
SUMMARY

            5
1. EXECUTIVE SUMMARY
Several international agreements stress the need for inclusive and sustainable development in
urban areas. These include the United Nations’ (UN) Sustainable Development Goals and the 2030
Agenda,1 the 2016 New Urban Agenda agreed at HABITAT III,2 the 2015 Paris Climate Agreement3
and the Convention on the Elimination of all forms of Discrimination Against Women (CEDAW).4
These instruments include gender equality as a criterion for success, towards the fulfillment of
their mandates.

Agencies such as the UN Women are making encouraging progress to create safer cities and safer
public spaces5 with the aim of eliminating violence against women and girls,6 and ensuring that
women can travel freely and safely, is seen as a significant part of these efforts. Making transport
in cities and rural areas safer for women and girls also benefits other vulnerable groups which, in
turn, contributes to making society more inclusive and equitable.

While access to transport is critical for growth and poverty reduction in South Africa, transport
is often seen as gender neutral and transport policies tend to not address gender differences.
Although women and men are reported to have different expectations, needs and constraints
regarding transport, gender is not considered in transport planning and projects, resulting in
policies, strategies and implementation plans not addressing unique gender influenced needs for
safe public transport.

Furthermore, conventional transport planning that only relies on aggregate data and cost benefit
analysis, does not often adequately address the needs of vulnerable groups generally and fails to
integrate issues around gender specific safety and access into infrastructure development.

The lack of gender responsive planning in the development of urban transport and cities has a
major impact on the mobility, frequency of utilisation, safety and personal security of commuters,
especially women, adolescents and children.

In May and June 2019, Sonke Gender Justice conducted a research study on women and girls
experiences of gender-based violence on public transport in Gauteng and Western Cape Provinces.
The study was undertaken as a response to the large number of personal experiences shared by
commuters of public transport, particularly mini-bus taxis, selected buses and metro rail trains,
in the Western Cape and Gauteng in South Africa. The findings of the research, presented in this
report, provide a gendered perspective on the impact of the lack of safety on public transport
in cities, by highlighting women’s and girls’ lived experiences of gender-based violence and
harassment when using public transport.

The key recommendations include that, in order to ensure sustainable and equitable development,
gender should be mainstreamed into the design and implementation of transport systems that
are responsive to the practical needs of women, households, children and communities. This is
vital to empower girls and women, particularly those from poorer households, because unsafe
transport negatively affects their access to socio-economic and education opportunities. Further
recommendations include that gender is mainstreamed into research on transport policy and
implementation.7

1   United Nations Statistical Commission, 2016.
2   United Nations General Assembly, 2016.
3   United Nations, 2015.
4   Convention on the Elimination of All Forms of Discrimination against Women. Adopted and opened for signature, ratification and
    accession by General Assembly, resolution 34/180 of 18 December 1979.
5   United Nations Women, 2017.
6   United Nations Women, 2018.
7   Mashiri, Buiten, Mahapa & Zukulu, 2005.

6
The information and key findings of this research study can be used to engage in advocacy, to
contribute toward policy changes and to sensitise commuters and communities on the issue of
gender-based violence in public transport.

                                                                                           7
INTRODUCTION

8
2. INTRODUCTION
South Africa is a signatory to regional and international conventions that address gender issues,
especially for women.8 Although the country has one of the most progressive legislative frame-
works to address discrimination against women and girls,9 the levels of violence against women
and girls are escalating and gender-based violence (GBV)10 continues to be a national concern.11

For many South Africans, public transport is an essential part of everyday life. In 2013, three out
of four (76.7%) households relies on public transport;12 half of the population (51%) used mini-
bus taxis; while 18% used buses and 7.6% used trains. Nearly 40% of working people used public
transport to get to work, while 3.7 million pupils used public transport to commute to primary and
secondary schools. The majority of these public transport commuters are from low income earning
households. In addition to taxis, walking is one of the preferred modes of public transport for half
(50%) of the South African population who earn under R3,000 a month and are unable to afford
private and other forms of more costly public transport.

Transport systems have tended to function in ways that prioritise men’s needs over those of women,13
which has led to public transport being described as ‘an institution through which hegemonic
masculinity is maintained’,14 where women are at greater risk of violence, sexual harassment and
sexual assault. Violence in public places, particularly on public transport systems, reduces the
freedom of movement for women and girls, as well as of gender non-conforming persons and
individuals of other vulnerable populations like the elderly and persons with disabilities. It therefore
places vulnerable groups at risk, which in turn impacts their mobility, safety and overall health and
wellbeing.

Women and children have constitutional rights to protect them against violence, to ensure their
safety and freedom of movement, crime and violence perpetrated against women and girls in
public spaces, while using public transport. Therefore, lack of safety in public transport, infringes
on all commuters’ constitutional rights.

Evidence has shown that all forms of violence and harassment (particularly verbal and sexual)
affect girls and women deeply, reducing their confidence and increasing their anxiety and feelings
of lack of safety, as well as their willingness to travel and to move freely in public spaces. This
affects their social and economic decisions and responsibilities, and access to opportunities.

This report presents the findings of a study conducted in Gauteng and the Western Cape amongst
women and girls who use public transport, particularly mini-bus taxis, buses and Metrorail trains. It
documents women and girls’ lived experiences of GBV, sexual harassment and crime perpetrated
against them, as commuters of public transport. The report also presents safe public transport
practices in other countries for adaptation in South Africa and highlights recommendations and
proposed interventions to address GBV on public transport, particularly in the Western Cape and
Gauteng – and applicable to other areas in South Africa.

8    The Convention on the Elimination of all forms of Discrimination against Women (CEDAW); the Declaration on the Elimination of Vio-
     lence against Women, the Discrimination (Employment and Occupation) Convention; the Equal Remuneration Convention; the Protocol
     to the African Charter on Human and People’s Rights on the Rights of Women in Africa (generally referred to as Maputo Protocol);
     the Solemn Declaration on Gender Equality in Africa; the Southern African Development Community (SADC) Protocol on Gender and
     Development.
9    These include the South African Constitution, the Promotion of Equality and Prevention of Unfair Discrimination Act (PEPUDA) 4 of
     2000.
10   Centre for the Study of Violence and Reconciliation, 2016.
11   Government of SA, 2019.
12   Statistics South Africa, 2013.
13   European Institute of Gender Equality, 2019.
14   Jennings, 2015.

                                                                                                                                    9
2013
households half of the
76.7% relies on public 51% population used
transport mini-bus taxis
used working people used
18% buses 40% public transport to
get to work
used 3.7 million pupils
7.6% trains used public transport to
commute to primary and
secondary schools
102.1 BACKGROUND
Article 13 of the United Nations 1948 Universal Declaration of Human Rights15 affirms the right to
freedom of movement and residence within the borders of each state. This includes the rights of
individuals to travel from place to place within a city or a country, and to leave the country and
return to it. This right is also stated in Article 12 of the African Charter on Human and People’s
Rights16 and asserted in Article 21, under the Bill of Rights of the Constitution of South Africa.17
Ensuring gender equality in travel – and women’s specific travel needs18 – is crucial to achieving
poverty reduction and social development goals.
Approximately 55% of the world’s population currently lives in cities. With people increasingly
moving to urban areas, which they regard as centers of opportunity, the UN projects that by 2050,
68% of the world population will live in urban areas.19 Population growth and migration into cities
often poses challenges, especially for decision makers responsible for the provision of services
that are suitable, affordable and attractive. As public transport is an essential public service that
serves millions of people daily, it plays a pivotal role in the economic and social life of women and
men in cities, as well as rural areas.
2.1.1 Poverty, women and girls
In the past 25 years, since 1994, the number of women in South Africa has increased by 5% a year;
statistics also show that slightly more women than men now live in urban areas around the world.20
However, a significantly high number of women and girls still live in rural areas and are affected by
extreme poverty. According to the Poverty Trends Report for 2006 to 2015, 30.4 million people
(55.5% of the population in South Africa) were living in poverty, an increase from the 52.2% (or 27.3
million people) reported in 2011.
In general, the main victims of the ongoing struggle against poverty are children (aged 17 years
and younger), black Africans, females and people from rural areas, including those with little or
no education. While it is highest amongst children (aged 0-17), levels of poverty tend to drop as
people get older and only start to increase again from the age of 55 onwards. Women and children
(particularly girls) are therefore especially vulnerable to poverty21 and make up most of the world’s
extreme poor.22
While there may be a decrease in poverty as people get older, as girls get older the gender in-
equality gap often becomes wider. This coincides with peak reproductive and productive ages
and, as women and girls become wives and mothers, they often stop working to take care of their
households, their husbands, children and families. In addition, women tend to take up more than
one part-time employment opportunity to provide for themselves, their children and extended
families. These responsibilities can result in their frequent use of public transport as they resource
their households and undertake paid and care-orientated work.
Globally, women are more likely to be educated than in the past. While those with an education
are more likely to be employed, many women continue to be under- or unemployed. Only 52% of
women participate in the formal workforce compared to 78% of men;23 that being said, the aver-
age hours per week spent on paid work is often higher for women.
15 United Nations, 1949.
16 African Union, 2016
17 Government of South Africa, 1996
18 Wachs, n.d.
19 United Nations, 2018.
20 United Nations, 2010.
21 Roy, 2011.
22 Newhouse, Becerra & Evans, 2016.
23 International Labour Organization, 2018.
11The frequency of women’s use of public transport is directly linked to their employment status and income, the location of their places of work or education, and the relative distance from where they live. Given their multiple roles, women thus tend to spend more time commuting and make more trips – to get to their places of work or education, to access opportunities and essential ser- vices such as healthcare, and to meet the needs of their additional care work. People in developing countries, particularly in South Africa, are often significantly impacted by the effects of historical spatial planning and poverty. The majority who are employed in minimum wage paying jobs cannot afford to live close to their places of work, which means they spend con- siderable time commuting in public transport, particularly in trains, mini-bus taxis and buses. This includes women from poor households, along with the men from similar and varied backgrounds. In other instances, poverty and lack of access to adequate financial resources can limit women’s uptake of public transport, thus impacting the transport systems and how women and girls are able to utilise it. Access to affordable24 public transport is a vital aspect of assisting people out of poverty. The International Monetary Fund (IMF) states that closing these gaps benefits countries at large, and not just women and girls25. For instance while bringing more women into the labour market can boost the local and regional gross domestic products (GDPs) of countries, one of the many barriers constraining them from economic participation is access to safe and reliable public trans- port which facilitates their access to the public world of income generation, education, social in- teraction and household provisioning. The lack of safety, security and limited access to transport reduces the probability of women actively participating in the labour market and education sec- tors by 16.5%,26 with serious consequences for the overall economy. 2.1.2 Safety and security Women represent the largest share of public transport users around the world, yet they face many barriers that limit their mobility.27 Most women do not have alternatives and depend on public transport. While women and men are said to have different expectations, needs and constraints regarding access to, and usage of, public transport, transport infrastructures and policies appear to be gender-blind, and gender is not considered in transport planning and projects. This results in transport systems that do not meet the unique gender influenced demands, which often leads to transport being unsafe. Safe and secure public transport is essential for women and children’s livelihoods, education and wellbeing. Many public transport modes tend to be structured around times and routes associated with peak period commuting patterns, providing a poor match with women’s more diverse schedules, and their rural-to-suburb and inter-suburb travel patterns. This results in women having to utilise more than one public transport mode in their routine trips to get to their destinations, which will often include walking and, sometimes, cycling in order to access the transport facilities. Sexual violence is a global pandemic that needs immediate redress. Sexual harassment and other forms of violence and abuse perpetrated against girls and women using public transport (as well as individuals of other vulnerable populations including those who are gender non-conforming) leads to restrictions that impact their mobility and affect their daily movements in the public environment. In this way, a lack of safety on public transport can influence women’s willingness to take public transport to work or school, thus affecting their access to income generating activities and the labour market and to educational opportunities. 24 Herbel & Gaines, 2009. 25 Elborgh-Woytek et al, 2013. 26 International Labour Organisation (ILO), 2017. 27 Alam & Karvajal, 2018. 12
When women lose access to public spaces – due to fear of sexual violence, gender-based violence
and other crimes that may be perpetrated against them – they lose not only their civic rights but
also access to vital economic opportunities. These will continue to have a direct impact on the
economy, if these systems remain unchanged. That being said, many people who see or experi-
ence harassment and/or theft fail to report their experiences to authorities, making it difficult for
city officials and public transport operators to assess the effects of this on commuters – especially
girls and women – or to put measures in place to address this lack of safety.28

It is critical to address issues of safety and personal security to ensure that girls and women have
equal access to education, work and health services, and their constitutional rights to mobility,
freedom of movement, safety and protection against violence are realised.

2.1.3 Evidence and research
The transport needs of women arising from their multiple roles that influence their travelling pat-
terns and frequency of use of public transport modes and systems are not adequately addressed
in research and relative transport-orientated implementation initiatives. To date, research on gen-
der and transport in developing countries has mostly focused on rural areas, resulting in a paucity
of information relating to urban and peri-urban women’s transport needs, as well as on the effects
of transport on the socio-economic and physical welfare of women and their communities.

Although some systematic gender inclusion research and procedures exist, which are aimed at
promoting gender sensitivity and responsiveness in transport sector policies in developing coun-
tries, the institutional frameworks as well as official and political will to operationalise these, is
often weak.

A tendency to equate ‘gender’ with ‘women’ has also led to insufficient attention being paid to the
relationship between women and men as important determinants of mobility outcomes.29

2.1.4 What can be done
There is a crucial need for transport gender analysis frameworks30 and methodologies, predicat-
ed on a rights-based approach that promotes safe and efficient travel conditions for women who
have formal employment as well as those who are involved in household/subsistence activities. In
addition, the inclusion of a gender analysis needs to move from the activities of policy activists
to mainstream professional practice and be incorporated into public transport planning systems,
infrastructure, technology and design on a holistic and comprehensive level.

The report makes a number of recommendations and proposes interventions to address gen-
der-based violence, sexual harassment and crimes against women using public transport, that
could be implemented and would contribute to the realisation of holistic, commuter-centered and
gender equality in public transport. These include the following:

    • Transport systems need to be redesigned and improved to be more responsive to the
      practical needs of children, girls, women and other vulnerable groups.

    • Public spaces, particularly within and around public transport terrains, need to be more
      safer, secure and address the gendered perspective of commuters to contribute to
      improved access and attaining overall gender equality.

    • Gender needs to be mainstreamed into transport research and implementation processes.

28 FIA Foundation, 2017.
29 Roberts & Babinard, 2004.
30 Venter & Mashiri, 2007.

                                                                                                   13
14
2.2 THE PROVISION OF PUBLIC TRANSPORT IN SOUTH AFRICA
South African statistics indicate that the majority of the population relies on public transport31 to
commute – and that an estimated 68% of South African households use mini-bus taxi services dai-
ly, followed by 21.1% who use commuter bus services and 9.9% who use commuter rail operations.
Furthermore, the data from the 2013 National Household Travel Survey (NHTS) revealed that only
30% of households in South Africa own a car, with the other 70% depending on taxis, buses, trains
and other non-motorised transport modes, such as cycling and walking.32
2.2.1 Trains
Metrorail is an operator of commuter rail services in four provinces – the Eastern Cape, Gauteng,
KwaZulu-Natal and the Western Cape – where it operates in the majority of urban areas. It is
a division of Passenger Rail Agency of South Africa (PRASA), a wholly state-owned enterprise
responsible for most of the passenger rail services in the country – and receives a subsidy from
government. There are 500 stations nationally, that cover approximately 3,100 kilometres of which
Metrorail operates 468 stations (317 owned by PRASA and 151 by Transnet).
While Metrorail had previously transported up to two million people a day (accounting for ap-
proximately 15% of public transport commuters in the country), as at 2018, just below one million
commuter trips were taken on Metrorail daily33. This could reflect the findings from the NHTS
(2014)34 that revealed that trains are often overcrowded, are not punctual, that commuters often
live a distance from the stations, and that trains are not safe to travel on.35 Their findings also re-
vealed that some trains do not arrive at all, with 37.8% of train users claiming that the service they
expected was not available.36
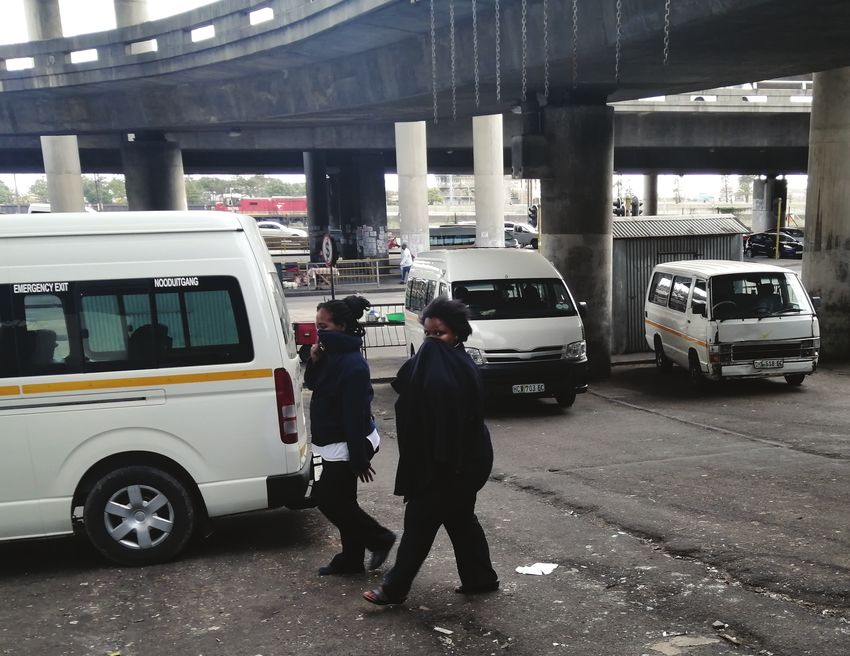
2.2.2 Mini-bus taxis
Mini-bus taxis are predominantly low capacity (16 seater) vehicles that offer unscheduled services
on fixed routes – routes managed, and contested, by taxi associations. While they typically depart
from fixed terminals, they stop anywhere along their route to pick up and drop off passengers.
Passengers hail taxis by using hand signals to indicate where they are traveling to.
Mini-bus taxis are the dominant public transport mode as they are perceived to be more accessible
than trains and buses as well as more flexible, given that they provide numerous route options and
stops. They transport approximately 15.4 million commuters each day,37 (68% of all commuters),
the majority of whom are women and girls.38 SA Taxi noted in 2018 that there were 250,000 mini-
bus taxis and 2,600 taxi ranks – and that almost 19 billion kilometres are travelled on taxis each
year.39
The taxi industry employs about 160,000 operators, 560,000 drivers, 680,000 rank managers,
queue marshals and other administrative support staff40, most of whom are males including as-
pects of its leadership and governance. This highly male dominated system has an adverse effect
on gender relations and impacts on women’s perceptions of this transport sector and its services.
31 Statistics South Africa, 2014.
32 Mtizi, 2018.
33 SA Taxi, 2018
34 National Household Travel Survey, 2014.
35 Statistics SA, 2014.
36 Ngubane, n.d.
37 SA Taxi, 2018.
38 Statistics South Africa, 2013b.
39 SA Taxi, 2018.
40 Safer Spaces, 2019.
15According to the 2012 annual report of the South African Institute of Race Relations, the death rate on mini-bus taxi incidents was 27 deaths per 10,000 vehicles, three times higher than nine deaths per 10,000 for motor vehicles.41 Furthermore, road safety is a major concern in South Africa with 59% of all drivers killed in road related accidents reported to have been under the influence of al- cohol42 and exceeding the speed limit. 2.2.3 Buses Buses are larger than taxis (taking about 75 passengers), travel on scheduled routes and stops and operate within specific areas. As at 2018, there were 19,000 registered buses, 100 bus stations and almost one million kilometers travelled per year. Nationally, the bus industry transports approxi- mately one million commuter trips daily.43 Buses are considered to be cost efficient and are regarded as slightly safer than mini-bus taxis. Buses are subsidised by the government, whereas the mini-bus sector is not subsidised and is meant to be commercially self-sustaining. 41 South African Institute of Race Relations, 2012. 42 Oxford, 2013. 43 SA Taxi, 2018 16
METHODOLOGY

              17
3. METHODOLOGY
In May and June of 2019, Sonke conducted a research study on public transport and gender-based
violence in Western Cape and Gauteng. This was undertaken as a response to the many personal
experiences shared on various public platforms by commuters of public transport, particularly
those who utilise mini-bus taxis, selected buses and Metrorail commuter trains, in the Western
Cape and Gauteng in South Africa. The research provides a gendered perspective on the impact of
the lack of safety on public transport in the Western Cape and Gauteng, by highlighting women’s
and girls’ lived experiences of gender-based violence, sexual harassment and crimes perpetrated
against them when using public transport.
3.1 AIMS AND OBJECTIVES
• Collect and document commuter experiences of women and girls regarding safety and
gender-based violence on public transport, particularly in trains, buses and mini-bus taxis.
• Understand what women and girls commuters are experiencing – through hearing their
own words – and how their mobility and rights are impacted by gender-based violence and
a lack of safety.
• Make recommendations to policy and decision makers and key stakeholders to prioritise
safety for women and girls in public transport.
3.2 RESEARCH STUDY METHODS AND DATA COLLECTION INSTRUMENTS
The research utilised qualitative and quantitative methods; data were collected largely through a
questionnaire (survey) and focus group discussions (FGDs).
3.2.1 Target audience
Women and girls were the target audience for the study. Female-presenting respondents within
the public transport domain were randomly selected to complete the surveys.
In both cities, the field workers who administered the surveys were women and girls aged between
19 to 42 years. Fifteen were selected in each province through the Sonke community action teams,
using a set of selection criteria.
The focus group discussion participants were also selected through the Sonke community action
team, though using different eligibility criterion. They were women and girls aged between 20 to
57 years.
3.2.2 The surveys
The survey consisted of 15 questions, divided into three sections of five questions each. Some
used a three-point Likert scale (true/false/not sure) to record their responses, while others were
open-ended, requiring descriptive detailed responses.
18Thirty trained female field workers conducted the data collection process by administrating the
questionnaires, accompanied by information sheets with consent statements to interviewees. The
administration of the surveys took place at the main public transport hub sites in the central busi-
ness districts of Cape Town (Western Cape) and Johannesburg (Gauteng).
Western Cape 596
Gauteng 425
0 200 400 600 800
Figure 1: Total number of survey respondents in Gauteng and the Western Cape
The final number of surveys in the dataset was 1,021, of which 596 were from the Western Cape
and 425 from Gauteng, as illustrated in Figure 1.
There was only one instance in which a respondent – in Gauteng – had already completed a ques-
tionnaire within two to three days of the period the survey was being administered, and was
therefore excluded. A further 92 questionnaires were also excluded as they were either poorly
completed or incomplete, and thus regarded as spoilt.
The 1,021 who completed the survey will be referred to as ‘respondents’ (while those in the focus
group discussions will be ‘participants’).
3.2.3 Focus group discussions
Two focus group discussions were conducted by the researcher in each province with a view to
getting in-depth responses to supplement the survey responses. They comprised of approximate-
ly 20 women in each, and an estimated total of 40 girls and women were reached. They will be
referred to as ‘FGD participants’.
The focus group discussions were held in areas that were considered to be highly active and had
busy public transport intersections. In the Western Cape, they were conducted in Gugulethu (a
peri-urban area located in the peripheral areas), which has access to taxi rank, Metrorail trains and
buses.
In Gauteng they were held in Tembisa (a peri-urban area located in the peripheral areas of Gauteng)
and Braamfontein (located in the urban and central city centre of Johannesburg), which houses
the Noord taxi rank, Bree taxi rank, intracity transport stations, and platforms where metro rail
trains, buses and mini-bus taxis are accessed, within close proximity of one another.
3.2.4 Collation of data
The survey responses were entered on a database and a simple thematic sorting undertaken, to
produce the evidence presented in this report and from which findings are made.
193.3 PROJECT PHASES 3.3.1 Phase 1: Project Inception An inception meeting was facilitated at the beginning of the research project in January 2019, comprising the team members who would assist with conducting the research, such as assisting with the mobilisation, training and capacity building of field workers. Internal experts in research and in monitoring and evaluation gave perspectives to ensure that data collection instruments were aligned with project aim and objectives. Desk-top research on international best practices on participatory research tools, and subsequent adaptation in the South African context, was conducted in February 2019. Thereafter, the partic- ipatory research proposal and methodological guidelines were developed. Research data collec- tion instruments for quantitative and qualitative research were developed, including training and capacity building materials for the field workers. 3.3.2 Phase 2: Participatory research tools testing In February 2019 a focus group discussion of ten women, between the ages of 18 and 55 years, was held to test the participatory research tools for the qualitative and quantitative methods (ques- tionnaires and questions for the focus group discussions) as well as the training materials for the field workers. The tools were finalised in March 2019 and the process of formalising them following the focus group, and internal evaluation of the research instruments by Sonke’s research, monitor- ing and evaluation unit, was concluded in April 2019. 3.3.3 Phase 3: Field worker training and data collection process Field workers were procured and trained in May and June 2019, and the qualitative and quantitative data collection was conducted in the two provinces. 3.3.4 Phase 4: Data entry and analysis processes The development of applicable reporting mechanisms and databases, and the entry of data, was initiated in July 2019. This was followed in September 2019 by a process of analysis and interpretation of research findings. 3.3.5 Phase 5: Inter-project consultations A project consultative meeting was facilitated in October 2019 – comprising key public transport stakeholders, representatives of civil society organisations and key community-based organisations and forum representatives – to address the findings of the study and provide inputs on the presentation of the study findings. This included general commuters and representatives of the bus, mini-bus taxi and train sectors. A project close-out and reflection meeting was hosted in November 2019 comprising the key internal experts in various areas of research development such as monitoring and evaluation, community education and mobilisation, strategic communication and information and policy development and advocacy. This marked the finalisation of the consultations regarding project findings. 20
3.3.6 Phase 6: Post-research interventions
A post-research meeting will be hosted with key stakeholders to present and discuss the findings,
address the recommendations and devise a way forward. This would include identifying approaches
to operationalising the recommendations and needed interventions, to realise the safety of women
and girls (including children) when using public transport and highlighting the impact gender-
based violence, sexual harassment and crimes against women have on their mobility, safety, rights
and overall health and wellbeing.

The meeting will comprise of field workers who were involved in the data collection and women
and girls involved in the focus group discussions. In addition key policy makers, decision makers
and public transport key stakeholders will be present to discuss the findings and address the
recommendations, to devise a way forward.

                                                                                              21
DEMOGRAPHICS
AND PROFILE
OF SURVEY
RESPONDENTS
224. DEMOGRAPHICS AND PROFILE OF
SURVEY RESPONDENTS
The demographic information collected about the survey respondents were their age and gender;
the number of children in the household and if these children use public transport; their occupa-
tion and the suburb/area in which they lived. They were also asked if they were users of public
transport in order to verify that the purpose of their being at transport hubs was to use public
transport.
4.1 PROFILE OF SURVEY RESPONDENTS
4.1.1 Gender
While all respondents presented as women and girls, they were asked to identify their gender
through means of indicating whether they are ‘female’ or ‘prefer not to say’. Of the total number
of respondents, 13% (77 respondents) in the Western Cape and 3% (12 respondents) in Gauteng
preferred not to disclose their gender.
97%
Gauteng 596
3% Female
Prefer not to say
87%
Western Cape
13%
0 20% 40% 60% 80% 100% 120%
Figure 2: Gender of survey respondents in Gauteng and the Western Cape
4.1.2 Age
Four categories to describe the ages of the respondents were developed: ‘adolescents’ (10 – 19
years old), ‘young women’ (20 – 35), ‘women’ (36 – 55) and ‘elderly women’ (55+)
Table 1: Ages of survey respondents: by province
Age range
Category Western Cape Gauteng TOTAL
(in years)
10 – 19 Adolescents 28 5% 160 38% 188 18%
20 – 35 Young women 389 65% 177 42% 566 55%
36 – 55 Women 142 24% 41 10% 183 18%
55+ Elderly women 24 4% 6 2% 30 3%
Prefer not to 13 2% 41 8% 54 5%
say
TOTAL 596 100% 425 100% 1,021 100%
23• The largest proportion of the respondents – just over half (55%) – were ‘young women’,
though there were more in the Western Cape than in Gauteng (65% and 42% respectively).
• ‘Adolescents’ and ‘women’ were equally represented in the total sample at 18% each –
although there were far more adolescents among the Gauteng respondents (38%) than the
Western Cape (5%). (This is discussed below.) ‘Women’ were more highly represented in
the sample in the Western Cape (28%) than in Gauteng (2.4%).
• The proportions of ‘elderly women’ were small: 4% in the Western Cape and 2% in Gauteng.
• There were no respondents aged 0 to 9 years involved in the study.
10—19: Adolescents 38%
5%
20—35: Young women 42%
65% Gauteng
36—55: Women 10% Western Cape
24%
55+: Elderly women 2%
4%
Prefer not to say 8%
2%
0 10% 20% 30% 40% 50% 60% 70%
Figure 3: Age disaggregated data of survey respondents:
Gauteng and the Western Cape
These differences in the number of adolescents are thought to be attributable to the months in
which the surveys were conducted. The survey in Gauteng was conducted in May 2019 during
the school term, while the Western Cape surveys were conducted in June 2019 when adolescents
are on school holiday. Both of the surveys were conducted during daylight off-peak hours, which
accounts for the larger sample of adolescents in Gauteng who, presumably, were surveyed when
they had left school and were at the public transport hubs to commute home (or to other desti-
nations). As the Western Cape survey was conducted during school holidays, young people were
unlikely to be travelling en masse regularly on public transport, at the times and sites where the
study was being conducted.
Among the ‘young women’, ‘women’ and ‘elderly’ age groups, a small percentage was observed
to include women who were accompanying children (below five years old); there were also elderly
people and people with disabilities who were commuting alone.
The average age in the Western Cape was 32 years old, with the youngest respondent being aged
16 years and the oldest, 90 years. In Gauteng the average age was 21 with the youngest respondent
being aged 10 years and the oldest, 64 years. These ranges indicate the population dynamics and
give an indication of the users of public transport in both provinces.
4.1.3 Children
There were also marked differences between the two provinces regarding women who had chil-
dren – partly to be expected given the preponderance of adolescents in the Gauteng sample. Of
the 596 respondents in the Western Cape, 69% indicated that they had children compared with
16% in Gauteng. Of all of these, a combined total of 48% reflected that their children use public
transport.
This resonates with the findings of the National Household Travel Survey (NHTS),44 which states
that approximately 3.7 million pupils use public transport to commute to institutions of primary
and secondary learning.45
44 National Household Travel Survey, 2014.
45 Statistics South Africa, 2014.
244.1.4 Occupation
Figure 4 below shows that 53% of the respondents in the Western Cape were employed, while only
23% of those in Gauteng were working. This is balanced by a very high proportion of the Gauteng
respondents being students – 59% – compared with 16% in the Western Cape, reflecting the pre-
ponderence of adolescents in Gauteng, reported above. (This is interesting, given that the survey
was administered in off-peak times when working and school-going children might typically be
travelling.)
Given the age profiles of the respondents presented above, it is not surprising that about three
quarters of the respondents are using public transport either to get to school (about 37%) or work
(also about 37%).
23%
Employed
53%
9%
Self-employed
13% Gauteng
Western Cape
59%
Students
16%
9%
Unemployed
18%
0% 10% 20% 30% 40% 50% 60% 70%
Figure 4: Occupations of respondents in Gauteng and the Western Cape
13% and 9% indicated they were self-employed and/or work for themselves in the Western Cape
and Gauteng respectively, while 18% and 9% reported that they were unemployed. Interestingly the
unemployment rate of respondents – averaged at 13,5% across both provinces – is lower than the
national rate of 29,5% (using the official definition of unemployment) as reported in the second
quarter of 2018 by the Quarterly Labour Force Survey.46 The same Labour Force Survey added that
the rate of unemployment amongst women was 7.5 percentage points higher than that of males.
That men are slightly more likely to be in paid employment than women limits women’s relative
ability to afford access to quality public transport – or to access other public transport modes at
an additional cost – thus putting out of their reach, transport that may have greater security and
safety measures in place.
Furthermore, about a third (32.3%) of the approximately 10.3 million persons aged 15 to 24 years in
the third quarter of 2019, were not in employment, education, or training (NEET). If this age range
is expanded by ten years to include people up to 34 years old, 40% of these 20.4 million people
aged 15-34 years, were classified as NEET.
As the unemployment rates among respondents are much lower than those reported in the
literature, a provisional, though untested assumption is that unemployment limits access to public
transport, given the costs.
These occupations underscore the importance of safety on public transport, as most women
cannot afford alternative modes of transport, and their use of public transport is directly linked
to their access to education institutions and to the labour market. Experiences of gender-based
violence, sexual harassment and other crimes perpetrated against women and girls influences their
willingness to take public transport to work, school and other extra-mural events and activities.
46 Statistics South Africa, 2019.
25You can also read