SMART Transportation Ranking Report - GreenApple Canada 2008 - UBC Sauder School of ...
←
→
Page content transcription
If your browser does not render page correctly, please read the page content below
GreenApple Canada 2008   |   SMART Transportation Ranking Report   i

                  GreenApple Canada 2008
SMART Transportation
     Ranking Report
November 13, 2008
GreenApple Canada 2008
SMART Transportation Ranking Report
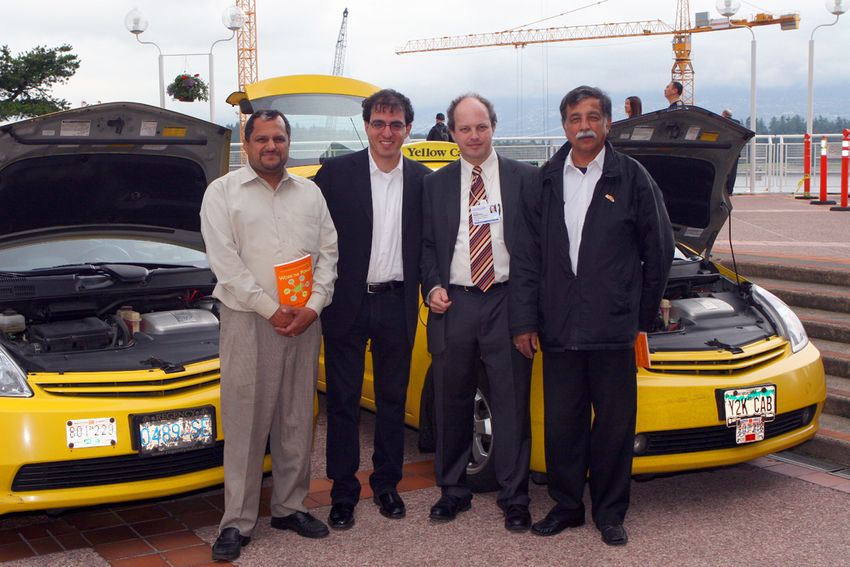
Barry Appleton Displays the GreenApple Prize
Awarded for Sustainable Transporation Practices
AUTHORS
Appleton Charitable Foundation 2007 Inaugural Expert Panel
Barry Appleton, National Director Prof. Peter Nemetz (Chair) Prof. Tsur Somerville
Mona Davies, Projects Director Sauder School of Business, Sauder School of Business,
University of British Columbia University of British Columbia
Sauder School of Business,
University of British Columbia Prof. Jonathan Berkowitz Prof. Douw Steyn
Sauder School of Business, Earth and Ocean Sciences,
Prof. James Tansey University of British Columbia University of British Columbia
Perry Atwal
Graeme Patrick Doré Prof. David Gillen Prof. James Tansey
Prof. Dan Muzyka Sauder School of Business, Sauder School of Business and
University of British Columbia W.M. Young Centre for Applied Ethics,
University of British Columbia
Prof. Cynthia Girling
School of Architecture and Prof. Anming Zhang
Landscape Architecture, Sauder School of Business,
University of British Columbia University of British Columbia
Prof. Ronald Kellett
School of Architecture and 2008 Research Assistants
Landscape Architecture,
University of British Columbia Graeme Patrick Doré
Usman Aslam
Prof. Jeff Kenworthy Abril Novoa Camino
Murdoch University, Perth Sumaya Khan
Svitlana Yurchenko
The GreenApple Canada 2008 Ranking Report is available at www.appletonfoundation.org
Copyright © 2008 Appleton Charitable Foundation
www.appletonfoundation.org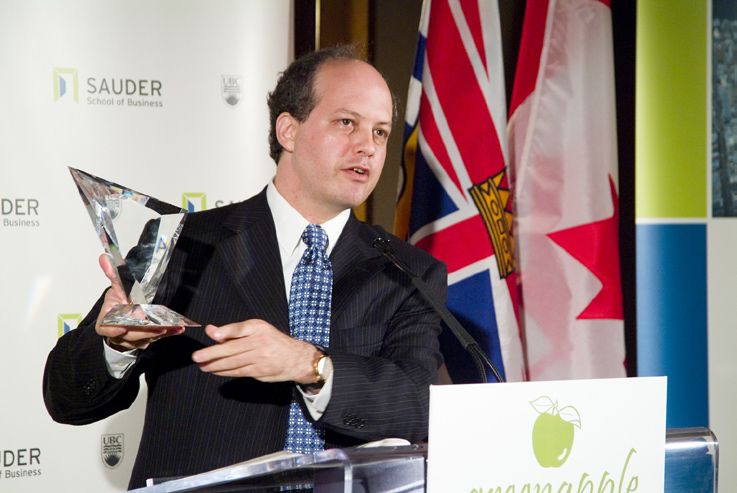
GreenApple Canada 2008          |   SMART Transportation Ranking Report                                                                 I

                                                                       Douw Steyn - University of British Columbia, Earth and Ocean
                                                                       Sciences
Acknowledgements                                                       Anming Zhang - University of British Columbia, Sauder School of
                                                                       Business
                                                                       James Brander - University of British Columbia, Sauder School of
The GreenApple Canada SMART Transportation Ranking Report
                                                                       Business
incorporates the results of extensive consultations and
                                                                       David Gillen - University of British Columbia, Sauder School of
cooperation with subject-area specialists, statisticians, indicator
                                                                       Business
experts, and policymakers across Canada. This Report arises
                                                                       Cynthia Girling - University of British Columbia, School of
from an initial collaboration between the Appleton Charitable
                                                                       Architecture and Landscape Architecture
Foundation and the New York City- based Jack D. Hidary
                                                                       Ronald Kellett - University of British Columbia, School of
Foundation’s SmartTransportation.org project.
                                                                       Architecture and Landscape Architecture
                                                                       Jeff Kenworthy - Murdoch University, Perth, Australia
External expert review has been graciously provided by the
Sauder School of Business at the University of British Columbia.
                                                                       The expert team was ably assisted in their deliberations by
The Sauder School expert team has been intimately involved in
                                                                       Graeme Patrick Doré, Sauder School of Business, UBC; and by
the original development of methodology and analytical review
                                                                       Usman Aslam, Masters Candidate, University of Saskatchewan.
for our inaugural 2007 Report and their participation has been
insightful and invaluable.
                                                                       Basing environmental decision making on rigorous and
                                                                       quantitative foundations depends on the collection and
GreenApple Canada wants to acknowledge the role played by the
                                                                       presentation of high quality information. We are indebted to our
Clinton Global Initiative in supporting the creation of this Project
                                                                       Expert Team and the data agencies who provided the fundamental
and the World Economic Forum’s Forum of Young Global Leaders
                                                                       groundwork for our work.
which supported the announcement of this Project at their
Annual Summit in June 2006.
                                                                       Data has primarily been drawn from government offices and has
                                                                       been supplemented with information from academic and research
The GreenApple Canada Report was funded by the Appleton
                                                                       institutions sources.
Charitable Foundation. It created a Report Secretariat based in
the Toronto offices of the Appleton Charitable Foundation. The
                                                                       Government of Canada and its Agencies
Toronto-based team was comprised of: Barry Appleton, Mona
Davies, Usman Aslam, Sumaya Khan, Abril Novoa Camino, Svitlana
                                                                       Environment Canada;
Yurchenko, Jordan Feurstein and Maria Gergin.
                                                                       National Air Pollution Surveillance Network
                                                                       Céline Audette and colleagues, Environmental Science and
Recognizing the inherent complexities at play in environmental
                                                                       Technology Centre, Environment Canada,
public policy, the GreenApple Canada SMART Transportation
Report has drawn on the wisdom and insights of a network of
                                                                       Statistics Canada;
experts including:
                                                                       Leah Howes, Statistics Canada;
                                                                       Michel Savard and colleagues, Statistics Canada, Transportation
Daniel Muzyka – Dean, RBC Financial Group Professor of
                                                                       Division;
Entrepreneurship, Sauder School of Business, UBC
                                                                       Derek Adams, Statistics Canada Advisory Services;
James Tansey - W. Maurice Young Chair in Business Ethics,
                                                                       Marc Lévesque and colleagues, Statistics Canada, Labour Statistics
Assistant Professor, Sauder School of Business, UBC
                                                                       Division;
Perry Atwal – Director, Strategic Projects, Sauder School of
Business, UBC
                                                                       Natural Resources Canada
                                                                       Canada Mortgage Housing Corporation (CMHC);
Our GreenApple 2007 Expert Panel was comprised of the following
members:
                                                                       Mike Ashman, Stephen Ellsworth and colleagues, Transport
                                                                       Canada;
Peter Nemetz – Professor, Strategy and Business Economics, at
the Sauder School of Business, UBC (Chair)
                                                                       National Organizations
Jonathan Berkowitz - University of British Columbia, Sauder
                                                                       Tammy Siu and colleagues, Canadian Urban Transportation
School of Business
                                                                       Association;
Tsur Somerville - University of British Columbia, Sauder School
                                                                       Frank Reidl and Sylvain Veilleux, Insurance Bureau of Canada;
of Business

                                                 www.appletonfoundation.org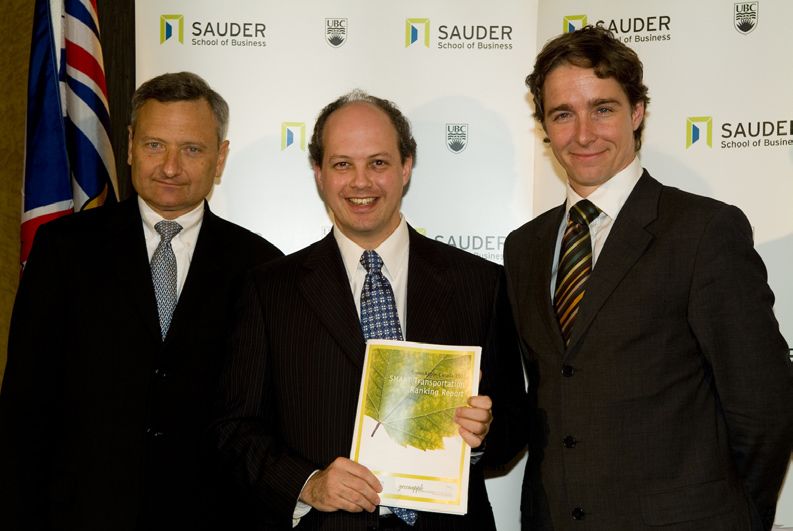
II                                                    GreenApple Canada 2008      |   SMART Transportation Ranking Report

Provincial Bodies                                                 Urban Area, Academic, First Nation and Community Based
Carolyn Burggraaf and colleagues, Newfoundland Ministry of        Sources
Government Services;                                              Melisa Lessard and colleagues, City of Ottawa;
Jeff Russell and colleagues, Government of New Brunswick          Bruce Robertson and colleagues, City of Toronto;
Department of Local                                               Graham Reid, District municipality of Peachland;
Government;                                                       John Ivany, City of Moncton;
Ross Fisher and Colleagues, Government of New Brunswick           Angela Chubala and colleagues, City of Winnipeg;
Department of Transportation;                                     Toronto Public Library;
Debby Power, Government of Newfoundland and Labrador, Motor       René Allaire, Ville de Sherbrooke;
Registration Division;                                            Gary Woloshyniuk; City of Edmonton
Wilma Piovesan and colleagues, Ontario Ministry of                Laine Ruus and colleagues, University of Toronto;
Transportation;                                                   Peggy Walter, Regional Municipality of Waterloo;
Phil Kiely and colleagues, Ontario Ministry of Environment;       Joseph MacNeil, Niagara Regional Police Service;
Daniel Robidoux and colleagues, Transports Québec;                Jean Martine and colleagues, Ville de Gatineau;
Diane Lemire, Société de l’assurance automobile du Québec;        Johane Ducharme, Ville de Brossard;
Bernadette Lasuik, Daryl Deluna and colleagues Manitoba Public    Ross Long and colleagues, Greater Vancouver Transportation
Insurance;                                                        Authority;
Tony Janeczko and colleagues, Saskatchewan Government             Catherine Bishop, City of Barrie;
Insurance;
Kathy Murphy and colleagues, Alberta Ministry of Infrastructure   Corporations and Consulting Bodies
and Transportation;                                               Kent Marketing Services, particular thanks to Richard Doyle and
Tracey Lee and Tazmin Surani, Insurance Corporation of British    colleagues;
Columbia;

                                      Prof. James Tansey fields media questions
                                      at the 2007 release of the GreenApple
                                      Canada Ranking Report

                                                www.appletonfoundation.org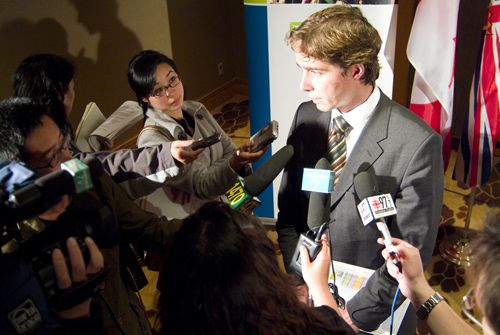
GreenApple Canada 2008          |   SMART Transportation Ranking Report                                                                III

Executive Summary
The past year has been a turbulent one for people who follow          close each CMA comes to meeting them. Our hope is that the
the fortunes of transportation systems. Rising energy prices have     GreenApple Canada 2008 Ranking Report is able to provide
made our dependence on energy-intensive forms of transportation       a broader context to enable the public and policy makers to
painfully apparent. As gasoline prices peaked at around $1.50         evaluate sustainable urban transportation policy performance.
per litre, consumers began to seriously reflect on how they move
                                                                      The real value of the GreenApple Canada 2008 Ranking Report is
around and reconsidered what vehicles they will buy next. The
                                                                      that it creates an ability to identify the leading municipalities
2008 federal election saw vigorous debate about a federal carbon
                                                                      which are best coping with the challenges of providing
tax. This was also a year in which the Government of British
                                                                      sustainable urban transportation. This second Report also
Columbia introduced a carbon tax on fossil fuels, adding roughly
                                                                      allowed us to carefully track the progress of urban areas over
2.5 cents to a litre of gas. Data gathered for this Report suggest
                                                                      the last year. While some changes appear simply because of the
that on average, emissions from transport increased by roughly
                                                                      appearance of more recent data, many of the changes reflect
2% in urban areas over the course of the year, following the
                                                                      policy innovation by policy makers.
trends of previous years.
                                                                      The 2008 GreenApple Canada Smart Transportation Ranking
The GreenApple SMART Transportation Ranking Report was
                                                                      Report top four ranked urban areas are Victoria, BC, Vancouver,
launched last year because we recognized that the accurate
                                                                      BC, Ottawa-Gatineau (Ontario – Quebec) and Montreal, Quebec —
measurement of the sustainability of transportation systems is
                                                                      all four of these urban regions have demonstrated a commitment
important if we are to make progress in improving Canada’s urban
                                                                      to directing significant public resources to address urban
areas. This second annual Report captures the latest data on
                                                                      transportation in an environmentally sustainable manner. While
the performance of these urban areas but also clearly indicates
                                                                      none of these cities was awarded an “A” grade, all four urban
where progress has been made. We believe that measurement
                                                                      areas have shown improved progress in most of the Report’s
systems, combined with realistic performance targets, will serve
                                                                      17 policy indicators, and are in a position to meet the 10 year
to encourage policy makers to enhance data monitoring and
                                                                      benchmark targets advanced by the GreenApple Expert Panel. This
incorporate measurable targets into their urban transportation
                                                                      year, Victoria moved up to a B+ grade, by means of its extended
policies.
                                                                      leadership in sustainable transportation. This is the highest
This second GreenApple Canada SMART Transportation Ranking            grade received by any Canadian city within the GreenApple
Report identifies areas of best practice and draws attention to       Canada 2008 Ranking Report.
some of the real success stories from urban areas over the last
                                                                      The GreenApple Canada 2008 Report identified the four lowest-
year. Feedback from the first Report was incorporated into the
                                                                      ranked Canadian cities: St. John’s, Newfoundland, Greater
2008 Report, although the overall Smart Transportation ranking
                                                                      Sudbury, Ontario, Moncton, New Brunswick and Barrie, Ontario.
system remains the same.
                                                                      All four of these urban areas received failing grades in this year’s
In developing the GreenApple Canada 2008 Ranking Report, we           GreenApple Canada ranking due to their limited commitment to
have used both measurement and expert panel recommendations.          sustainable urban transportation.
The GreenApple Canada 2007 Ranking Report assessed urban
                                                                      Within the lower rankings, only one Canadian region was able
transportation policies undertaken by Canada’s largest urban areas
                                                                      to improve its 2007 failing grade to a passing 2008 grade. The
against 17 indicators tracked in 4 policy categories:
                                                                      St. Catharines-Niagara region moved out of the ‘failing grade’
t "ir Quality                                                        category and earned a pass with a ‘D’ grade this year. Much of
                                                                      this score is attributable to the region's adoption of anti-idling
t 1VCMJD1PMJDZ                                                      bylaws throughout much of the region.
t 5SBOTQPSU1PMJDZ                                                   In spite of challenges created by data gaps and methodological
t 5FDIOPMPHZ"EPQUJPO                                                limitations contained in this or the inaugural Report, the
                                                                      GreenApple Canada 2008 Ranking Report demonstrates that
The 2008 GreenApple Canada Ranking Report assessed these              sustainable transportation policy results can be measured and
indicators based on Statistics Canada geographic boundaries           assessed. The Report also demonstrates that real progress can be
known as Census Metropolitan Areas (CMAs). It is important to         tracked on an annual basis and that overall, the sustainability of
note that these CMAs tend to extend beyond particular named           Canada’s urban areas is improving.
cities to include a number of adjacent towns and cities that
constitute urban settlements. (For example, the Toronto CMA
encompasses 24 different communities). When we refer to urban
regions or urban communities in the GreenApple Report, we are
referring to the specific CMA for that particular urban area.
The GreenApple Canada 2008 Ranking team developed a
methodology to assess sustainable urban transportation policy
goals for 27 of the largest urban areas in Canada. These CMAs
are home to around two-thirds of the population of Canada and
77% of the urban population. In developing this methodology,
we initially asked the expert panel to identify specific achievable
medium term targets for these cities and then we assessed how

                                                 www.appletonfoundation.org
IV                                                          GreenApple Canada 2008   |   SMART Transportation Ranking Report

The listing of the 17 sustainable transportation policy
indicators used in the GreenApple Canada 2007 Ranking Report
and the Table of Ranked Canadian City scores are set out below.

                                                                        GreenApple SMART Transportation Ranking
GreenApple SMART Transportation Policy                                  of the Census Metropolitan Areas
Indicators

     Indicator Data                                                       Rank   Census Metropolitan Area        Normalized
     Air Quality
                                                                                                                 Score
     CO2 emissions per capita (tonnes) from retail fuel sales             1      Victoria (B.C.)                 79.6
     (2007)
                                                                          2      Vancouver (B.C.)                76.4
     CO parts per million, median of maximum daily 1 hour
     averages (2006)                                                      3      Ottawa–Gatineau (Ont.–Qué.)     71.1
     O3 parts per billion, median of daily maximum 8 hour                 4      Montréal (Qué.)                 69.9
     averages (2006)                                                      5      Toronto (Ont.)                  68.2
     Registered vehicles per capita (2007)                                6      Winnipeg (Man.)                 67.4
     Public Policy                                                        7      Québec City (Qué.)              63.3
     Percentage of the population living under an anti-idling             8      Hamilton (Ont.)                 59.0
     bylaw (2008)
                                                                          9      Sherbrooke (Qué.)               57.1
     Percentage of housing starts that were apartment or row
     units (2007)                                                         10     Kelowna (B.C.)                  55.9

     Percentage discount on a local transit pass accorded
                                                                          11     Kingston (Ont.)                 54.9
     employees of the CMA’s largest city who purchase the pass            12     Saguenay (Qué.)                 53.8
     at work (2008)
                                                                          13     London (Ont.)                   53.6
     Percentage of the cost difference between the 2008 Honda             14     Abbotsford (B.C.)               53.2
     Civic gasoline and hybrid models covered by provincial tax
     incentives (2008)                                                    15     Kitchener-Waterloo (Ont.)       50.9

     Transportation Policy                                                16     Halifax (N.S.)                  50.7

     Percentage of the housing stock that is defined as either
                                                                          17     Regina (Sask.)                  49.5
     apartment or row units (2006)                                        18     Edmonton (Alta.)                47.8
     Annual public transit regular revenue service kilometres             19     Calgary (Alta.)                 47.5
     traveled per capita, excluding heavy rail and commuter
     coach (2006)                                                         20     Windsor (Ont.)                  47.3
     Percentage of the CMA labour force bicycling, walking or             21     Saskatoon (Sask.)               46.7
     taking public transit to work (2006)
                                                                          22     Oshawa (Ont.)                   46.7
     Percentage of total public transit kilometres that are free in       23     St. Catharines–Niagara (Ont.)   45.7
     the downtown core (2007)
                                                                          24     Barrie (Ont.)                   42.9
     Population-weighted annual adult transit pass cost (2008)            25     Greater Sudbury (Ont.)          42.0
     adjusted by the CMA’s 2006 median family income
                                                                          26     Moncton (N.B.)                  41.3
     Percentage of the labour force holding employer issued
                                                                          27     St. John's (N.L.)               39.5
     transit passes (2007)
     Technology Adoption
     Percentage of the public transit bus fleet using alternative
     fuels, excluding commuter coach (2008)
     Percentage of the taxi and limousine fleet that is powered
     by hybrid gasoline-electric means (2008)
     Percentage of the municipal road fleet that is powered by
     alternative fuels (December 2007)

                                                      www.appletonfoundation.org
GreenApple Canada 2008 | SMART Transportation Ranking Report V
GreenApple Canada 2008 SMART Transportation Ranking Report
Table of Contents
Summary .................................................................... 1 Saguenay ............................................................... 25
Climate Change ............................................................. 1 Saskatoon .............................................................. 26
Canada’s Cities .............................................................. 1
Sherbrooke ............................................................. 27
Finding the data ............................................................ 2
Building a Ranking ........................................................ 3 St. Catharines-Niagara ............................................. 28
The Results ................................................................... 3 St. John's............................................................... 29
Greater Sudbury ...................................................... 30
GreenApple Canada 2008 SMART Toronto.................................................................. 31
Transportation Ranking Report Vancouver .............................................................. 32
Tables & Maps............................................................ 5 Victoria ................................................................. 33
Table 1: Census Metropolitan Areas (CMAs) included in the
survey ..................................................................... 5 Windsor..................................................................34
Table 2: Indicators in the survey, weighting in the ranking, Winnipeg ............................................................... 35
best value achieved and ideal value ............................. 6
Table 3: Normalized score, ranking and letter grade of the
Census Metropolitan Areas (CMA) ................................. 7
GreenApple Canada 2007 - Performance Comparison of the
27 Largest Urban Regions in Canada ............................. 8
Canadian City Ranking Results
Abbotsford ............................................................... 9
Barrie .................................................................... 10
Calgary .................................................................. 11
Edmonton .............................................................. 12
Halifax .................................................................. 13
Sauder School of Business Professors
Hamilton ............................................................... 14 Daniel Muzyka (left) and James Tansey
Kelowna................................................................. 15 (right) join Barry Appleton at the release
of the 2007 GreenApple Canada SMART
Kingston ................................................................ 16
Transportation Ranking Report
Kitchener-Waterloo .................................................. 17
London .................................................................. 18
Moncton ................................................................ 19
Montréal ................................................................ 20
Oshawa.................................................................. 21
Ottawa-Gatineau ..................................................... 22
Québec City ............................................................ 23
Regina................................................................... 24
www.appletonfoundation.org1 GreenApple Canada 2008 | SMART Transportation Ranking Report
Summary
The publication of the first GreenApple Smart Transportation This year’s GreenApple Ranking Report highlights the examples
Ranking in 2007 represented a significant milestone in the of leadership across Canada’s urban centres. The GreenApple
evaluation of sustainability policy in Canada’s 27 largest cities. Canada Report suggests that there has been real progress in
The first Report received national and international coverage in most areas over the last 12 months. As new policy initiatives
the media and was well-received by mayors and municipalities. emerge, including the Western Climate Initiative and as policy
makers continue to search for the holy grail of sustainability, we
In the introduction to that first Report, we noted that the
hope this year’s GreenApple Canada Ranking Report will provide
planet had reached a critical threshold in 2007, with more
further guidance and feedback to the people most responsible for
than 50% of the population living in cities, for the first time in
shaping the future of Canada’s urban centres.
human history. Homo Urbanis, the new species we identified in
the recent fossil record has had a very difficult time in the 12
months since our first Report. Global pressure on oil supplies
drove up energy prices to unprecedented levels affecting home Climate Change
heating and transportation in particular. The mobility we have
taken for granted as a result of decades-low energy prices City planners have been struggling for decades to find the right
became a luxury good. Sales of larger vehicles fell dramatically balance between the convenience of mobility and the social
as consumers started to look more closely at fuel efficiency and environmental impacts of transportation systems. Cities
statistics. As we started gathering data for the 2008 study, the like Amsterdam and Curitiba, Brazil have shown leadership in
team speculated about whether consumers would also respond developing integrated transit and land use systems that are
by purchasing less fuel. While there is some variability, the data being copied in other parts of the world. The problem of climate
suggests that fuel consumption increased by an average of 2% change has given new momentum to this challenge. Between
over the course of the year. This illustrates the extent to which 1990 and 2004, emissions in the 40 most developed countries
consumers are locked into their transportation habits by the kind identified in the Kyoto protocol decreased by 3.3% overall from
of infrastructure a city provides for them. Emissions vary from 18.6 billion tonnes to 17.9 billion tonnes, but this hides the
city to city, from a low of 2 tonnes per capita to a high of over real variation between countries. While Lithuania’s emissions fell
4 tonnes per capita. The stability of demand shows the extent to by 60.4%, largely because of the collapse of the Soviet Union,
which the choices of city planners create long-term legacies with emissions in the US grew by 15.8% and emissions from Canada
respect to the sustainability of cities. grew by 26.6% from 598,911 Gigatons to 758,067 Gigatons CO2
equivalent. Overall, emissions in Canada are the third highest in
The second assault on Homo Urbanis in 2008 was the contraction the industrial world at 23.5 tonnes per capita. While this includes
of housing markets across the globe. While there has been a industrial emissions, even direct emissions from household and
slowdown in the rate of construction across Canada, one of the individual consumption are among the highest in the industrial
positive results to emerge from this survey is that many areas world. Most worryingly, global emissions from transport grew
increased the density of their housing starts. Density is the faster than any other sector: 23.3% in this period. Emissions from
ultimate ally of sustainable transportation. the transportation sector in Canada grew by 32.8% (48.8 million
This Report tries to do three things. First we set out to collect tonnes) between 1990 and 2005 and emissions from light duty
data on the sustainability of the transportation systems of the 27 gasoline trucks grew by 109% in this period, a trend explained by
largest urban areas in Canada. Secondly, we ranked these areas to the popularity of sport utility vehicles.1
show how some areas have adapted to the challenge of improving We have focused on transportation in this Report because it
their transportation systems. We hope that by ranking urban is the fastest growing source of emissions and also because it
regions in this way, we can energize a spirit of adaptation and is the sector where the capacity for change is greatest. From
competition among the mayors and political leaders responsible the hybrid vehicles developed by Honda and Toyota to the
for making critical decisions about the type of mobility their biodiesel and hybrid buses already being tested on Canada’s
citizens will enjoy in the future. Thirdly, our expert panel, created roads, transportation emissions reductions are feasible and can
to assist us in our inaugural 2007 study, established performance be implemented quickly. In contrast, it is hard to quickly reduce
targets for the variables, which they believe are achievable emissions from electricity generation, manufacturing processes
within ten years. The performance targets are shown in this year’s and industrial plants. We believe Homo Urbanis can move quickly
Report, creating a comparison between the two years, which will if the incentives are right.
show real progress towards these ideal goals.
City planning is a long and detailed process; we would not expect
to see radical changes manifest over the course of a single year. Canada’s Cities
Nonetheless, the ranking has been designed in such a way that
cities can reap significant rewards for proactive policy making. People traveling to Canada are surprised to learn that despite it
For instance, the adoption of proactive public policies allowed being the second largest country in the world, with vast areas of
the greater Kelowna urban region to move up four places from cheap undeveloped land, most people live in cities and towns.
last year in the 2008 GreenApple Canada Smart Transportation Canada is one of the more urbanized countries in the world with
Ranking Report.
1 United Nations Framework Convention on Climate Change. (2003) “Report
on the in-depth review of the third national communication of Canada and
UNFCCC”.
www.appletonfoundation.orgGreenApple Canada 2008 | SMART Transportation Ranking Report 2
81.1%2 of the population residing in urban areas. Over 85% of in North America, while the remainder are in Australia. North
the population lives within 350km of the US border, mostly in America faces unique challenges when it comes to tackling
medium and large cities.3 This survey focuses on the 27 largest the sustainability of its cities. While average emissions in the
urban regions in Canada that are home to about 20.7 million American cities Kenworthy studied were almost double the
people or 77% of the total urban population. In defining the emissions of the Canadian cities sampled, our average emissions
city, we focus on what is called the ‘Census Metropolitan Area’ per capita are still double or triple the figure for comparable
(CMA), which may include a number of different municipalities. European cities.
The Vancouver Municipal region, for instance, includes a number
of distinct municipalities including Richmond, West Vancouver,
Langley, Delta and New Westminster. The Toronto region contains Many of the causes of unsustainable transportation practices are
twenty-four separate entities. In selecting these boundaries built into the structure and layout of the cities. Once suburbs
we had to find a balance between the size of the city, the and freeways have been built, it is hard to reduce travel and
geographic coverage of the survey and the availability of data. emissions. Alternative mass transit options become essential
The smallest urban region on our list is Moncton, with 126,000 and efforts to increase density using in-fill and location-specific
residents, while the largest is Toronto with 5.1 million. The cities mortgages can be highly effective. While it is impossible for
studied in the GreenApple Canada 2008 Report are spread across a city to limit what cars citizens can buy, a number of cities
the country with representatives from most of the provinces. have discussed differential charging for congestion and toll
These urban areas have very different histories and economies charges based on engine size. This alternative is currently being
but share common transportation challenges. The full list of considered as an enhancement to the congestion charge in
census metropolitan areas we included in this study is in Table 1. London. Ultimately, policies to improve the sustainability of
transportation must be a combination of "carrots and sticks".
The argument for focusing on urban regions is simple: density
The most innovative cities have expanded the range of services
makes transportation policy easier to implement. While rural
they offer, improving the quality of transit.
areas have their own challenges to face, if policy makers
in cities, provinces and the federal government focus their
efforts on urban areas, they can have the biggest influence on
energy use, greenhouse gas emissions and land use policies. Finding the data
For this reason, the Clinton Foundation has brought together For all the great virtues of the Canadian federal system, it
approximately forty cities to develop strategies for reducing makes data collection much more difficult. Just as laws vary
greenhouse gas emissions.4 The GreenApple Canada Report among provinces, so do data collection standards. Unlike more
looks beyond greenhouse gas emissions to consider the overall centralized countries like the United Kingdom, there are very
sustainability of cities: we need to reduce emissions and create few national agencies that collect all the key data required for
liveable urban centres for the new millennium. The variables we a survey like this. Statistics Canada was an important source,
selected focus on air quality, innovation and best practices in but for some data—such as carbon dioxide emissions from
Canada. transportation—we performed primary data collection. A full
As will become clear below, there is a great deal of variation account of our approach to data collection is provided separately.
between the cities selected for this Report, across a range of In the absence of shared standards, we had to make our own
variables. International comparisons are always difficult, because judgments about the best available data. The GreenApple
of variation in measurement protocols. Australian researcher Jeff team was guided by an expert panel at the University of
Kenworthy has reviewed approximately 100 cities globally and British Columbia composed of a range of disciplines including
has compared their performance across a shared list of variables.5 atmospheric chemistry, economics and epidemiology. The Report
Focusing just on carbon dioxide emissions, the highest emissions marks the first attempt to pull this data together in Canada.
of carbon dioxide per capita from private transportation can There are areas for improvement, but the GreenApple team is
be found in Atlanta at 7.5 tonnes per annum, followed by confident that the general findings of the GreenApple Report are
Houston at just over 6 tonnes per annum. Emissions per capita robust and more importantly, that the Report will stimulate an
are broadly related to wealth, but a number of countries defy interest in improving the quality of data collection in Canada.
this convention: emissions per capita are around 0.5 tonnes In completing this GreenApple Canada Report we hope we have
per annum in Hong Kong and approximately 0.75 tonnes per filled a vacuum in the area of sustainable transportation, and
annum in Barcelona. Cities in developed countries that keep also in the measurement of greenhouse gas emissions nationally.
their emissions below 1 tonne per capita include Seoul, Tokyo, It is difficult to measure how much carbon dioxide is emitted
Helsinki, Singapore, Osaka and Prague. Emissions in London, annually and it may come as a surprise that the Kyoto Protocol
England are around 1.25 tonnes per capita. Of the top nineteen recognizes that uncertainty about the precise figure is as high
cities, all of whom emit over 2 tonnes per capita, most are as 4%6, while the uncertainty around methane emissions is much
higher. The data that we have gathered for this Report provide a
2 United Nations Framework Convention on Climate Change. (2006) “GHG
Data 2006: Highlights from Greenhouse Gas (GHG) Emissions Data for 1990- useful cross-reference for national inventories. More importantly,
2004 Annex 1 Parties”. Retrieved November 6, 2008 from: http://unfccc.int/ it is difficult for cities to gauge their performance if they cannot
files/essential_background/background_publications_htmlpdf/application/pdf/ compare themselves with the competition.
ghg_booklet_06.pdf
3 Global Virtual University. (Date unknown) “Indicator – Urban Population Recognizing that many organizations will want to provide
2005”. Retrieved November 6, 2008 from: http://globalis.gvu.unu.edu/ feedback about the GreenApple Canada 2008 Report or, in some
indicator.cfm?Country=CA&IndicatorID=30#rowCA
4 C40 Cities: Climate Leadership group, 2008: http://www.c40cities.org/
cases, may wish to propose alternate data sources, information
about/ (Date Accessed: November 09, 2008). 6 United Nations Framework Convention on Climate Change. (2006) “GHG
5 Kenworthy, JR. (2003) “Transport Energy Use and Greenhouse Gases in Data 2006: Highlights from Greenhouse Gas (GHG) Emissions Data for 1990-
Urban Passenger Transport Systems: A Study of 84 Global Cities”. Retrieved 2004 Annex 1 Parties”. Retrieved November 6, 2008 from: http://unfccc.int/
November 6, 2008 from: http://cst.uwinnipeg.ca/documents/Transport_ files/essential_background/background_publications_htmlpdf/application/pdf/
Greenhouse.pdf ghg_booklet_06.pdf
www.appletonfoundation.org3 GreenApple Canada 2008 | SMART Transportation Ranking Report
about the GreenApple Canada Ranking Report is available on the Victoria, British Columbia is the winner in this year’s ranking,
GreenApple section of the Appleton Foundation website (www. securing a grade of B+, closely followed by Vancouver and
appletonfoundation.org). Ottawa-Gatineau. In fact, the top seven census metropolitan
areas stand out as being the leaders in sustainable transportation
in Canada and the remaining cities have each been awarded a
Building a Ranking grade of B. These top seven metropolitan areas range in size
from 330,000 people in Victoria to 5.1 million in Toronto and are
At each step along the way, a group of experts, listed in the spread across four provinces. In total, these seven urban regions
introduction, worked with a steering committee to review the are home to over 13 million Canadian residents. All seven
data we gathered and offered judgements about the quality of of these regions deserve real recognition for what they have
the sources. We started with a much longer list of variables and accomplished. There were some changes among the top seven
only those of sufficiently high quality are reported here. Once the urban areas with Winnipeg slipping from 4th place to 6th place
final list of variables had been assembled, the team of experts and Montreal rising to 4th place with a notable improvement in a
provided weights for the variables, so that the final score for an number of areas.
urban area captured the relative importance of the variable in Focusing on Victoria, the winner of the GreenApple Canada 2008
contributing to the sustainability of the transport system. The ranking, this urban area continues to improve in a number of
methods used for developing the weights and the method for areas: the city has the highest proportion of municipal and
normalizing and adding up the variables into a single score are transit fleet vehicles using Alternative Fuels. The municipal
documented in the appendices and in separate documentation. fleet contains a high number of alternative fuel vehicles (AFVs):
The list of variables and their relative weights in the final index rising 8% this year to 44% of the total fleet. Emissions of carbon
as well the maximum values and ideal values for each variable is dioxide per capita are well below the average of 2.5 tonnes at
presented in Table 2. The expert panel assigned the ideal values 2.1 tonnes and levels of ozone—a key air quality variable—are
and they reflect what was considered achievable for the cities among the best observed in our study. In Victoria, 61% of
within a decade. For some variables the ideal is the lowest value housing starts are row and apartment units, compared to an
achieved by the existing cities; for other variables the threshold average of 40% across the 27 metropolitan areas and 52% of the
has not been achieved by any of the cities. total stock of housing is composed of row and apartment units,
Canada can be proud of being home to some of the most compared to an average of 40%. Victoria benefits from the fact
sustainable cities in North America, but it will require a that the Province of British Columbia offers tax incentives to
significant amount of effort and innovation to fulfill our Kyoto shift to low emission vehicles and the region has a high level of
obligations, let alone to achieve the cuts in emissions necessary transit ridership, with 26% of the population walking, riding or
to tackle climate change. In light of this, we assigned grades taking the bus to work. Victoria saw a significant growth in the
to the cities reflecting their performance relative to a set of coverage of anti-idling bylaws within its full urban region and
overall goals; we identified ideal targets for each of the variables, the conversion of the transit fleet to alternative fuel sources.
presented graphically in the next section of this Report. Vancouver comes in second and saw the greatest increase in
There is no ‘straight A’ student in this survey; no single city the number of people walking, cycling or taking transit to work.
received top marks for every variable. Given the scale of climate Vancouver also has the highest number of housing starts in
challenge, every city shows room for improvement. Instead, we medium and high density categories and has the highest level of
assigned grades to census metropolitan areas and identified the annual transit revenue kilometres per capita. Vancouver performs
top performer for each variable. Graphs and figures in the last well across a number of the variables including use of alternative
section of this Report show the variation among the urban areas fuels in its municipal fleet. Vancouver also has a significant
and also illustrate what our expert panel considered to be the number of hybrid taxis, growing 6% to 16.4% of the total fleet
ideal score for each variable. this year. These are all significant achievements worthy of a silver
medal performance in Canada.
In third place, the Ottawa-Gatineau urban region has been very
The Results successful at creating a scheme that allows transit riders to
purchase transit passes through their employers. Transit passes,
While the overall ranking remained fairly stable, this hides in general, are very affordable when adjusted for income levels.
significant change by a number of CMAs included in the survey. The region held its position with a consistent performance
We will highlight what progress has been made. across a number of variables. The major improvement was in the
number of Alternate Fuel Vehicles in the transit fleet. Over 28%
Table 3 shows the final ranking of Canada’s 27 largest cities of workers in the metropolitan area walk, ride or take the bus to
including the final score awarded to that city and the letter work, the second highest figure overall. Ottawa-Gatineau has a
grade. Within each city's ranking results ten year target values high number of housing starts in the form of row housing and
are listed. Ideal values were calculated for all variables to provide apartments units (around 49% of the total number of housing
some indication of what might represent realistic targets for the starts) and 95% of the population of the region is subject to
urban areas. In some cases, like that of anti-idling bylaws, the anti-idling bylaws, which encourage drivers to switch off their
panel deemed the ideal level to be 100% coverage within ten engines when they are stationary.
years. In most cases, the ideal level within ten years was not
immediately apparent. Given that the road transportation sector The remaining metropolitan areas within this leading group of
is responsible for the sharp rise in greenhouse gas emissions seven all excel in some areas and are weaker in others.
during the past half century, the expert panel devised the Toronto has the fourth best performance in vehicles per capita
following approach for these cases. The ideal target represents of any of the cities and has the third highest number of workers
a cut to 6% below 1990 levels. This reduction reflects Canada’s bicycling, walking, or taking public transit to work at just under
announced intentions under the Kyoto protocol.
www.appletonfoundation.orgGreenApple Canada 2008 | SMART Transportation Ranking Report 4
28%, a figure exceeded only by Montréal and Ottawa-Gatineau. In every class, there are students who simply fail. The last group
The total stock of row and apartment housing is high at 50%, composed of Barrie, Moncton, Greater Sudbury, and St. John's
although the number of housing starts in this category declined (Newfoundland) was graded by the expert panel with a failing
7% to 47% in 2008. grade of ‘F’ reflecting poor performance across a number of
variables. As the St. Catharines-Niagara region this year clearly
Montréal performs well overall and distinguishes itself in two
demonstrates, all four of these regions have the potential to
areas: it has the highest stock of row housing or apartments
improve their failing grades next year. These municipalities need
at 62% of the total and it has the highest number of citizens
to pay attention to the majority of urban centres in Canada who
walking, riding or taking the bus to work. Montréal’s ranking
are better at addressing sustainable transportation. Just 15% of
was boosted this year by declines in carbon monoxide and ozone
St. John's, Newfoundland housing starts take the form of higher
levels and by the introduction of Alternative Fuel Vehicles to the
density housing; Barrie, Ontario registered a 8% improvement in
transit fleet.
this figure over last year. A number of cities including Moncton
Winnipeg does well in a number of areas; notably it has free and Greater Sudbury continue to have no anti-idling policies.
transit in the downtown core. These are all best practices in
A number of cities, including London and Sherbrooke have no
sustainable transportation and have greatly contributed to
hybrid vehicles in their taxi fleets and in some cases this is
Winnipeg’s high scores. Winnipeg also has relatively low carbon
because local bylaws prohibit the use of hybrid vehicles. New
dioxide emissions per capita and lower vehicle ownership than
York had this problem until recently, when the Mayor showed
average.
that strong local leadership can make a difference. Kelowna saw
Québec City moved up one grade to a ‘B’ this year improving a significant jump to 6.2% hybrid vehicles in the overall fleet.
its score by 4 points. The Québec City region saw best in class While a municipality can provide transit passes to employees and
improvements in a number of areas, including a decrease in can encourage other employers to do the same, changing travel
the number of registered vehicles per capita, an increase in the habits is more difficult.
percentage of its population living under anti-idling bylaws.
Larger metropolitan areas might appear to have an advantage
Québec also has dense housing stock and housing starts –
in our ranking, because they are able to generate economies
factors that can greatly contribute to municipal sustainable
of scale and can afford to make larger scale investments in
transportation policies.
sophisticated transport systems. There is a moderate correlation
The next group of cities received a grade of ‘C’ overall. These between city size and score, but the presence of Victoria and
six cities—Hamilton, Sherbrooke, Kelowna, Kingston, Saguenay Winnipeg in the top seven metropolitan areas and Edmonton and
and London—scored significantly lower on average across the Calgary in the middle of the pack shows that this relationship is
full list of variables, although a number of cities performed well complicated. In the 2008 GreenApple Canada Ranking Report, we
in some areas. The Hamilton metropolitan area has the highest can see once again that consistent application of best practices
proportion of the population subject to anti-idling bylaws and across policy categories results in the best overall results.
offers the largest discount among the major urban regions to its Victoria has demonstrated that a smaller city can be a leader in
municipal employees who buy transit passes at work. Hamilton sustainable transportation. This year, Kelowna has demonstrated
also has a high proportion of its transit fleet using Alternative that rapid progress through the ranks is possible by consistently
Fuel Vehicles - at 41% of the total fleet. Despite this, the number focusing on small, consistent, sustainable transportation policy
people walking, riding or taking transit to work in Hamilton is gains.
average at 15% of the total. Sherbrooke has low carbon dioxide
emissions per capita and performs well in terms of the housing
density measures. Kingston also has better than average carbon
dioxide emissions per capita and the authorities in the Kingston
metropolitan area have also been proactive in establishing anti-
idling bylaws.
The third group of cities barely received a pass with a grade of ‘D’
overall. The regions with low grades include the fifth and sixth
largest metropolitan areas in Canada: Calgary and Edmonton,
respectively. The problems that these two metropolitan areas
face are well known and are illustrated in the ranking if one
looks at high-density housing starts and high-density housing
stock. In both cases, around 35% of housing starts are row
houses or apartments and around a third of housing stock is in
the form of row housing or apartments. As a result, Calgary has
high carbon dioxide emissions per capita and the highest level
of vehicle ownership per capita. Calgary fell three places in the
GreenApple Canada 2008 ranking and recorded a 5% rise in CO2
emissions per capita. The other metropolitan areas in this group
are Abbotsford, Kitchener-Waterloo, Halifax, Regina, Edmonton,
Calgary, Windsor, Saskatoon, Oshawa and St. Catharines-Niagara.
We note that the St. Catharines-Niagara region recovered from
a failing grade last year as a result of the expansion of coverage
of anti-idling bylaws within its region, in addition to the
introduction of Alternative Fuel Vehicles to its transit fleet.
www.appletonfoundation.org5 GreenApple Canada 2008 | SMART Transportation Ranking Report
GreenApple Canada 2008 SMART Transportation Ranking Report
Tables & Maps
Table 1: Census Metropolitan Areas (CMAs) included in the survey
Census Metropolitan Areas (2006 Census Data) Population '000
Toronto (Ont.) 5,113
Montréal (Qué.) 3,636
Vancouver (B.C.) 2,117
Ottawa–Gatineau (Ont.–Qué.) 1,131
Calgary (Alta.) 1,079
Edmonton (Alta.) 1,035
Québec (Qué.) 716
Winnipeg (Man.) 695
Hamilton (Ont.) 693
London (Ont.) 458
Kitchener-Waterloo (Ont.) 451
St. Catharines–Niagara (Ont.) 390
Halifax (N.S.) 373
Oshawa (Ont.) 331
Victoria (B.C.) 330
Windsor (Ont.) 323
Saskatoon (Sask.) 234
Regina (Sask.) 195
Sherbrooke (Qué.) 187
St. John's (N.L.) 181
Barrie (Ont.) 177
Kelowna (B.C.) 162
Abbotsford (B.C.) 159
Greater Sudbury (Ont.) 158
Kingston (Ont.) 152.4
Saguenay (Qué.) 151.6
Moncton (N.B.) 126
Source:
Statistics Canada. (2007, March 29). Table 3: Population of census metropolitan areas in 2006. Ottawa. Retrieved April 26, 2007 from
http://www12.statcan.ca/english/census06/analysis/popdwell/tables/table3.htm
www.appletonfoundation.orgGreenApple Canada 2008 | SMART Transportation Ranking Report 6
Table 2: Indicators in the survey, weighting in the ranking and best value achieved
GreenApple Canada 2008 SMART Transportation Ranking Report
Category Name Weighting Best Value Winner
CO2 emissions per capita (tonnes) from retail fuel sales (2007) 3 2.0 Saguenay
CO parts per million, median of maximum daily 1 hour averages (2006) 2 0.1 Halifax
O3 parts per billion, median of daily maximum 8 hour averages (2006) 2 27 Regina
Registered vehicles per capita (2007) 1 0.49 Montréal
Percentage of the population living under an anti-idling bylaw (2008) 1 97% Hamilton
Percentage of housing starts within the CMA that were apartment or row 3 76% Vancouver
units (2007)
Percentage discount on a local transit pass accorded employees of the 1 51% Hamilton
CMA’s largest city who purchase the pass at work (2008)
Percentage of the cost difference between the 2008 Honda Civic 2 24% Winnipeg
gasoline and hybrid models covered by provincial tax incentives (2008)
Percentage of the CMA housing stock that is defined as either 2 62% Montréal
apartments or row units (2006)
Annual public transit regular revenue service kilometers traveled per 2 55 Vancouver
capita, excluding heavy rail and commuter coach (2006)
Percentage of the CMA labour force bicycling, walking or taking public 3 29% Montréal
transit to work (2006)
Percentage of total public transit kilometers that are free in the 1 0.8% Calgary
downtown core (2007)
Population-weighted annual adult transit pass cost (2008) adjusted by 1 0.9% Abbotsford
2006 median family income
Percent of the CMA labour force holding employer issued transit passes 1 3.4% Ottawa-Gatineau
(2007)
Percentage of the CMA public transit bus fleet using alternative fuels, 1 100% Victoria, Abbotsford,
excluding commuter coach (March 2008) Kelowna, Saskatoon
Percentage of the CMA taxi and limousine fleet that is powered by 2 44% Winnipeg
hybrid gasoline-electric means (2008)
Percentage of the CMA municipal road fleet that is powered by 1 44% Victoria
alternative fuels (December 2007)
www.appletonfoundation.org7 GreenApple Canada 2008 | SMART Transportation Ranking Report
Table 3: Normalized score, ranking and letter grade of the Census Metropolitan Areas (CMA)
GreenApple Canada 2008 SMART Transportation Ranking Report
Rank Census Metropolitan Area (CMA) Normalized Grade Population (000's)
Score
1 Victoria (B.C.) 79.6 B+ 330
2 Vancouver (B.C.) 76.4 B 2,117
3 Ottawa–Gatineau (Ont.–Qué.) 71.1 B 1,131
4 Montréal (Qué.) 69.9 B 3,636
5 Toronto (Ont.) 68.2 B 5,113
6 Winnipeg (Man.) 67.4 B 695
7 Québec (Qué.) 63.3 B 716
8 Hamilton (Ont.) 59.0 C 693
9 Sherbrooke (Qué.) 57.1 C 187
10 Kelowna (B.C.) 55.9 C 162
11 Kingston (Ont.) 54.9 C 152
12 Saguenay (Qué.) 53.8 C 152
13 London (Ont.) 53.6 C 458
14 Abbotsford (B.C.) 53.2 D 159
15 Kitchener (Ont.) 50.9 D 451
16 Halifax (N.S.) 50.7 D 373
17 Regina (Sask.) 49.5 D 195
18 Edmonton (Alta.) 47.8 D 1,035
19 Calgary (Alta.) 47.5 D 1,079
20 Windsor (Ont.) 47.3 D 323
21 Saskatoon (Sask.) 46.72 D 234
22 Oshawa (Ont.) 46.67 D 331
23 St. Catharines–Niagara (Ont.) 45.7 D 390
24 Barrie (Ont.) 42.9 F 177
25 Greater Sudbury (Ont.) 42.0 F 158
26 Moncton (N.B.) 41.3 F 126
27 St. John's (N.L.) 39.5 F 181
www.appletonfoundation.orgGreenApple Canada 2008 | SMART Transportation Ranking Report 8
GreenApple Canada 2008 SMART Transportation Ranking Report
Performance Comparison of the 27 Largest Urban Regions in Canada
Air Quality
Public Policy
Transportation Policy
Technology Adaptation
Kelowna Ottawa-Gatineau St. John's
Abbotsford Kingston Québec Greater Sudbury
Barrie Kitchener-Waterloo Regina Toronto
Calgary London Saguenay Vancouver
Edmonton Moncton Saskatoon Victoria
Halifax Montréal Sherbrooke Windsor
Hamilton Oshawa St. Catharines-Niagara Winnipeg
www.appletonfoundation.org9 GreenApple Canada 2008 | SMART Transportation Ranking Report
Abbotsford
D
GreenApple Ranking
2008 Rank:
Score:
14
53.2
GRADE:
British Columbia 2007 Rank: 14
Regional Population (2006): 159,200
Air Quality
Public Policy
Transportation Policy
Technology Adaptation
GreenApple Canada 2008 SMART Transportation Indicator Data Value Target
Air Quality
CO2 emissions per capita (tonnes) from retail fuel sales (2007) 4.1 1.5
CO parts per million, median of maximum daily 1 hour averages (2006) 0.50 5.0
O3 parts per billion, median of daily maximum 8 hour averages (2006) 33 26
Registered vehicles per capita (2007) 0.58 0.37
Public Policy
Percentage of the population living under an anti-idling bylaw (2008) 78% 100%
Percentage of housing starts that were apartment or row units (2007) 51% 89%
Percentage discount on a local transit pass accorded employees of the CMA’s largest city who purchase
0% 69%
the pass at work (2008)
Percentage of the cost difference between the 2008 Honda Civic gasoline and hybrid models covered by
22% 100%
provincial tax incentives (2008)
Transportation Policy
Percentage of the housing stock that is defined as either apartment or row units (2006) 46% 84%
Annual public transit regular revenue service kilometres traveled per capita, excluding heavy rail and
10 71
commuter coach (2006)
Percentage of the CMA labour force bicycling, walking or taking public transit to work (2006) 6% 37%
Percentage of total public transit kilometres that are free in the downtown core (2007) 0.0% 0.9%
Population-weighted annual adult transit pass cost (2008) adjusted by the CMA’s 2006 median family
0.9% 0.7%
income
Percentage of the labour force holding employer issued transit passes (2007) 0.0 4.2%
Technology Adoption
Percentage of the public transit bus fleet using alternative fuels, excluding commuter coach (2008) 100% 39.5%
Percentage of the taxi and limousine fleet that is powered by hybrid gasoline-electric means (2008) 1.7% 100%
Percentage of the municipal road fleet that is powered by alternative fuels (December 2007) 12% 48%
The Abbotsford region retained 14th place in the GreenApple the city has implemented four programs: bus buddies, medical
2008 Rankings.1 It has the lowest score for a major urban area in transportation, adopt-a-stop and a model bus stop.5
British Columbia, but still has a respectable placement compared
The City’s Official Plan contains several initiatives that
to urban settlements in other provinces.
Abbotsford has already implemented to address the
Air Quality values in the GreenApple 2008 Ranking Report environmental consequences of urban growth and development.
have shown dramatic improvements but this urban region still In order to prevent urban sprawl, policy encourages increasing
has a long way to go to catch up with other British Columbia the density of the downtown core and focuses new residential
communities covered by the GreenApple Report. Abbotsford and commercial areas in existing developments.
achieved an impressive 11% reduction in Carbon dioxide
Abbotsford can still improve its ranking for sustainable
emissions based on retail fuel sales, but despite this reduction,
transportation. Adoption of policies to address Transportation
it still had the highest per capita values in Canada for Carbon
Demand Management, for example would increase Abbotsford's
dioxide emissions produced from retail fuel sales.
ranking and encourage public transit ridership by reducing the
Abbotsford has municipal policies that support active and use of single occupancy vehicles.
sustainable transportation. These policies include a Bicycle
Master Plan2 and a Trail Development Strategy.3 Such policies
make alternative transportation options like biking, walking and
public transit more attractive. The Local Motion program will
construct a 10 km stretch of paved accessible pathway including:
bridges, boardwalks and pedestrian crossing at roadways.4
The Abbotsford Seniors' Transportation Initiative will improve
accessibility for seniors using public transit. Under the initiative,
1 The region of Abbotsford includes: Abbotsford (City), Fraser Valley H
(Regional district electoral area), Matsqui Main 2 (Indian reserve), Mission
(District municipality), and Upper Sumas 6 (Indian reserve).
2 City of Abbotsford. (2003, April) “Bicycle Master Plan”. Retrieved
November 4, 2008 from: http://www.abbotsford.ca/AssetFactory.aspx?did=2314
3 City of Abbotsford. (“Trail Development Strategy”. Retrieved November 4,
2008 from: http://www.abbotsford.ca/AssetFactory.aspx?did=2307
4 Official website of the Province of British Columbia http://www. 5 Access Abbotsford website: Retrieved November 6, 2008 from: http://www.
localmotion.gov.bc.ca/media/gallery/abbotsford/default.html accessabbotsford.ca/seniors.asp
www.appletonfoundation.orgYou can also read